
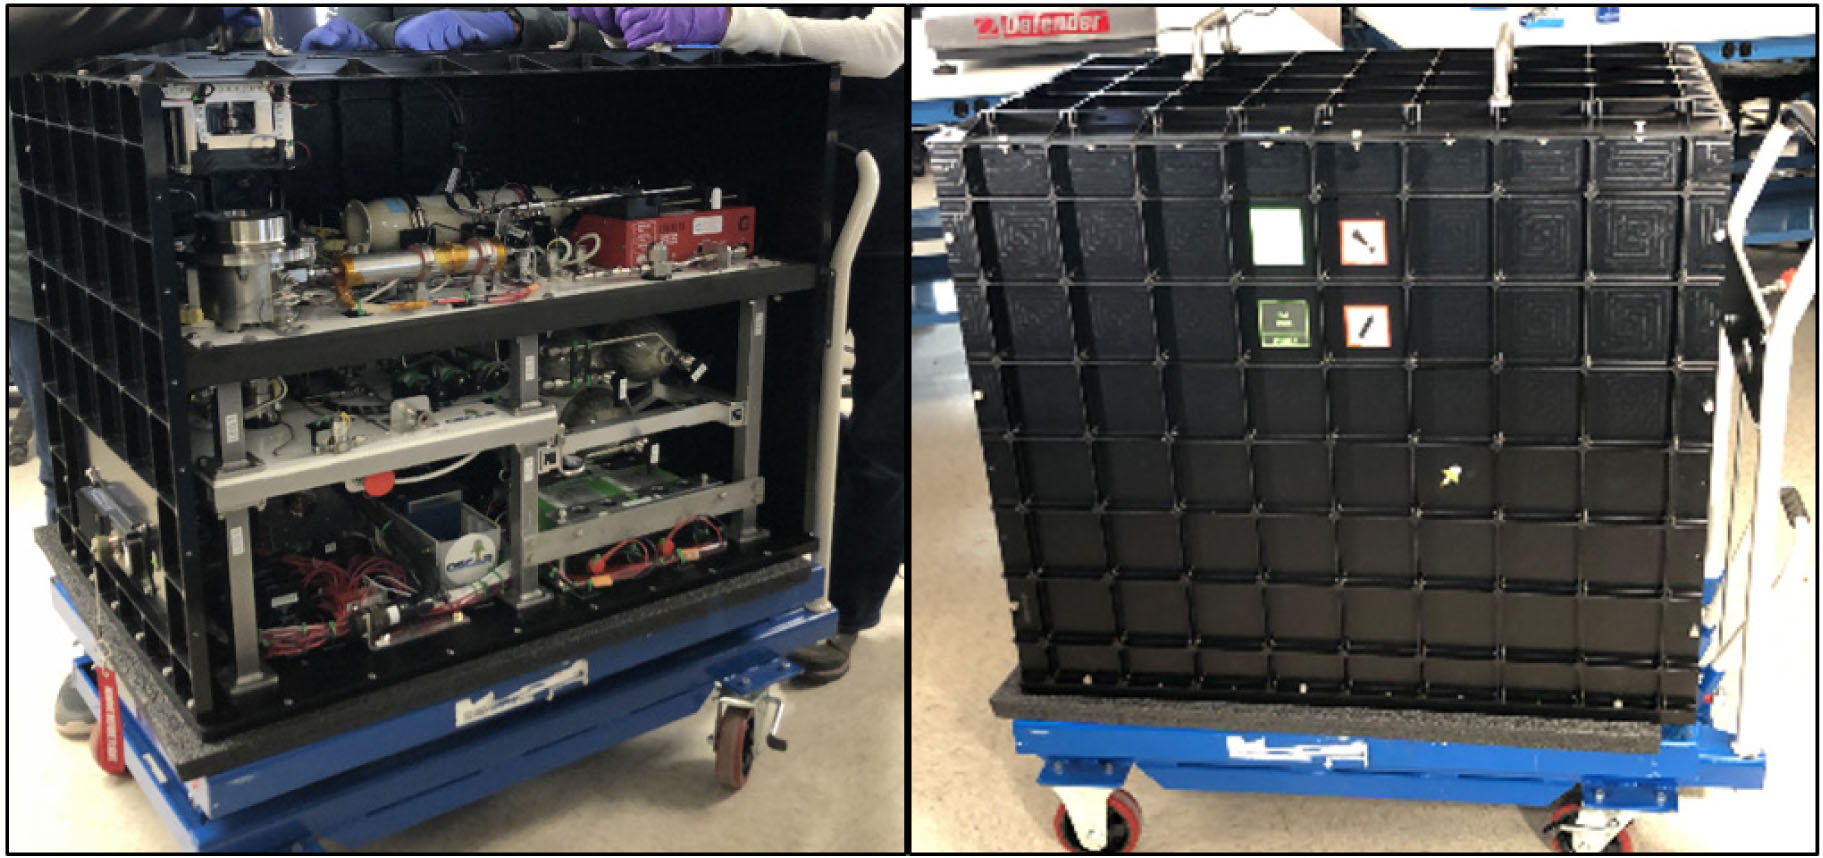
Figure 1
OSCAR suborbital payload enclosed in the FSE. Left: Front panel removed from FSE. Right: Front shelf of FSE installed on OSCAR suborbital payload during fit check.
Table 1
Solid to gas conversion reactions and generalized properties.
| Conversion process | Primary reaction | Primary products | Temperature (°C) | Space application references |
|---|---|---|---|---|
| Combustion (O2/air in) | CxHyOz + O2 → CO+ H2O+ (heat) | CO2, H2O, heat | 800–1200+ | Meier et al., 2020; Ruff and Urban, 2016; Sutliff et al., 2002 |
| Steam reforming (reduction process) | CxHyOz + H2O + (heat) → CO+ H2 CO+ H2O → CO2 + H2 +(heat) | CO2, H2O, cracked hydrocarbons, char | 650–1000 | Anthony and Hintze, 2014; Caraccio and Hintze, 2013; Caraccio et al., 2014 |
| Gasification (heat input with O2 and steam) | C+ H2O+ (heat) → CO + H2 C+ 2H2O+ (heat) → CO2 + H2 C+ CO2 + (heat) → 2CO C+ 2H2→ CH2 + H2O | CO, CO2, H2O, H2, CmHn, tar, char | >400 | Hintze et al., 2012; Meier et al., 2019 |
| Pyrolysis (heat input/no O2) | CxHyOz → CO+ H2 +(heat) | CO, CO2, H2O, organic vapors, char | 200–650 | Ewert et al., 2017; Fisher et al., 2018; Turner et al., 2014; Wheeler et al., 2012; Serio et al., 2014a; Wetzel et al., 2018; Wheeler et al., 2018 |
| Torrefaction (heat input/no O2) | Pyrolysis with biological materials | Char | 200–350 | Serio et al., 2014b, 2016, 2018, 2019 |
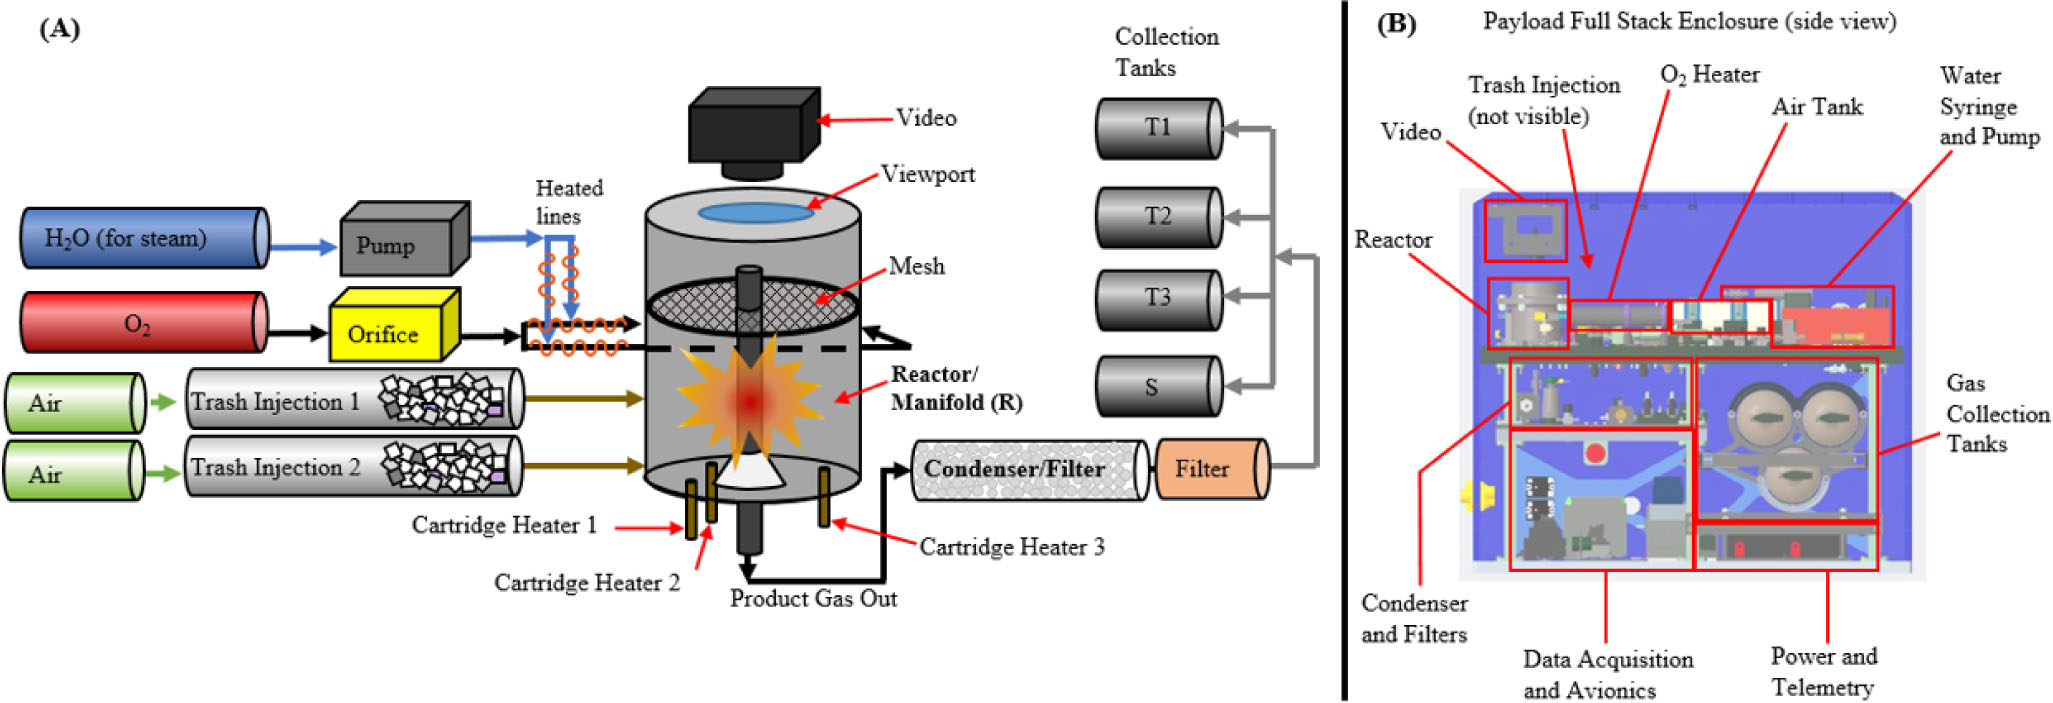
Figure 2
(A) General block diagram of payload operations. (B) Payload layout in NS Full Stack Enclosure.
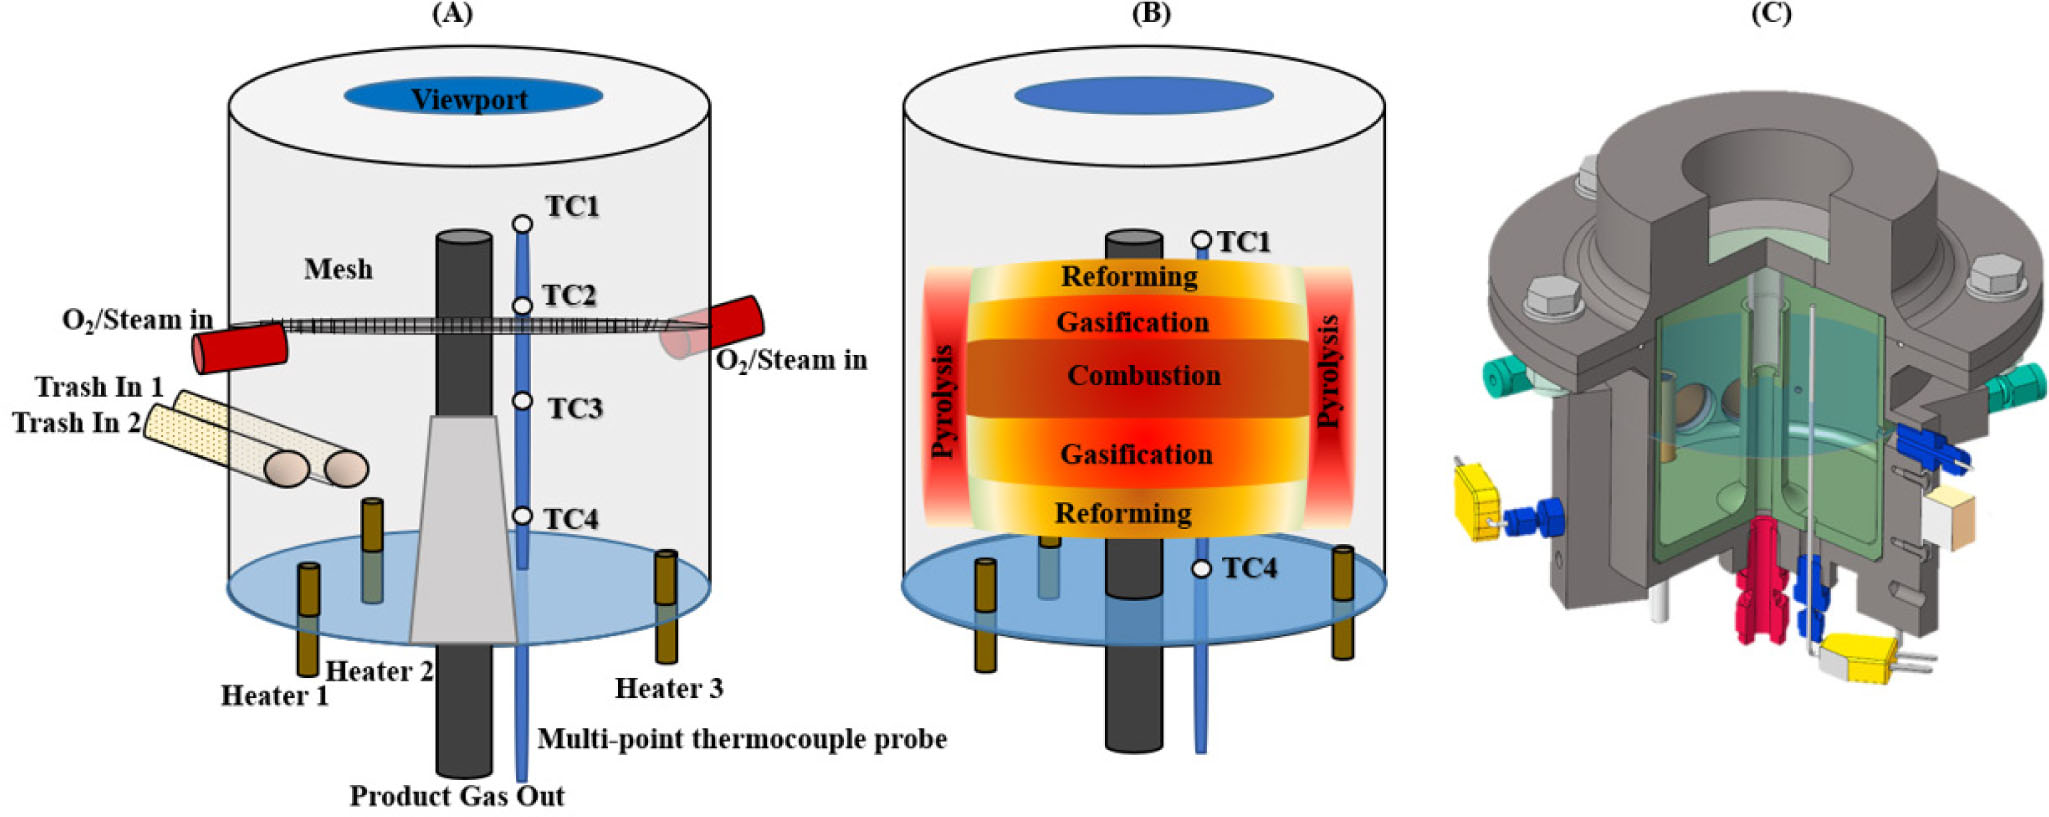
Figure 3
(A) Simple drawing of reactor internal parameters, including thermocouple locations (TC1-4), trash injection inlet (1 and 2), O2 and steam inlet ports, and cartridge heater locations. (B) Ideal or design locations of reactor thermal zones or expected temperature profile. (C) CAD model of reactor hardware with cut-away view.
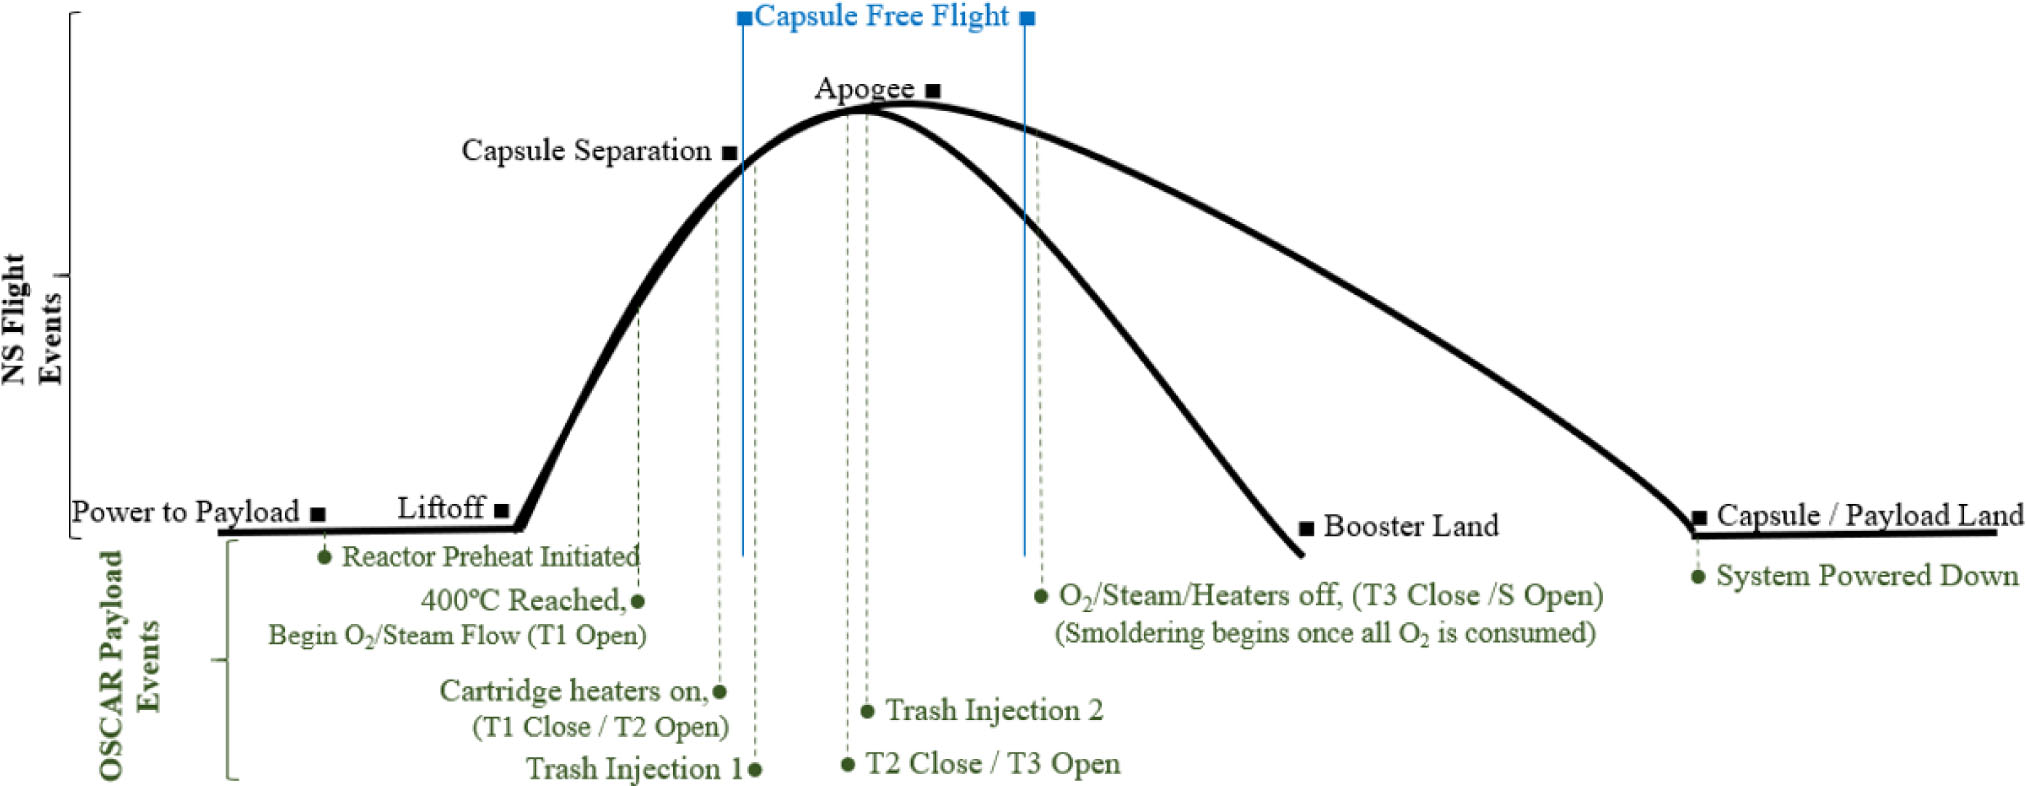
Figure 4
The NS Flight events in comparison to the OSCAR Payload flight events.
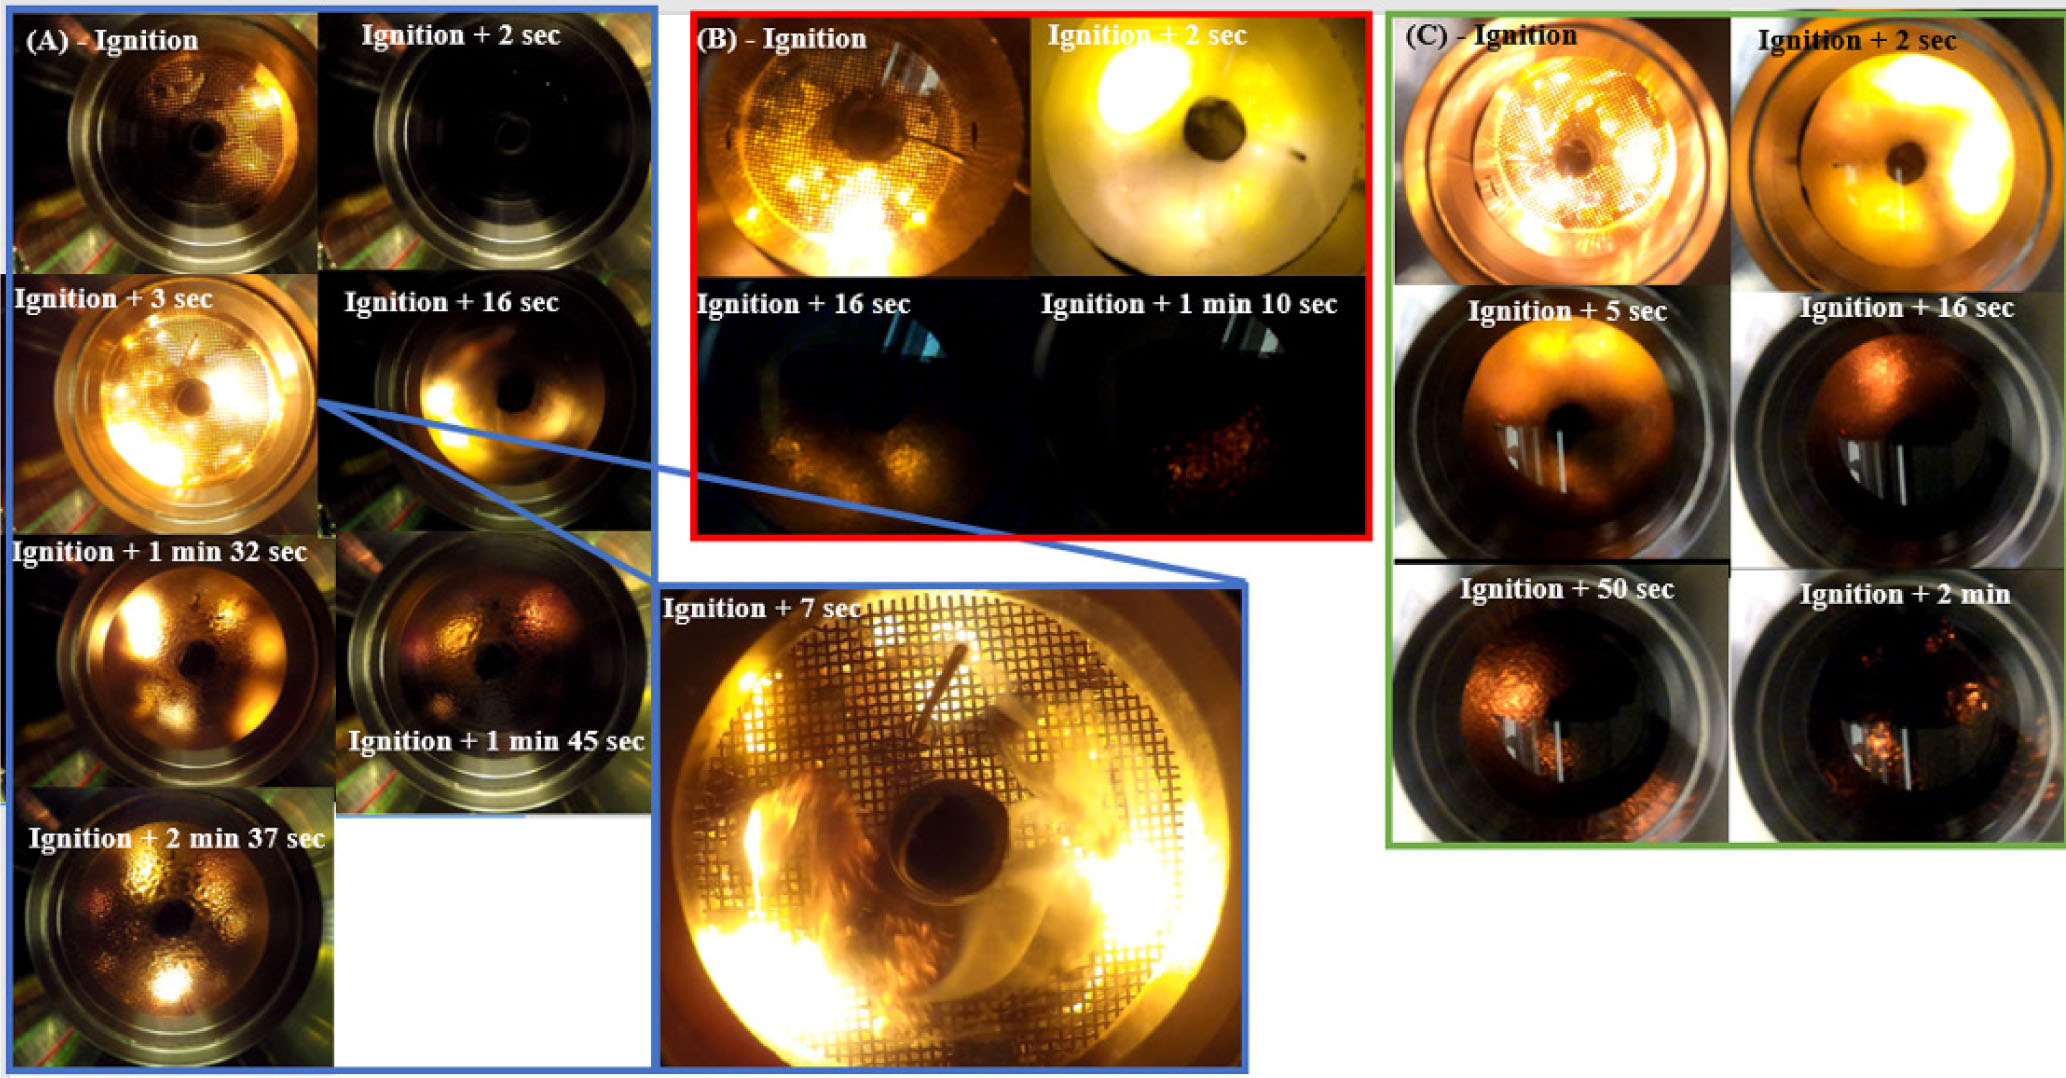
Figure 5
Image stills of the suborbital flight (A), and best suited ground test comparisons (B) and (C). Links to the actual video footage can be found here: Video for (A) https://images.nasa.gov/details-KSC-20191211-MH-OSC01_0003-OSCAR_Video_Upload_Flight_100-3266803; Video for (B): https://images.nasa.gov/details-KSC-20200619-MH-OSC01_0001-OSCAR_Video_Upload_Lab-He_110-3266803; Video for (C): https://images.nasa.gov/details-KSC-20200729-MH-OSC01_0002-OSCAR_Video_Upload_Lab-Air_120-3266803
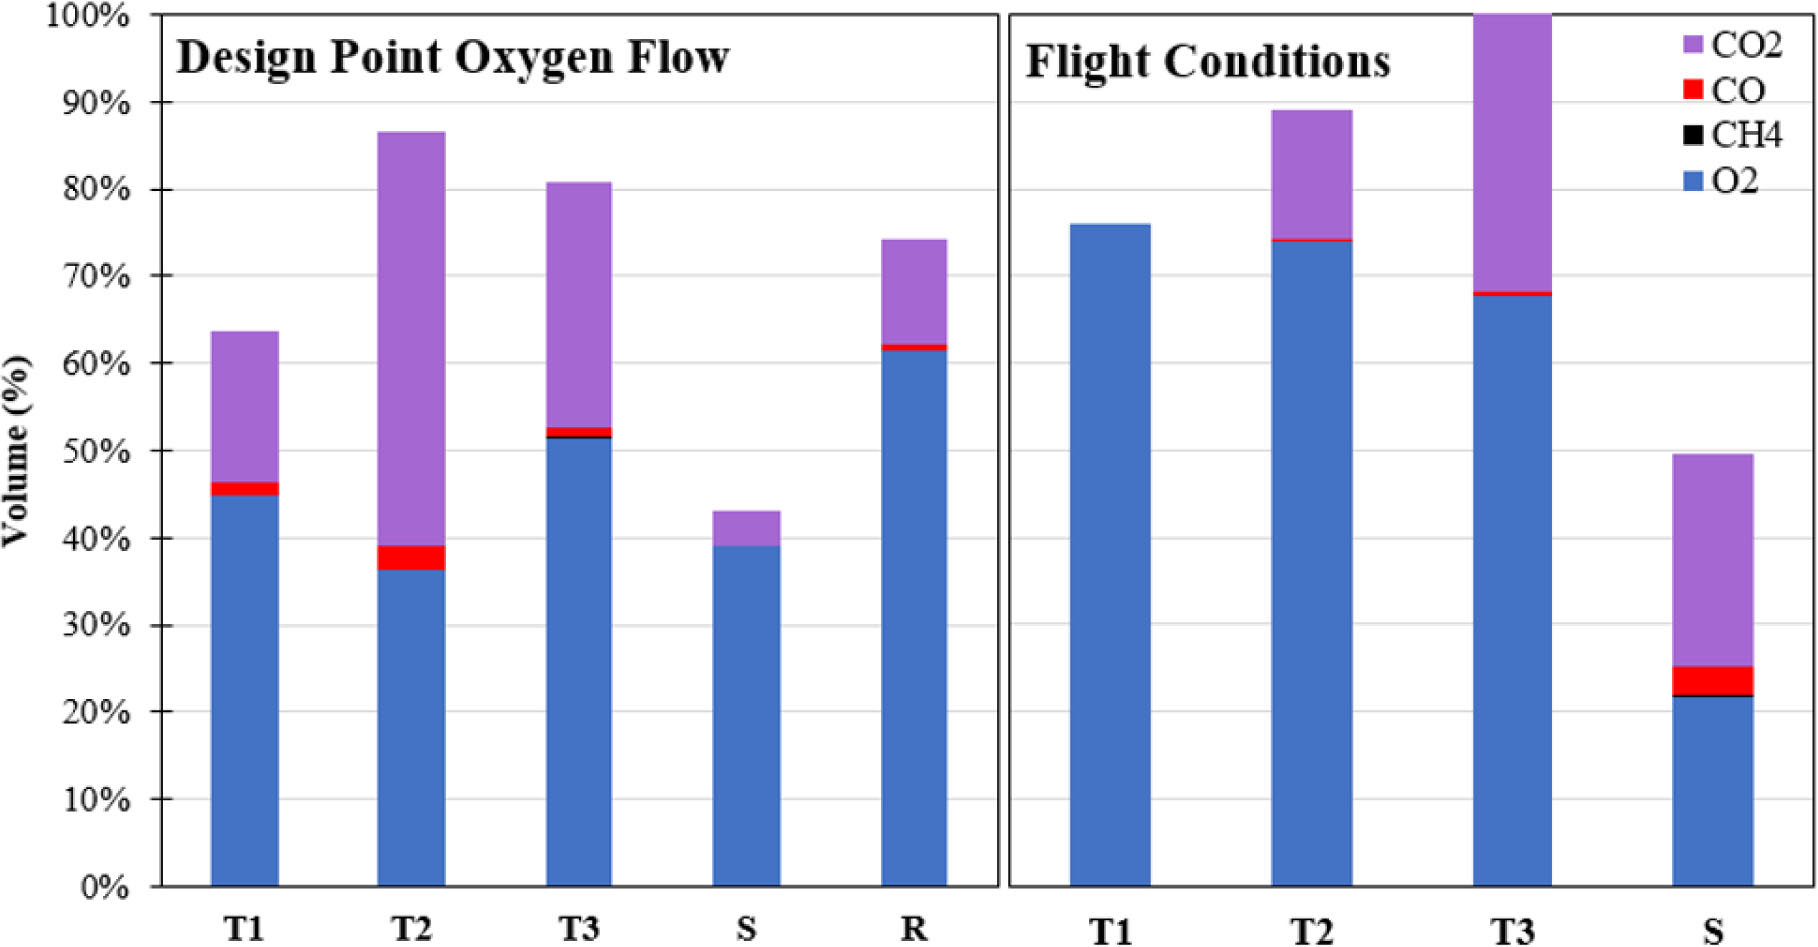
Figure 6
Gas production summary (Volume %) of gases produced during testing prior to flight (design point O2 flow) and during suborbital fight (flight conditions).
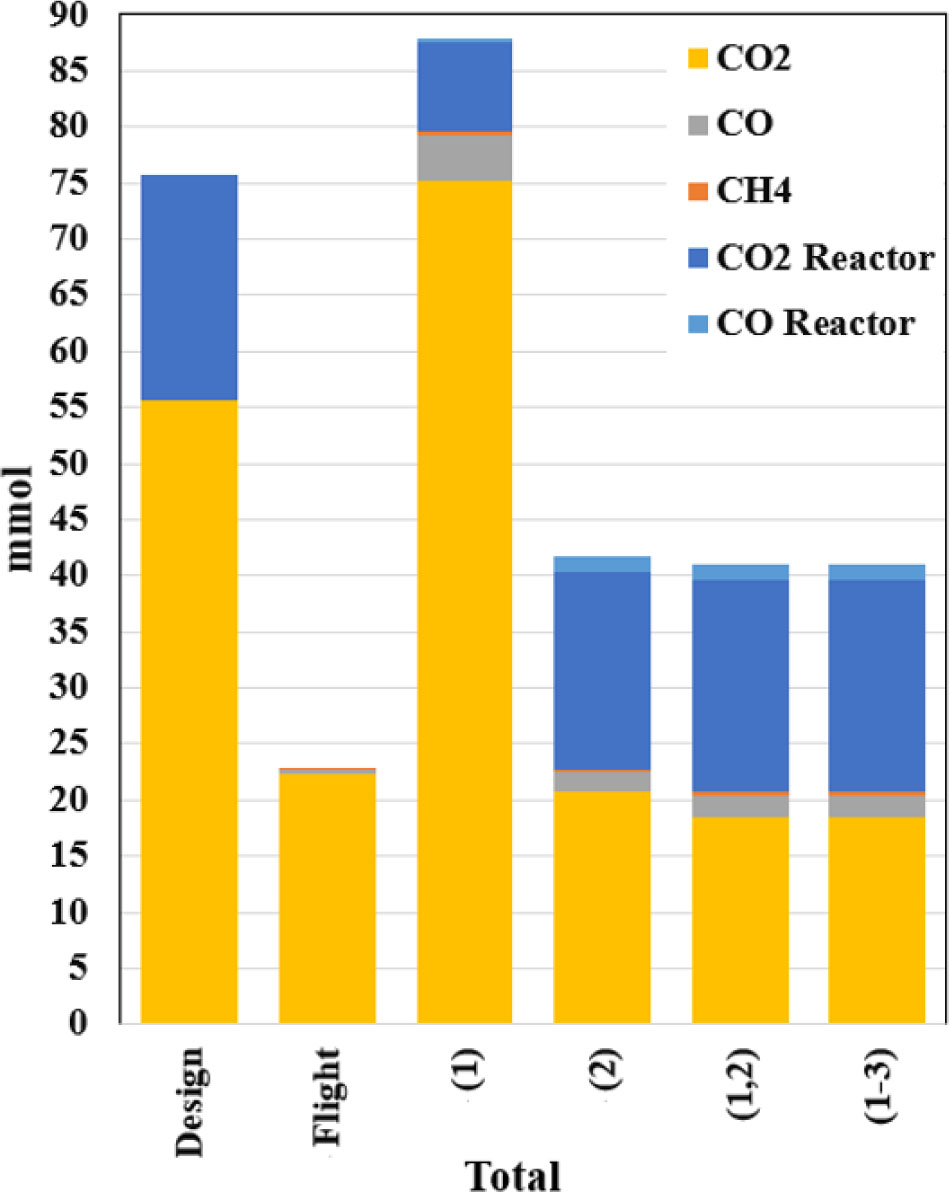
Figure 7
Total Syngas Production. Results from testing flight discrepancy conditions (1) Timing Discrepancy; (2) O2 Leak simulation (1,2) Timing discrepancy + O2 leak and (1–3) Timing discrepancy, O2 leak and air loading. Gases collected in the 3 collection tanks and smoldering tank are in yellow/orange; gases quantified in the lab from the reactor at the end of the burn are in blue.
Table 2
Gas production from tanks 1–3 and smoldering tank.
| Test descriptor | Syngas % of total | CO2 (mmol) | CO (mmol) | CH4 (mmol) | Syngas (mmol) |
|---|---|---|---|---|---|
| Flight (μg) | 16.5 | 21.80 | 0.45 | 0.01 | 22.25 |
| Lab – He (1,2) | 25.5 | 21.27 | 1.84 | 0.21 | 23.33 |
| Standard Dev. (Lab – He) | 2.1 | 3.44 | 0.43 | 0.08 | 3.83 |
| Difference with μg | 9 | 0.53 | 1.40 | 0.21 | 1.07 |
| Lab – Air (1,2) | 25.1 | 18.96 | 1.96 | 0.23 | 21.15 |
| Standard Dev. (Lab – Air) | 4.4 | 6.28 | 0.77 | 0.03 | 7.08 |
| Difference with μg | 8.5 | 3.32 | 1.51 | 0.22 | 1.60 |
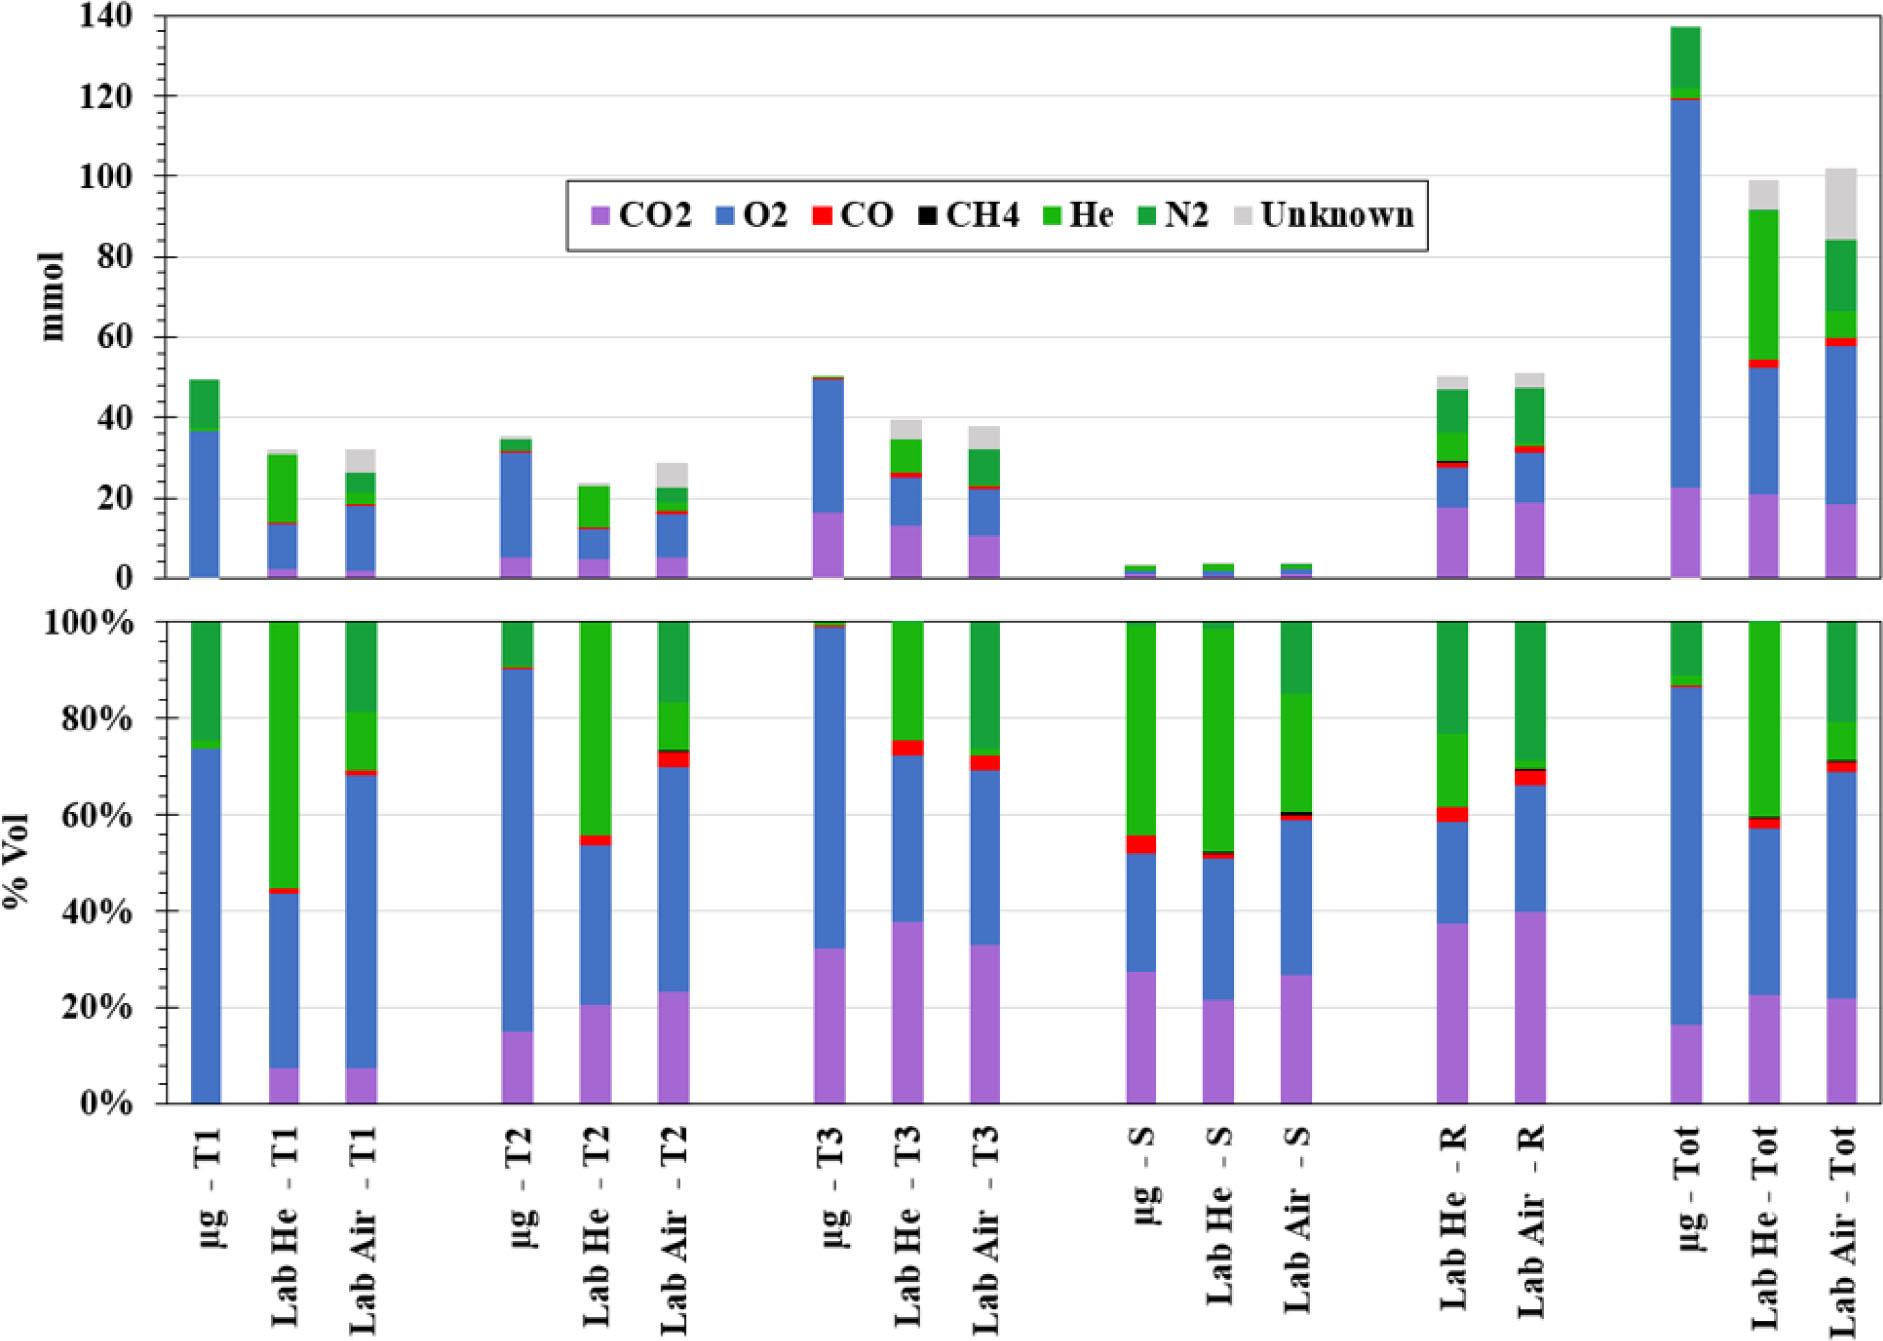
Figure 8
Top: Gas Production for Flight, Lab – He (1,2), and Lab – Air (1,2) experiments. From left to right: sequential tank collection (T1–T3); Smoldering tank (S); Reactor (R, Lab only); Total (Tot, excluding reactor contents for flight comparison). Bottom: Gas Composition for Flight, Lab – He (1,2), and Lab – Air (1,2) experiments.
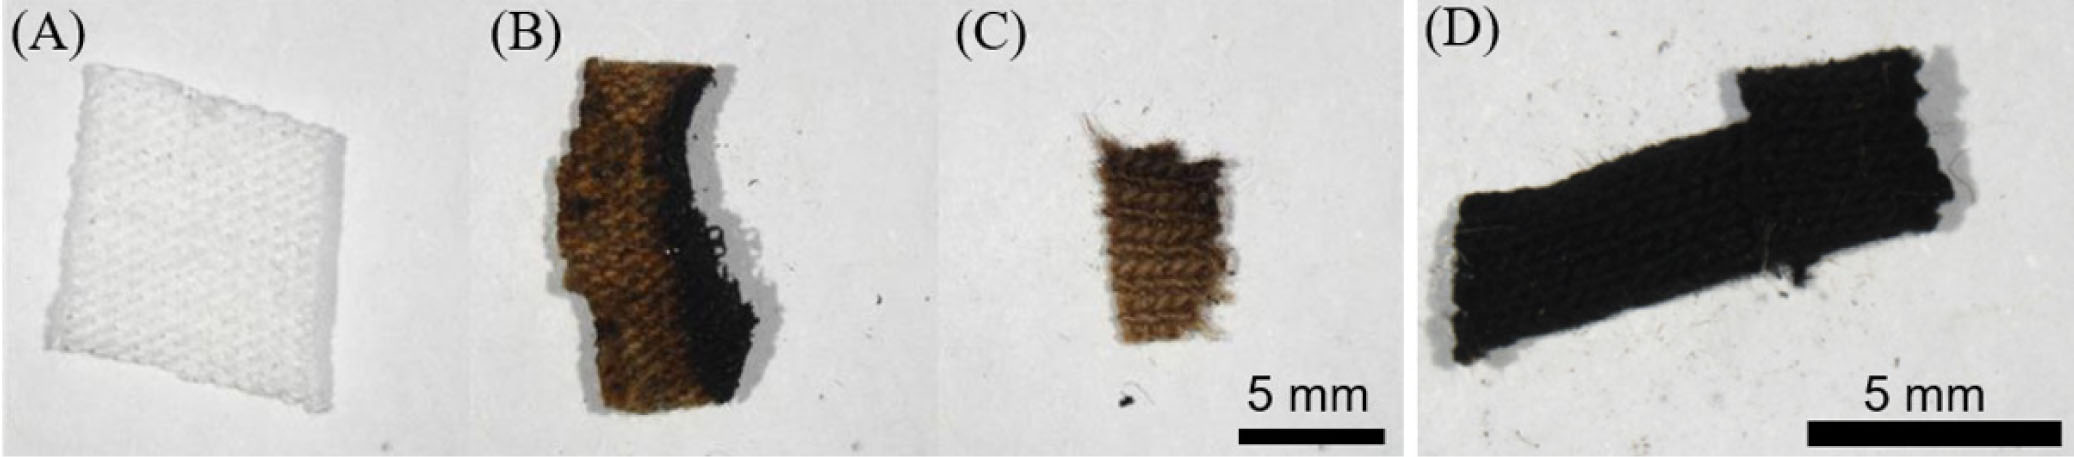
Figure 9
Optical microscopy images of representative t-shirt material. (A) Pristine t-shirt material before processing. (B) T-shirt material after reaction in a lab test. (C) T-shirt material after reaction in the μg flight test. (D) A completely blackened t-shirt sample from the μg (flight) test.
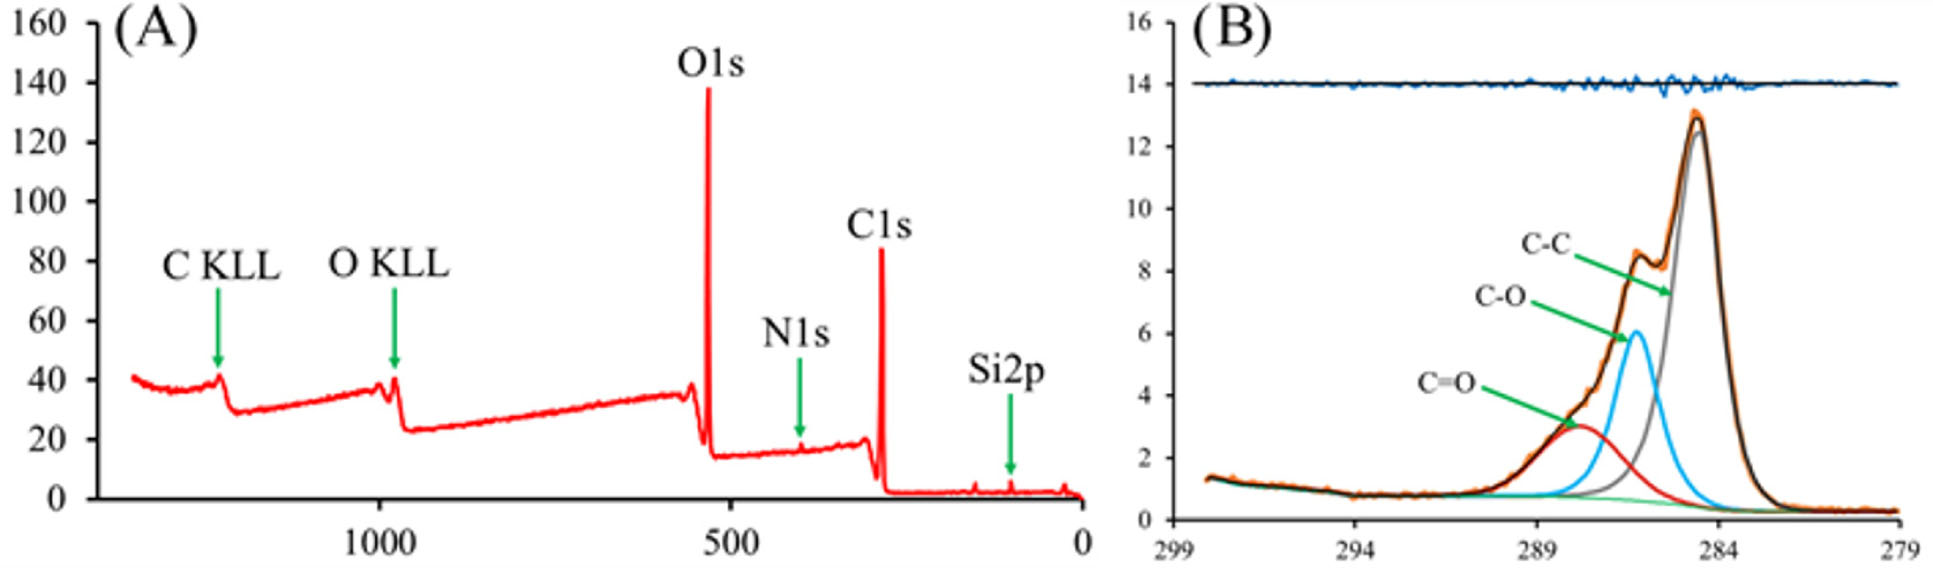
Figure 10
Example XPS spectra of combustion remnants. Y-axis (Counts x 1000), X-axis (Binding Energy, eV); (A) A survey spectrum of the Flight (light) sample. Corresponding elements are labeled for each peak. (B) A high-resolution spectrum of the Lab (light) sample.
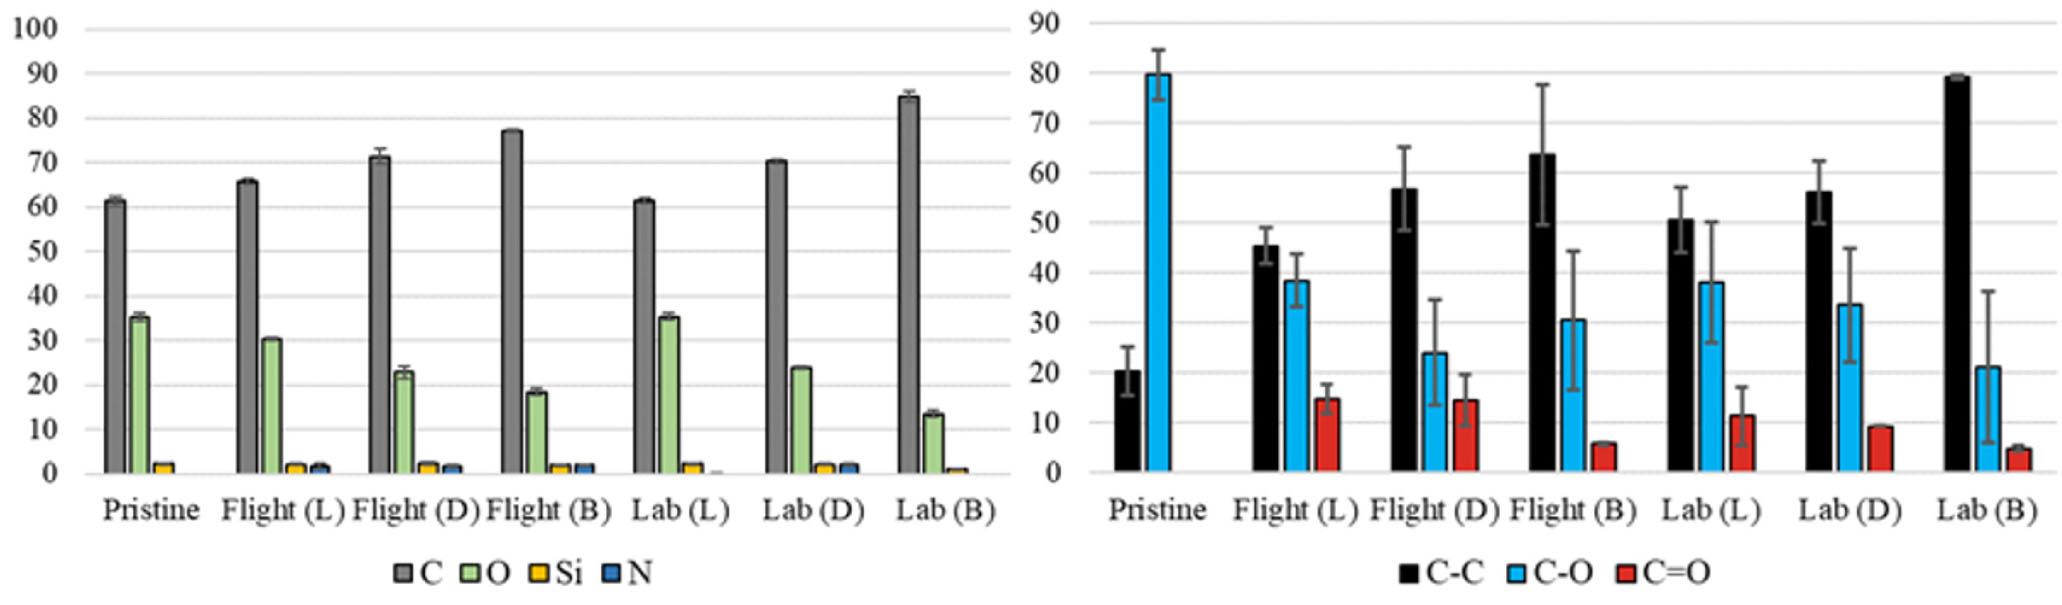
Figure 11
Sample Compositions. Here (L) = Light, (D) = Dark, and (B) = Blackened. Note that each (L) and (D) samples were collected from the same piece of remnant. (A) The elemental composition (at%) of the four ubiquitous elements (C, O, Si, N). (B) The composition (at%) of the different chemical types of carbon. All values were determined from an average of three sampling locations per sample. Error bars show the standard deviations of each average value.
Table 3
Product analysis from ZGF, suborbital flight, and ground testing associated with the suborbital flight.
| Test descriptor | Carbon conversion (with reactor) | Carbon conversion (no reactor) | Measured mass conversion | Max Temperature (°C) (TC1/TC2/TC3/TC4) | Ignition time (sec) | Pressure increase due to reaction (Δpsia) | CO2:CO* |
|---|---|---|---|---|---|---|---|
| ZGF HFWS-μg | 43.47% | N/A | 57.43% | 242.6 | 2.55 | 0.87 | 5.14 |
| Suborbital design point O2-Lab | N/A | N/A | 85.0% | 271.3/418.0/631.3/228.1 | 13.56 | 11.2 | N/A |
| Suborbital Flight-μg | N/A | 13.8% | 28.5% | 124.8/456.0/393.6/155.2 | 14.87 | 7.22 | 48.44 |
| Lab – He (1,2) | 27.5% | 14.9% | 43.6% | 154.77/279.8/561.4/203.9 | 14.38 | 9.02 | 11.56 |
| Lab – Air (1–3) | 30.2% | 15.2% | 46.3% | 189.1/322.2/678.0/260.6 | 18.68 | 11.21 | 9.67 |
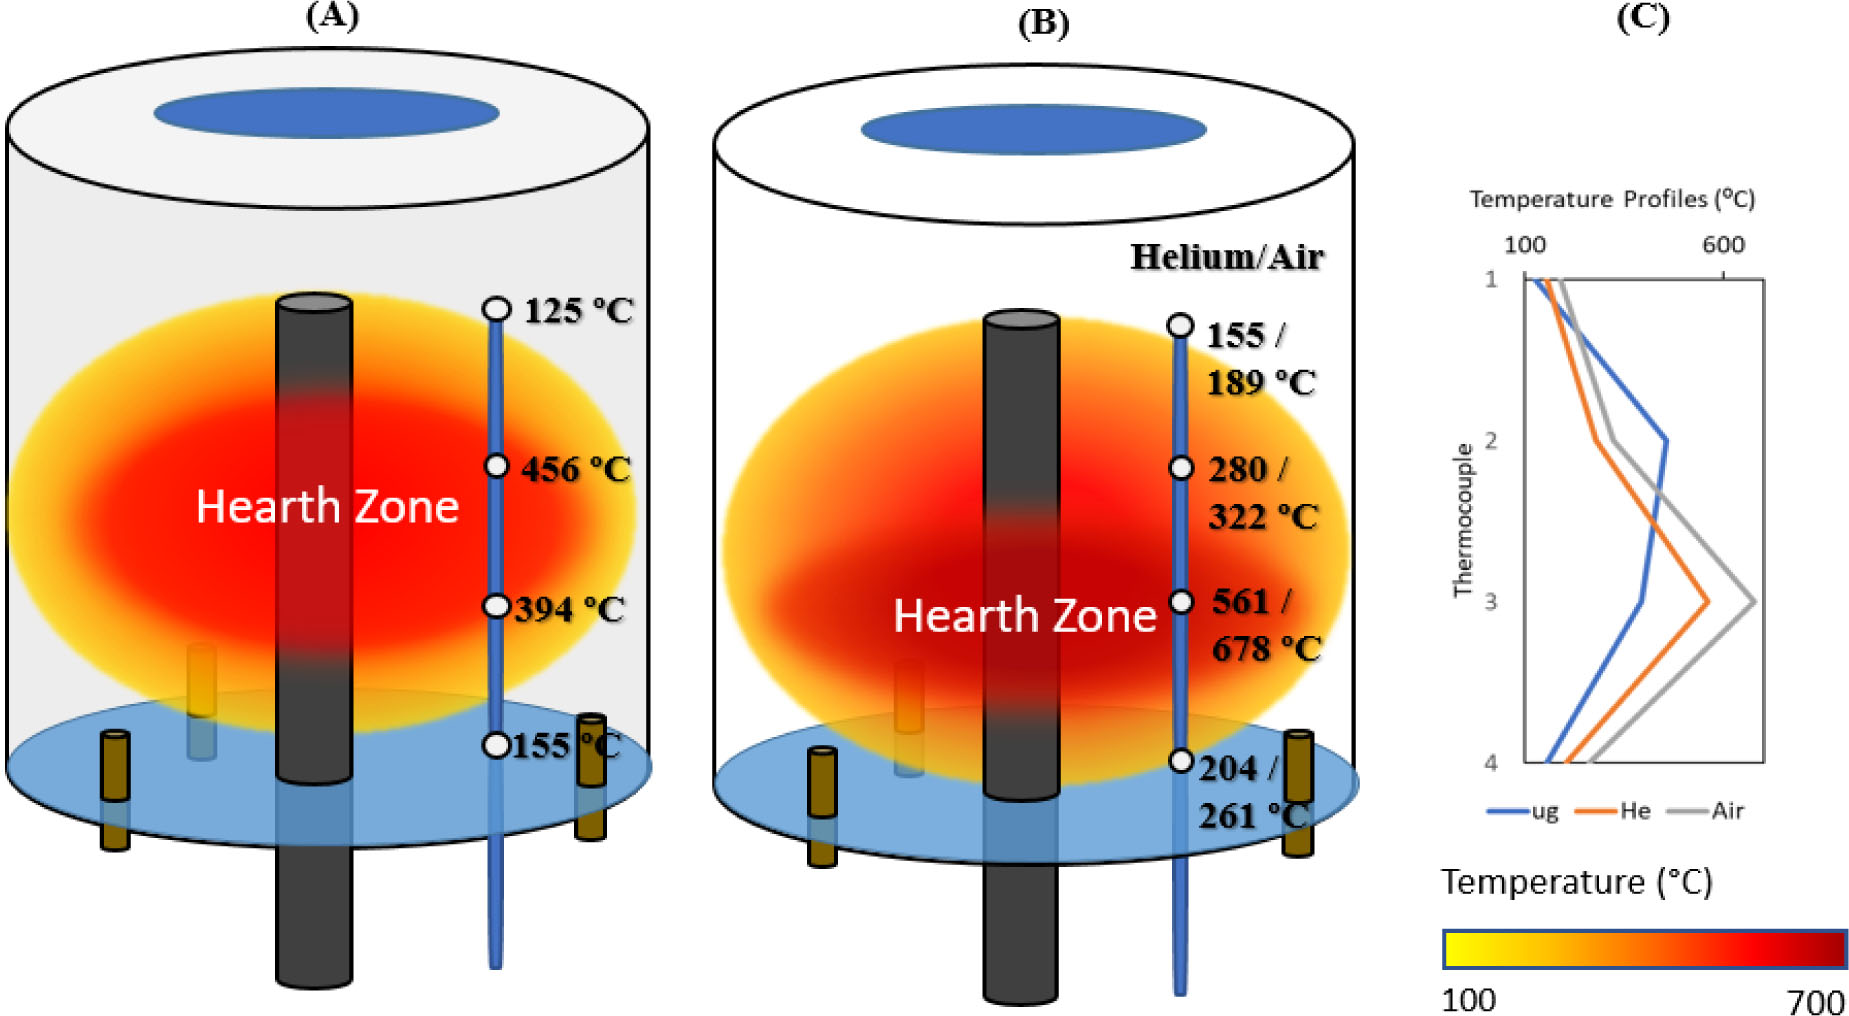
Figure 12
Thermal reaction zones (hearth zone) for (A) μg suborbital flight and (B) Earth gravity laboratory tests: Laboratory He (1,2), and Laboratory Air (1–3). The accompanying temperature profile is listed in (C). The reaction zone is expanded in μg and the reaction temperature is higher but smaller in Earth gravity.