
1. Introduction
Climatic fluctuations are recorded in the sequential formation of various sediments. In old-glacial zones, these are especially fluvial records which reflect changing dynamics of geomorphological processes. In numerous studies focusing on reconstruction of the history of sedimentary environments induced by large-scale climate changes, age determinations are made using the basic geochronometric methods: radiocarbon and luminescence. The latest increase in this type of data creates an opportunity to undertake statistical studies aimed at analysing whether it is possible to conclude on environmental changes in measurable time units about the area from which the data was collected. The results obtained in earlier studies confirm the validity of this type of approach for the fluvial environment (e.g. Michczyńska and Pazdur, 2004; Michczyńska et al., 2007; Gębica et al., 2015; Dzieduszyńska, 2019; Michczyńska et al., 2022). This type of research is facilitated by the fact that in most cases samples were taken from places where a significant change in the sedimentological record occurred. These are, for example, facies changes, the bottom and top of organic inserts or significant changes in pollen diagrams. It is assumed that these changes, in many cases, must have been a response to global climatic impulses, which, combined with a thorough understanding of the geological and geomorphological characteristics of the selected sites and the regional palaeogeographic development (e.g. Turkowska, 2006), can be applied in statistical analyses. The data we have suggest long-term periods with unchanging trends, reaching even several thousand years, which, given the current state of knowledge about the dynamics of environmental changes, seems unlikely (e.g. Huntley et al., 2003; Dzierżek and Szymanek, 2013; Helmens, 2014; Gębica et al., 2015; Marks et al., 2016). Vistulian evolution of an extraglacial fluvial environment in NW Europe also does not provide information concerning river reaction on small-scale climatic changes identified in the Greenland ice-core record (e.g. Vandenberghe, 1985; Van Huissteden, 1990; Mol, 1997; Vandenberghe, 2002; Kasse et al., 2003).
The aim of the article is to check, using the example of data from river valleys in the Łódź region (Central Poland), whether the shape of the probability density function curves (PDF) obtained on the basis of a set of radiocarbon and luminescence dates can reflect the development trends of river valleys. Based on combined geochronological data, the authors look for signals of climatic fluctuations which so far were problematic in identification in the fluvial environment. The analysis concerns the time section of the Vistulian between 50 cal kBP and 11.7 cal kBP, when serious climatic fluctuations occurred. Comparison with the Greenland ice-core record (Rasmussen et al., 2014), which is a palaeoclimatic model for the North Atlantic region, allows to see in the seemingly local impulse the reaction to global events.
2. Study Area: Location and Palaeogeographical Background
Sampling sites included in the database of the present study are located in the old-glacial zone of Central Poland, in the area named Łódź region (Fig. 1). It is lowland area with a little diversified relief, with a meridional zone of the highest altitudes exceeding 200 m above sea level. This area, covered mostly with glacial and glaciofluvial sediments, has been dissected by valleys of numerous, though mainly small rivers, which belong to the Vistula River or Odra River catchments. The possibility of a broad insight into the geological structure of all stages of the Quaternary in the Łódź region was provided from extensive excavations available in the brown-coal open-cast mines at Bełchatów and Adamów.
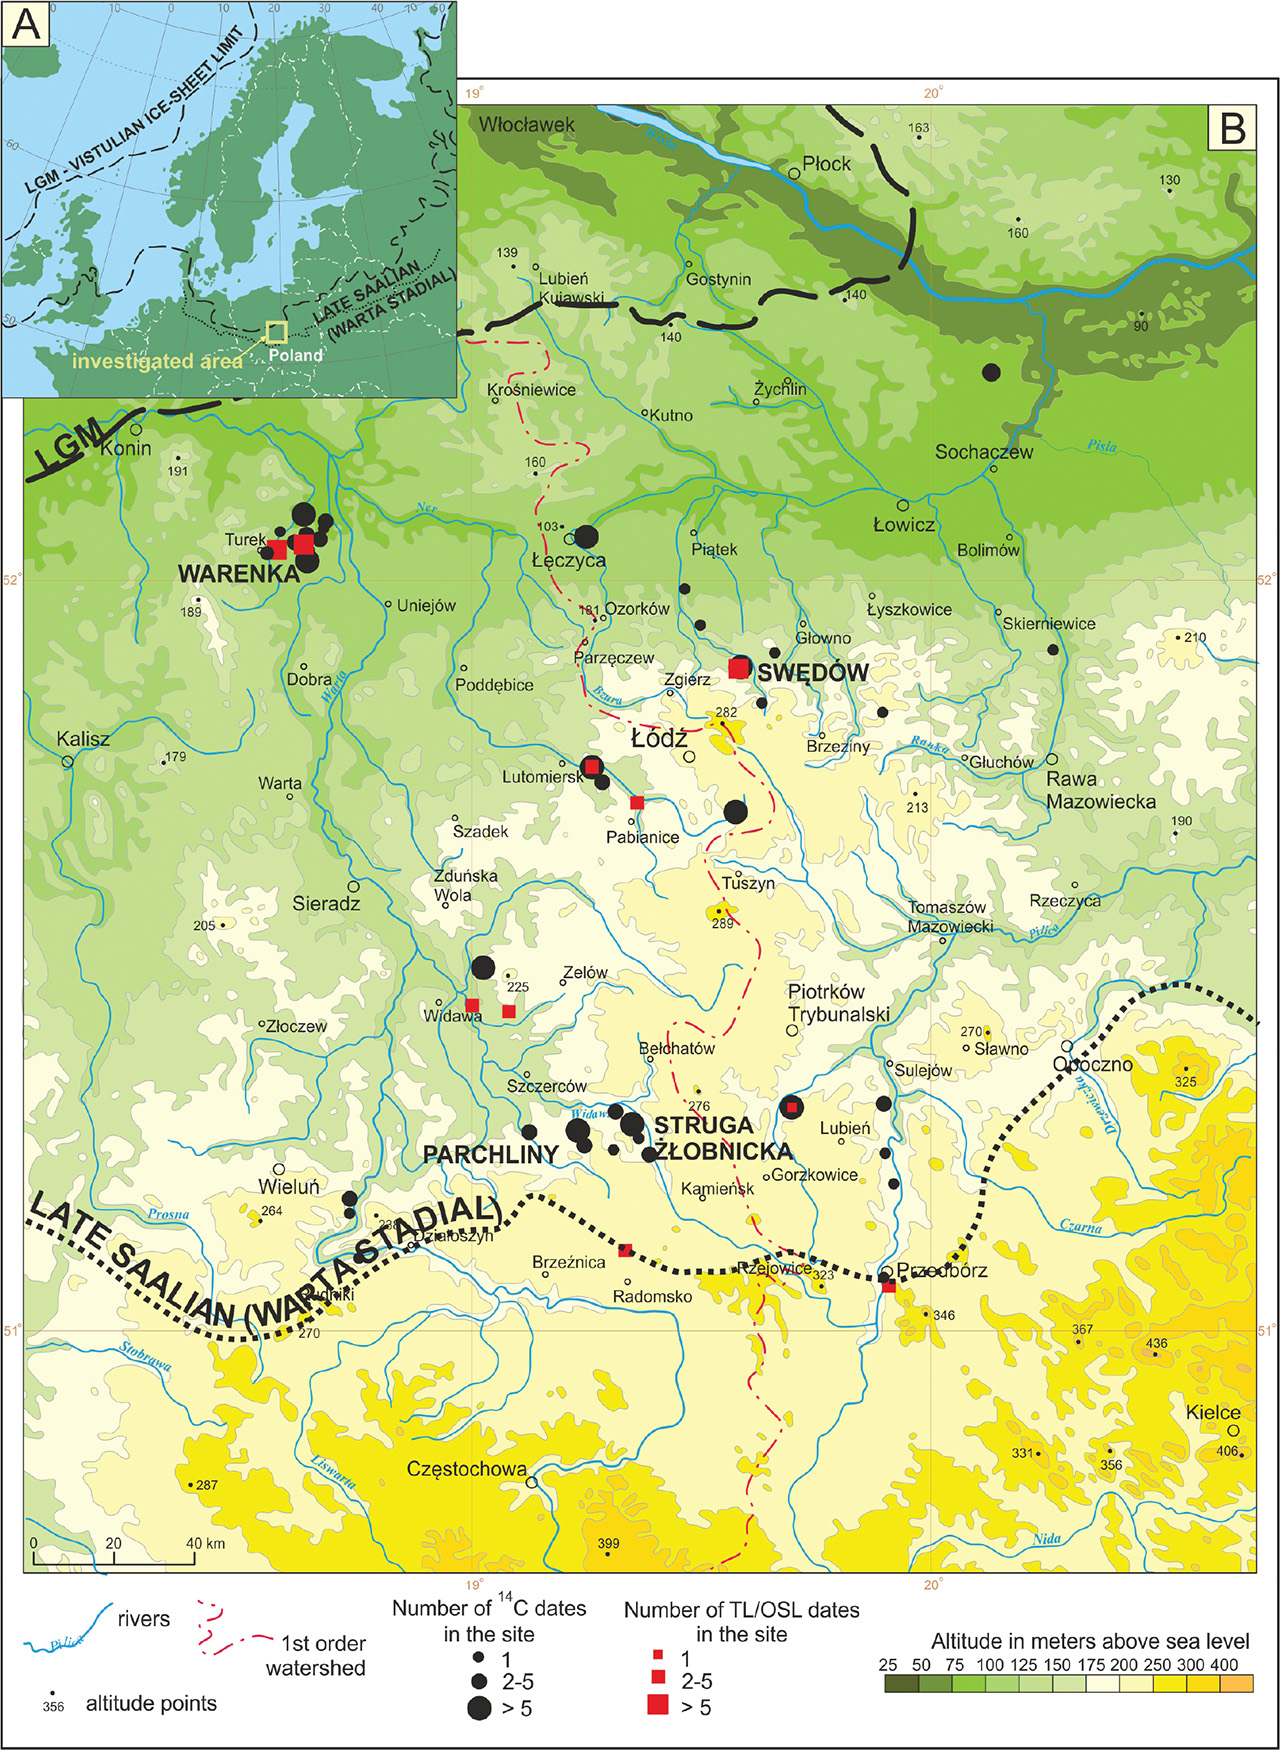
Fig 1.
Study area. (A) – against the selected ice-sheet limits (after Marks et al., 2018; Palacios et al., 2023). (B) – distribution of sites included in the dataset in the Łódź region.
The palaeogeographical evolution of the Łódź region generally followed the rhythm of global environmental changes. The most important stage in the formation of river valleys falls on the last glacial stage. The history of river valleys registered the main events included in the chronostratigraphic scheme covering the Early Vistulian, Plenivistulian and Late Vistulian. Middle and Upper Plenivistulian and Late Vistulian periods are considered in the article. The chronostratigraphic scheme applied is originally derived from the vegetation change cycle for NW Europe introduced by van der Hammen et al. (1967) and then successively regionally developed by various researchers (the latest approach by Marks et al. (2016). The Middle Plenivistulian (approx. 58–29 cal kBP; see Lisiecki and Raymo, 2005) was characterised by relatively well-defined warm and cold phases and the Upper Plenivistulian (29–15 cal kBP) by a cold maximum during the last glacial maximum (LGM). In the Late Vistulian (15–11.7 cal kBP) a non-linear warming trend occurred.
In the Middle Plenivistulian, river erosion initially dominated in the valleys of the Łódź region, to give way to accumulation over time. Sedimentary succession begins with fine-grained sand with thick silt and/or sand with interbedding of organic sediments. The Upper Plenivistulian cooling brought about a fundamental change in the sedimentation style expressed by the deposition of sandy sediments in the high-energy environment of a braided river system. Such succession is revealed in the geological structure of high terrace levels, which emerged morphologically due to the result of erosion at the end of the Upper Plenivistulian. The subsequent relative stabilisation in the functioning of river valleys frequently led to a shift in the channel pattern into meandering with large meanders. Palaeochannels were cut off and filled with biogenic deposits, as well as formation of valley peatbogs or extensive basins on flood-plains were established. At the end of the Late Vistulian, there was an intensification of fluvial processes, expressed by increased floods and covering of floodplains with mineral deposits which form the surfaces of low terraces morphologically emerged in a later period (see Dzieduszyńska et al., 2020).
3. Material and Methods
The results of radiocarbon and luminescence age determinations of fluvial sedimentary environment formed between 50 cal kBP and 11.7 cal kBP were collected (see Supplementary). Examples of four sites (Struga Żłobnicka, Parchliny, Warenka and Swędów) where detailed sedimentological studies were carried out are provided (Fig. 1). However, in no case a complete profile from this period has been found. Although the times-pan of interest of the present article covers the interval 50–11.7 cal kBP, thus from the calibration curve extent to the Holocene beginning, dates from the beginning of the Holocene were also added to the set of ages to obtain a methodically correct image of the end of Vistulian. The dating results included in the database come from: (1) numerous publications by various researchers, (2) research by the authors of this publication and (3) unpublished results provided as a courtesy. The reliability of the dates included in the database is confirmed by geological, geomorphological, palynological or paleozoological data, keeping in mind all limitations which result from complexity of environment and principles of the used methods of dating. The authors of the works from whom we have taken the data (see Supplementary) had no doubts about the stratigraphic position of the examined sediment and the dating results. This database also includes dates that come from the latest, not yet published research by the authors of this article, but also with stratigraphic position that does not raise any doubts. Currently, it is a complete set for the analysed area, containing 181 results of age determinations using the radiocarbon method and 38 results of age determinations using the luminescence method.
The present study used these age determinations which have been positively verified in terms of the certainty of assigning them to the tested fluvial environment. Dates assigned to the fluvial environment carry information about the processes taking place there. This means that lithology was not always a key determinant. The results of radiocarbon dating of sediments of the overbank facies such as palaeochannels’ infillings, sediments of decantation basins, hydrogenic soils, sediments of valley peatlands and lumps of organic or organic-mineral material deposited in mineral alluvium were considered, provided that their formation was found to be in a direct connection with fluvial environment. The results of luminescence dating come primarily from mineral deposits of the overbank facies.
Statistical studies consisted in the construction of curves of the PDF. PDF curves were created using OxCal programme (Bronk Ramsey, 2009, 2017). For radiocarbon dates, the latest IntCal20 calibration curve (Reimer et al., 2020) was used. The PDF curves show grouping of dates in several time ranges, corresponding to overregional trends of environmental changes. It was assumed that changes in the environment will be expressed in PDF peaks. A local signal specific to only one site is smoothed, while a regional or global signal is amplified. The main step is to see if the summed frequency distributions of dates can be used to demonstrate the response of fluvial sedimentary environment to large-scale events and to investigate whether this response was synchronous. The resulting curves were compared with the oxygen curve from the NGRIP core and INTIMATE stratigraphy (Rasmussen et al., 2014).
The accuracy of the reconstruction depends on the precision of the dates used for the analyses. The highest resolution can be obtained using radiocarbon dates obtained with the AMS technique. However, for the study area, such age determinations represent a small percentage of the collected database. Another group consists of 14C dating results obtained using conventional techniques (GPC or LSC). Although they have higher uncertainties compared to AMS dates, they originate from well-recognised palaeo-geographical background and date events recorded in the fluvial environment of the Łódź region. It can be expected that, in their collective analysis, the peaks of the probability density distributions will have a greater width, but there is no basis to question their usefulness in the conducted analysis. It should be noted here that, based on the statistical foundations of the dating method, the uncertainties of dates increase with the age of the sample. Therefore, with age, the peaks of the PDF curves will become lower and wider.
Despite high uncertainties of luminescence dates, the authors decided to include them in the database as well, because they are a valuable supplement to the picture obtained on the basis of organic material. Luminescence dates, like radiocarbon dates, come from the last several decades of research in the region. Most of them were made using the optically stimulated luminescence (OSL) technique at the Gliwice Luminescence Laboratory. Increased activity of the fluvial environment associated with the aggradation of mineral alluvium happened in cold periods, hence the correlation with the Greenland stadials (GS) is expected. In turn, stabilisation of river beds and sedimentation of organic material is generally favoured by warmer conditions. Thus, radiocarbon dates are expected to be primarily correlated with Greenland interstadials (GI). However, since the study area belongs to an extraglacial zone, it is not surprising that some of the dated organic material may be related to GS.
4. Results
4.1. Alluvial Depositional Succession in the Selected Profiles
Sites Struga Żłobnicka and Parchliny are located in the Widawka catchment, right tributary of the Warta River (Fig. 1B). The area is situated within the active subsidence zone of the Kleszczów Graben, thus the depositional succession is well preserved. Geological data were gathered from the walls exposed along Bełchatów excavation (Struga Żłobnicka) and Szczerców excavation (Parchliny) of the Bełchatów Lignite Open Cast Mine. Vistulian deposits are represented by the local, the Piaski Formation, which a few sedimentary members (e-a) consisting mainly of sands and silts (Baraniecka, 1980; Hałuszczak, 1982; Krzyszkowski, 1990, 1991, 1992; Goździk and Zieliński, 1996; Manikowska, 1996; Kasse et al., 1998; Krzyszkowski, 1998).
In Struga Żłobnicka locality (Figs. 1B and 2) fluvial deposits of the Piaski Formation are underlain by lacustrine deposits (member e). River alluvium (member d) starts with erosional pavement and forms thick horizon of silty-sandy deposits with organic interlayers which originated in meandering river system. Alternation of sand and silt lithofacies associations is a characteristic feature. The lithofacies associations of different thickness reveal erosional contact. Channel facies is dominated by sand while over-bank facies consists of sandy-silt and silt. The bottom part of the member was radiocarbon dated at 23.6 ± 0.4 kBP (Gd-5484; 68.3% prob. 28.18–27.35 cal kBP). The dated material is organic layer probably from decantation basin. Transition between members d and c is of depositional nature, indicating the tendency to aggradation, likely in multichannel river environment. Member c consists of sand and silty-sand. Termination of this member sedimentation occurred at 21.97 ± 0.81 kBP (Gd-777; 68.3% prob. 27.23–25.60 cal kBP) as indicated from radiocarbon dated peat sample. Member b includes sand deposited primarily in high-energy environment of braided river, and then in a less dynamic regime. The bottom part of this member was radiocarbon dated at 20.17 ± 0.25 kBP (Lod-737; 68.3% prob. 24.54–23.90 cal kBP) while the top part of the member was dated at 12.44 ± 0.18 kBP (Gd-2640; 95.4% prob. 14.96–14.26 cal kBP); both dates are ascribed to silty organic layers. The whole profile of alluvia is topped with sand of member a, representing fluvioaeolian sediments typical of the Late Vistulian, in which there are also peat interbeddings radiocarbon dated to 10.16 ± 0.14 kBP (Gd-2189; 68.3% prob. 12.04–11.40 cal kBP) and 11.17 ± 0.11 kBP (Gd-1707; 68.3% prob. 13.17–12.93 cal kBP).
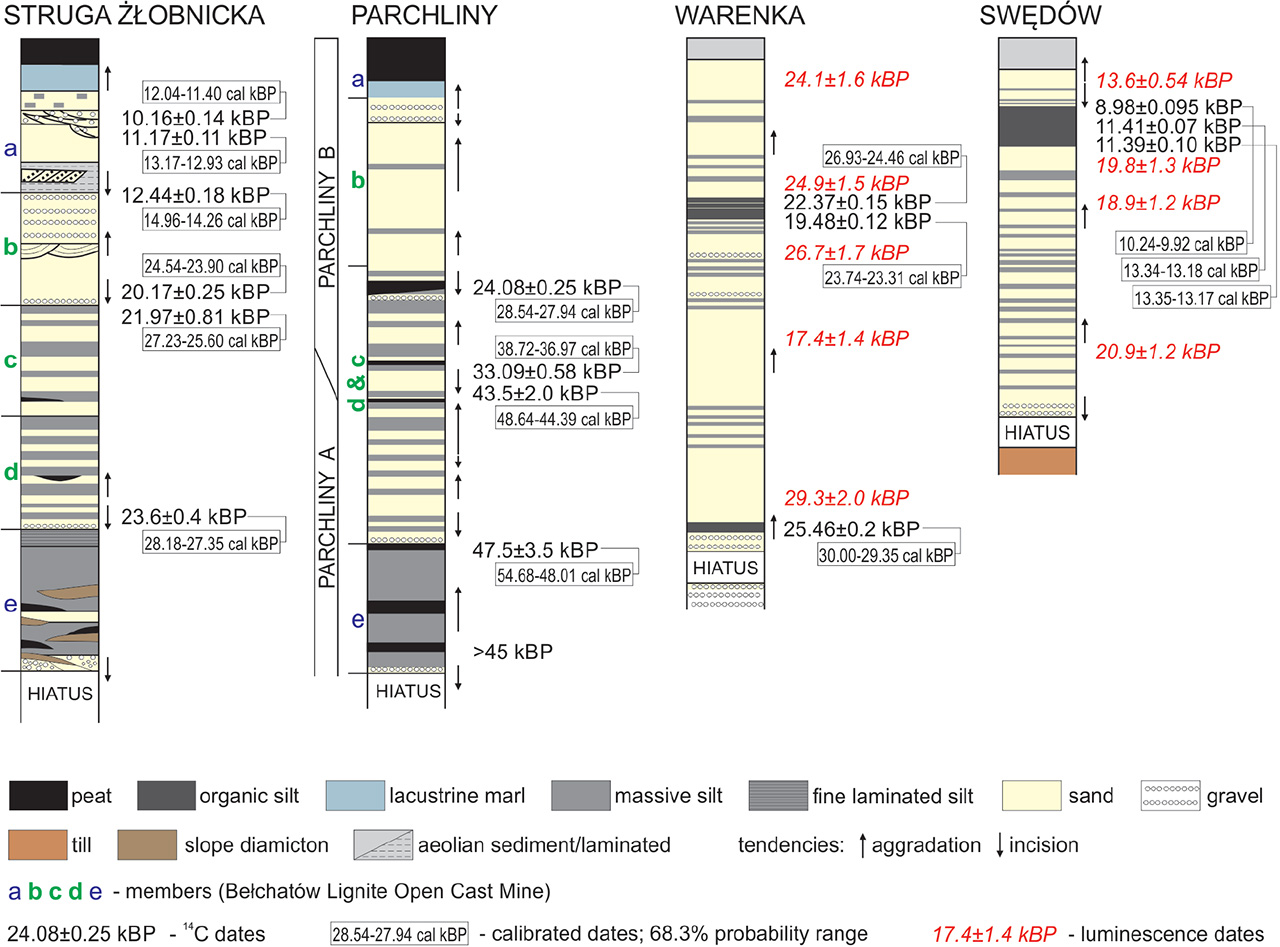
Fig 2.
Synthetic lithological profiles.
In Parchliny locality (Fig. 1B), fluvial deposits (d–b members) are of the thickness of several metres. They lie above the erosional surface separating the Vistulian deposits from the older ones (Wachecka-Kotkowska et al., 2018). Sand and silty-sand series of the Piaski Formation fill the pra-Krasówka valley which used subglacial channel there (Wieczorek and Stoiński, 2019) and melt-out depressions (Majecka et al., 2022).
The oldest deposits were recognised in Parchliny A profile (Fig. 2), at a depth of ca. 14.9 m, where among silts and sandy silts with an organic admixture (e member), formed on the floodplain or in a water reservoir, and these organic deposits were radiocarbon dated in the bottom at >45 kBP (GdC-476; >47 cal kBP). In the top of organic silt series, at a depth of 14.2 m, a radiocarbon date of 47.5 ± 3.5 kBP (GdS-1127; 68.3% prob. 54.7–48 cal kBP) was obtained. Mineral-organic deposits overlie gravelly boulder pavement, indicating a strong erosion phase before their deposition. Above the gravels, there is a sandy-silty and silty-sandy series (member d) of ca. 8.5 m thick, which on the basis of lithofacies, can be interpreted as formed in the channel zone, at low water levels, and in the overbank zone (Wachecka-Kotkowska et al., 2014). In the upper part of the Piaski Formation at a depth of 5 m below the present-day surface, organic material within very-fine grained sand series was radiocarbon dated to 43.5 ± 2.0 kBP (GdS-1128; 68.3% prob. 48.65–44.35 cal kBP).
In the nearby Parchliny B profile (Fig. 2), above the erosional surface, in sandy-silt sediments with organic admixtures (c member), within the bottom of sandy-muddy sediments, at a depth of 13.6 m a radiocarbon date of 33.09 ± 0.58 kBP (GdS-1366; 68.3% prob. 38.75–36.95 cal kBP) was obtained. About 1.3 m higher (12.3 m deep), at the top of sandy silt deposits, organic remains found in situ were radiocarbon dated at 24.08 ± 0.25 kBP (GdS-1371; 68.3% prob. 28.55–27.9 cal kBP). Though the Intensity of erosion decreased, the erosional base was relatively stable.
Ca. 28–27 kBP an increased aggradation of sand and subordinately of silt with sand (member b) occurred in the pra-Krasówka valley. A thicker series even over 12 m was formed, with aeolian processes from the end of the Vistulian involved (Wachecka-Kotkowska et al., 2014). At the end of the Plenivistulian, as a result of aeolian (deflation) and fluvial processes (member a), a depression in the top of sandy series discussed above was formed and filled with peat (Forysiak, 2012).
Site Warenka (Fig. 1B) is located in the Warta River valley, in the section of the tectonic Adamów Graben. Tectonic conditions favoured sedimentation and preservation of thick series of deposits, including the Vistulian ones. Sedimentary studies were carried out in excavations of Adamów Lignite Open Cast Mine. Vistulian fluvial deposits, usually to 20 m thick, rest on glacial till or glaciofluvial sand and gravel. They form there Plenivistulian high terrace of the Warta River. Alluvia are dominated by sand of various fraction; the presence of mineral-organic interlayers in superposition (Fig. 2) is their characteristic feature. The top of the lower mineral-organic interlayer was radiocarbon dated at 25.46 ± 0.20 kBP (GdA-6447; 68.3% prob. 30.00–29.35 cal kBP). Then there is a series of sand of about 10 m, mainly medium-grained, which were dated by OSL technique. The following results were obtained: 29.3 ± 2.0 kBP (GdTL-3532), 17.4 ± 1.4 kBP (GdTL-3440) – however this result differs from the others and is too young – and 26.7 ± 1.7 kBP (GdTL-3531). Above, there is a change in depositional style – sandy silt interbeds and organic mud appear. Radiocarbon dating of organic mud gave results: 19.48 ± 0.12 kBP (GdA-6446; 68.3% prob. 23.73–23.31 cal kBP) and 22.37 ± 0.15 kBP (GdA-6445; 68.3% prob. 26.93–26.46 cal kBP). The last member of the studied succession is medium-grained sand OSL dated at 24.9 ± 1.5 kBP (GdTL-3530) and 24.1 ± 1.6 kBP (GdTL-3529). Thick sandy series registered in the Warenka profile were deposited in a system of a shallow sand-bed braided river.
Site Swędów is located in the Moszczenica River valley (Figs. 1B and 2). It is a small river, which in some sections has developed a valley clearly cut into the plateau, with well-defined morphological elements. The slope of the valley is gentle but clearly pronounced. The higher terrace of Plenivistulian age is elevated above the valley floor for ca. 5 m and is undercut by the currently functioning riverbed and in places forms steep walls. The lower terrace of Late Vistulian age is slightly ca. 1 m elevated above the narrow valley floor. Vistulian alluvium is underlain by glacial till, which is covered with a gravel-sandy layer of erosional pavement. Above, there is a series of sand of several metres, mainly medium-grained, with silt interbedding, with more mud interbedding in the lower part of the profile. Sandy-silty series was deposited in the overbark facies. Three age determinations were obtained using OSL method from the described series: 20.9 ± 1.2 kBP (GdTL-3141), 19.8 ± 1.3 kBP (GdTL-3137) and 18.9 ± 1.2 kBP (GdTL-3140) (Fig. 2). In the next stage of the valley development, deep erosion occurred, which led to the morphological separation of a high terrace. Sedimentary record finishes with Late Vistulian record and is represented by silt, fine-grained sand and then mineral-organic mud, which also developed in the overbank facies in the distal part of the floodplain. Mineral-organic series was radiocarbon dated at: 11.39 ± 0.10 kBP (GdS-3963; 68.3% prob. 13.35–13.16 cal kBP), 11.410 ± 0.065 kBP (GdS-3970; 68.3% prob. 13.34–13.18 cal kBP) and 8.980 ± 0.095 kBP (GdS-3983; 68.3% prob. 10.24–9.91 cal kBP); the last of the results was too young, verified by pollen analysis (Petera-Zganiacz et al., 2019). The top of these sediments has been washed-out. The sequence of fluvial sediments ends with a series of sands with silt interbedding OSL dated at 13.60 ± 0.54 kBP (GdTL-3142).
4.2. Results of the Analysis of Luminescence and Radiocarbon Dates Distributions
The probability distributions of luminescence and radiocarbon dates against the oxygen curve from the NGRIP core and the INTIMATE stratigraphy (Rasmussen et al., 2014) are presented in Figs. 3 and 4, respectively. It was decided to present the results in two separate time intervals due to the dominant share of radiocarbon dates >15.0 cal kBP: in the range <15.0 cal kBP and >15.0 cal kBP. In order to be able to compare the distribution of luminescence and radiocarbon dates, a common time scale described as ‘cal BP’ was used, which in the case of luminescence dates should be understood as calendar years before AD (Anno Domini) 1950, and in the case of radiocarbon dates as calibrated years before AD 1950. In each of the figures (Figs. 3A,B and 4A,B) the dates were presented as a 68.3% probability range (horizontal bars with the medians (dots) for luminescence dates). In addition, Figs. 3C, 4c.1 and 4c.2 show the results of the calibration of subgroups of 14C dates, which are well correlated with periods of interstadials or boundaries resulting from the INTIMATE stratigraphy (marked in Figs. 3D and 4D).
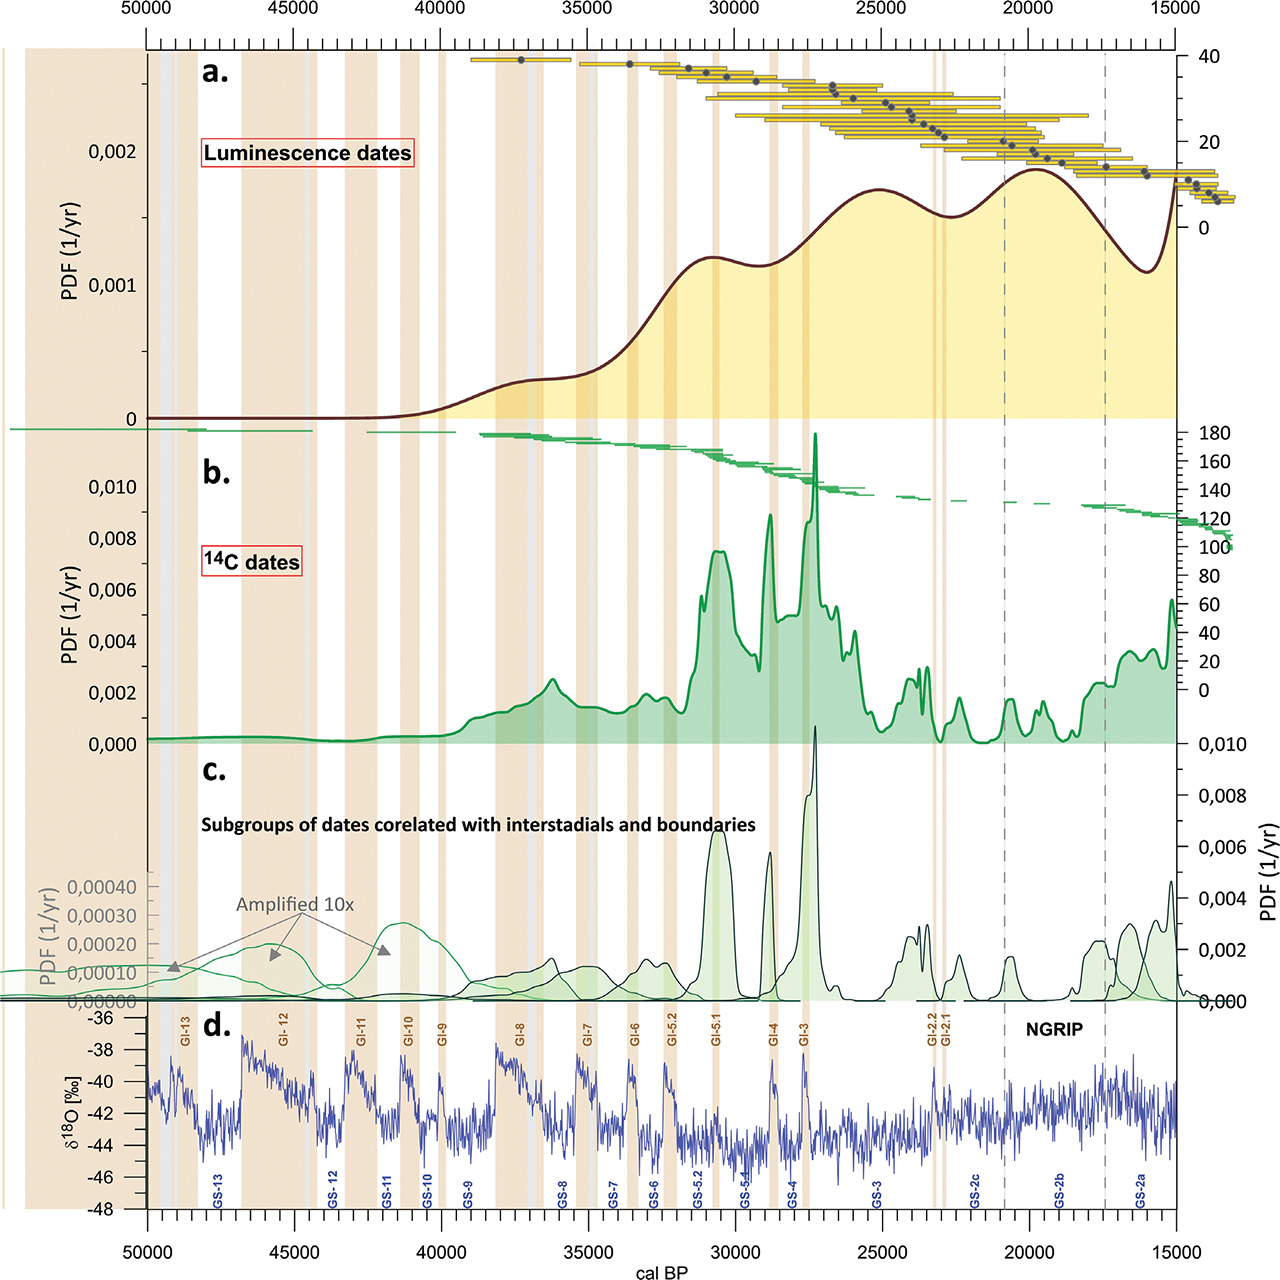
Fig 3.
Curves of PDF for 50–15 cal kBP: (A) – PDF for luminescence dates; in the upper part 68.3% probability ranges for each date are presented in the form of horizontally bars with dots representing medians. (B) – PDF for radiocarbon dates; in the upper part 68.3% probability ranges for each date are presented in the form of horizontally bars. (C) – PDFs for subgroups of radiocarbon dates correlated with interstadials and boundaries. The PDF distribution presented in (B). has been divided into distributions for date subgroups. The oldest three dates have large uncertainties and, when presented on the same vertical scale, are almost imperceptible. Therefore, their distributions have been added with an enlarged height of 10× to make it easier to assess where their maxima fall (peaks with green envelope, no fill) (D) – δ18O data from Greenland ice core (Rasmussen et al., 2014) with marked stadials (GS) and interstadials (GI). GI, Greenland interstadials; GS, Greenland stadials; PDF, probability density function.
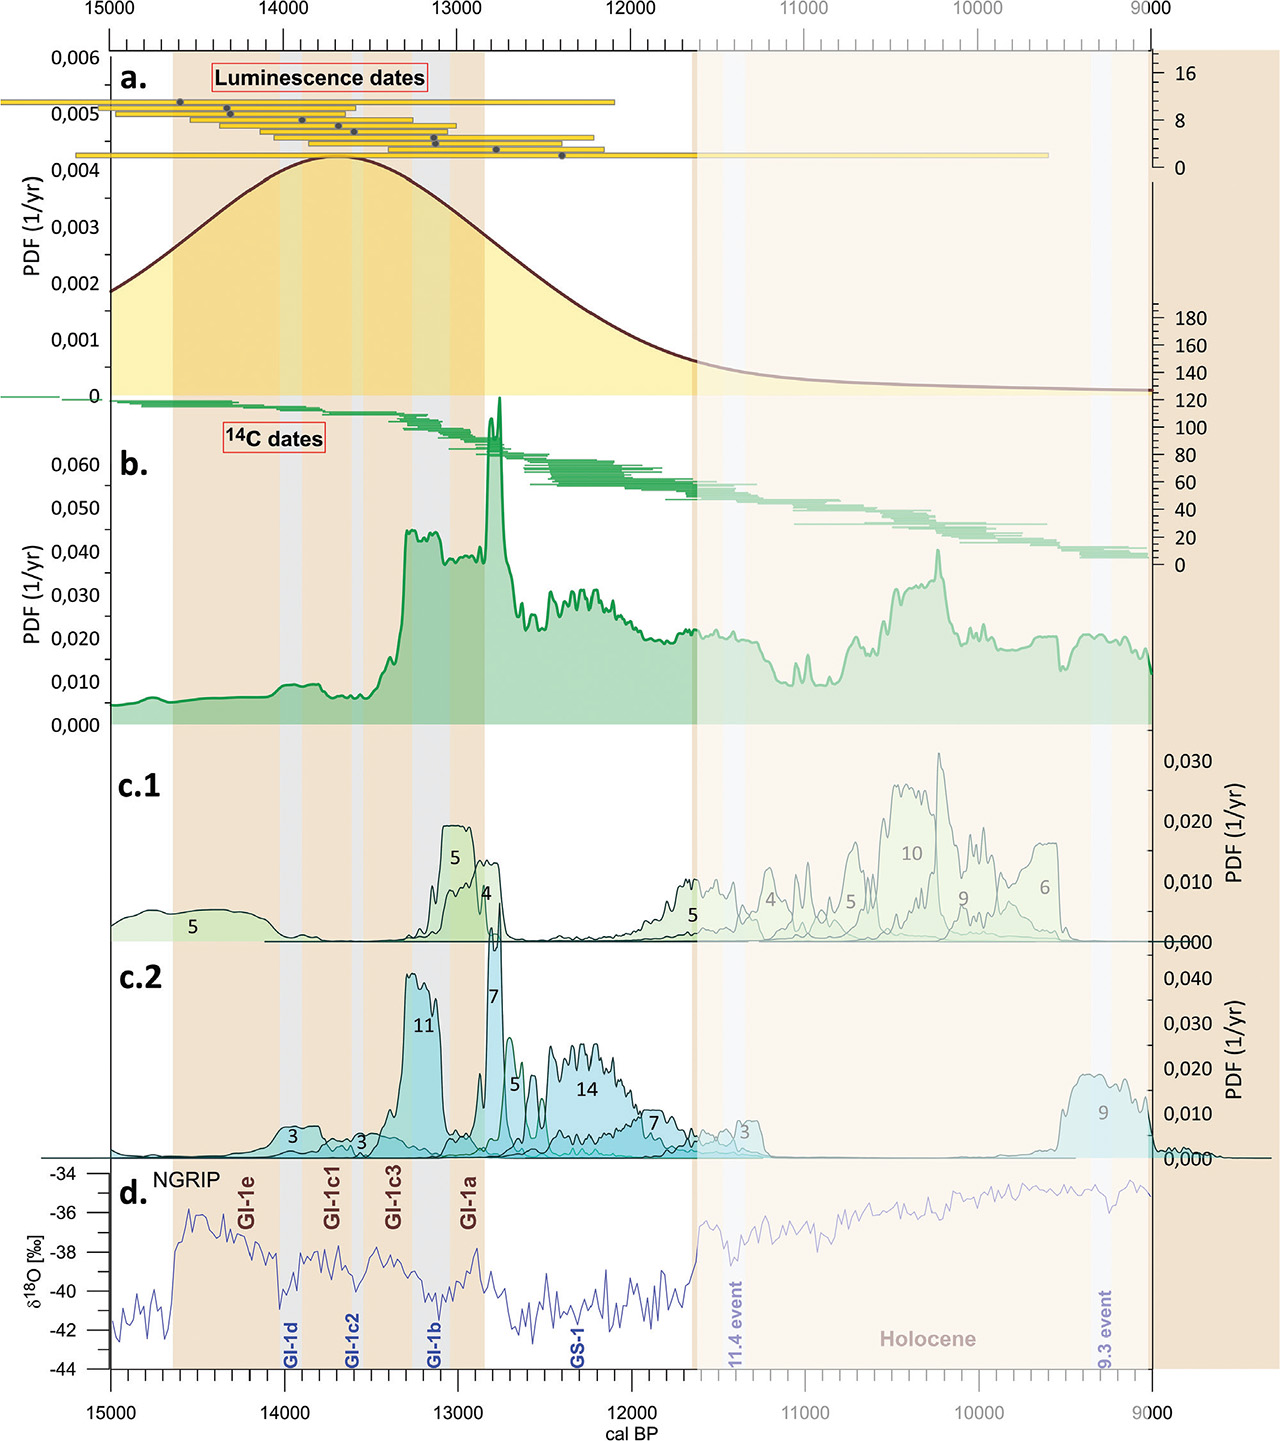
Fig 4.
Curves of PDF for 15–9 cal kBP. Explanations to graphs (A–D) – the same as for Fig. 3. Distributions for date subgroups were divided into parts c.1 and c.2. Within each distribution, the number of dates constituting it is given. Figure c.1 shows the distributions for subgroups of dates correlated with warming: starting from the oldest ages, 5 dates form the peak for the GS-2a/GI-1e transition, 5 for the GI-1b/GI-1a transition, 4 for the GI-1a warming, and 5 for GS-1/Holocene transition. GI, Greenland interstadials; GS, Greenland stadials; PDF, probability density function. Figure c.2 shows the distributions for subgroups of dates related to cooling: starting from the oldest ages, 3 dates form a peak correlated with GI-1d, 3 with GI-1c2, 11 with GI-1b, 7 with the GI-1a/GS-1 transition. Within GS-1, there are also peaks created by 5, 14 and 7 dates. Shaded area comprises dates from the beginning of the Holocene added in order to obtain a methodically correct image of the end of Vistulian.
4.2.1. Probability distributions of luminescence dates
Although the collected set of luminescence dates is not very extensive (comprising only 38 dates), a dominant characteristic emerges, i.e. the majority of luminescence dates is in the time range of 27–15 cal kBP. The overall probability distribution of luminescence dates encompasses five peaks. The peak at approx. 37 cal kBP is derived from a single date. The next peak with a maximum around 32–30 cal kBP is based on three dates and corresponds to GS-5.2–GS-5.1 (see Fig. 3D). Two distinct clusters of luminescence dates are evident in GS-3 and GS-2b, comprising 14 and 7 dates, respectively. The youngest peak at around 13.5 cal kBP is formed by 10 dates (see Fig. 4A). These dates exhibit large uncertainties and, therefore, collectively form a single peak. However, their stratigraphic position in the deposits indicates that they should be associated with specific cooling periods within GI-1 and GS-1.
4.2.2. Probability distributions of radiocarbon dates
The analysis of the shape of the PDF curve for radiocarbon dates allows us to make the following observations:
– The oldest 14C dates come from the Parchliny site (GdS-1127; 47.5±3.5 kBP and GdS-1128; 43.5±2.0 kBP). Despite the large uncertainties and overlapping calibrated date distributions, additional information from the exposure suggests that the dated material spans 10 m of sediment, allowing these dates to be attributed to GI-13 and GI-12, respectively.
– Another date, 36.31 ± 1.86 kBP (Lod-881) from the Warta River valley in Koźmin site located near Warenka site, has a wide probability distribution after calibration. Although the peak aligns with GI-10 (see Fig. 3C), it is uncertain which of the GI-11–GI-9 interstadials it should be associated with.
– Interstadial GI-8 is represented by four dates, each from a different site. A distinct peak at the end of GI-8 comes from one of these dates with the smallest uncertainty.
– Four dates can also be associated with interstadial GI-7, but the uncertainties are large, causing the calibrated probability distribution peak derived from these dates to be blurred and weakly represented in the overall distribution (Figs. 3B and 3C).
– Interstadials GI-6 and GI-5.2 are poorly defined on the PDF curve. Four dates can be correlated with them, but their uncertainties are significant, making detailed interpretation more challenging.
– The next three peaks in the distribution, correlated with GI 5.1 (8 dates), GI-4 (7 dates) and GI-3 (7 dates), are clearly pronounced.
– There are no dates from the short interstadials GI 2.2 and 2.1. However, a peak formed by three dates appears just before GI 2.2, and a peak from one date occurs at the GI 2.1/GS-2c transition.
– The boundaries of GS-2c/2b and GS-2b/2a are represented by peaks derived from one and three dates, respectively.
– The increasing number of age determinations begins around 17 cal kBP.
– The GS-2a/GI-1e transition is represented by five dates with relatively large uncertainties.
– In the PDF curve for the 15–11.7 cal kBP interval, the transitions GI-1a/GS-1 and the cooling period GI-1b are clearly marked. However, calibration of date subgroups correlated with warmer periods (Fig. 4c.1) and colder periods (Fig. 4c.2) allows for more detailed observations:
Within GI-1, the dated samples correlate with the cooling periods GI-1d (3 samples) and GI-1c2 (3 samples).
The period GI-1b is represented by 11 samples (GI-1c3/GI-1b boundary) and 5 samples (GI-1b/GI-1a boundary).
– The GI-1a/GS1 transition is represented by 4 samples at the end of GI-1a and 7 samples at the beginning of GS-1.
– Within GS-1, a group of 14 dates in the middle of the stadial draws attention, which may indicate the duality of GS-1 and a change in hydrological conditions.
– The GS-1/Holocene transition is recorded by 7 dates at the end of GS-1 and 5 dates at the beginning of the Holocene. Although the Holocene period is beyond the scope of reconstructions, in this article, it is worth noting that the cooling events at 11.4 cal kBP and 9.3 cal kBP are recorded by a group of 5 and 9 dates, respectively.
– The shape of both the summed PDF and the partial PDFs is influenced by the shape of the calibration curve. Especially for younger radiocarbon dates, the stretching of individual date groups’ distributions can also be attributed to its zigzag pattern.
5. Interpretation and Discussion
The specificity of the fluvial environment makes it possible to study both mineral and organic sediments, and thus the possibility of using available geochronological methods for environmental reconstruction. Such reconstructions are particularly valuable when fluvial sediment sequences contain mineral and organic horizons in superposition. Although the fluvial environment is very sensitive to changes and tends to react dynamically, it has the disadvantage that these features may lead to the destruction of the geological record. Summary of available data from the river valleys of the Łódź region, collected from detailed lithological and structural studies (Turkowska, 1988; Krzyszkowski, 1992; Petera, 2002; Wachecka-Kotkowska, 2004; Forysiak, 2005; Wachecka-Kotkowska et al., 2014; Petera-Zganiacz et al., 2015; Dzieduszyńska et al., 2020) with trends, which are illustrated by PDF curves (Fig. 5), gives the opportunity to answer the question about the rank of the signal recorded in the sediment, whether it is local or overregional.
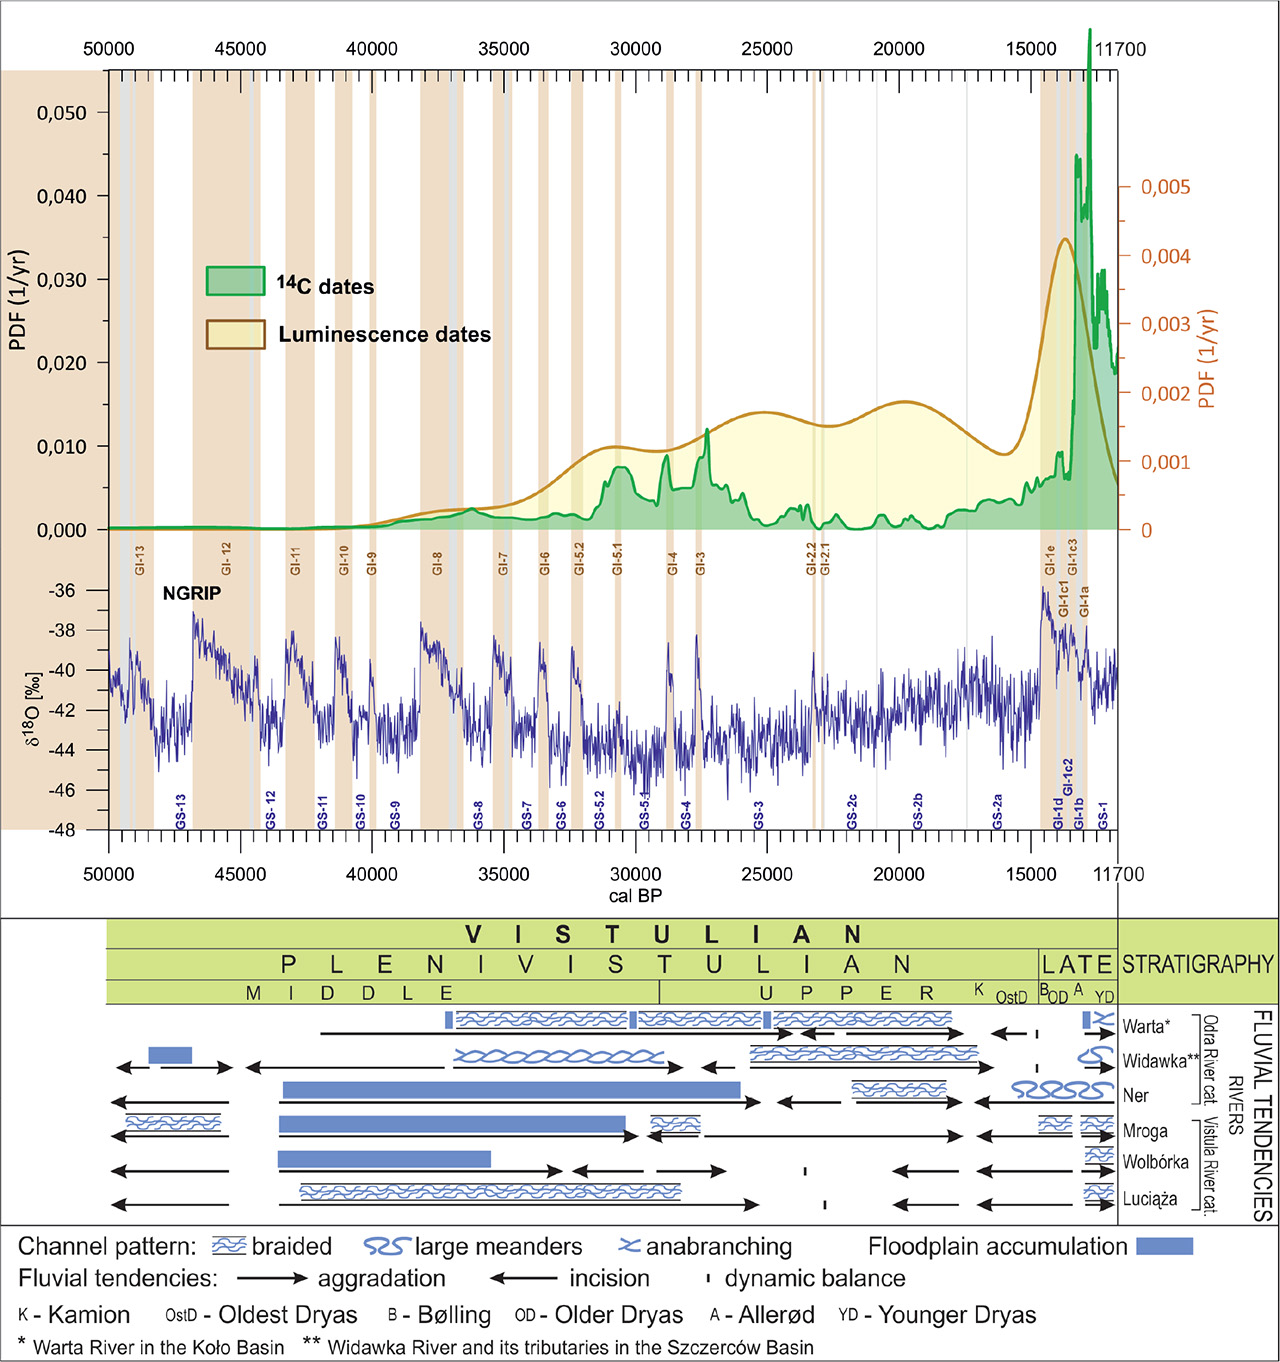
Fig 5.
Correlation of fluvial activity in selected river valleys from the Łódź region (after Dzieduszyńska et al., 2020, changed and supplemented) with PDF curves and the oxygen curve from the NGRIP core (after Rasmussen et al., 2014). PDF, probability density function.
Diversified geological and geomorphological conditions of river valleys in the study area, and thus the presence of sections of different width and depth, determined the characteristics of the components of the accumulation and erosion balance. Sedimentation in the valley system may have been dominated by channel facies or overbank facies deposits, including the formation of extensive flood-plain basins. An additional factor influencing accumulation in the river valleys was the supply of wind-transported material. The sediments that entered the valley were then redeposited by the river, which is reflected in the presence of sedimentary structures typical of a fluvial sedimentary environment and a high content of aeolized quartz grains (e.g. Kasse, 2002; Goździk, 2007; Zieliński et al., 2015). Moreover, the presence of rivers of various sizes determined the rate of response to environmental variability, i.e. the larger the river, the greater the inertia of the system can be expected. Therefore, not every river had to ‘respond’ to the change in paleoenvironmental conditions in the same way. For instance, Zieliński et al. (2015) found that the course of fluvial-aeolian deposition was asynchronous in time and depended on the local threshold condition in the river basin. It occurred and ceased earlier in small valleys than in the larger ones what resulted from the earlier degradation of permafrost and then from the earlier establishment of the vegetation cover.
The occurrence of organic and organic-mineral horizons in alluvia may be a sign of channel migration or a signal of serious paleoenvironmental changes. Considering the issue discussed, it seems important to stress that we have data from various river valleys in which such horizons appeared. Thus, using the PDF curve of radiocarbon dates, it is possible to determine whether a general trend of paleoenvironmental changes has been registered in a given river valley and whether the formation of the horizon resulted from the local conditions of fluvial processes.
The shape of the PDF curves for the set of luminescence and radiocarbon dates in the period up to about 37.0 cal kBP does not provide information on events in the river valleys of the Łódź region. Fluvial tendencies, interpreted from lithological and structural studies, indicate the dominance of erosion (e.g. Turkowska, 1988; Manikowska, 1996; Wachecka-Kotkowska et al., 2014), also reflected in the sedimentary record in the analysed sites presented in this article (Fig. 2). This feature applies not only to the Łódź region (e.g. Mol, 1997; Gębica et al., 2015; Starkel et al., 2015, 2017).
The earliest single dates come from the site of the Parchliny site (>47 cal kBP and 54.7–48 cal kBP; see Fig. 2). The first clearer signal of environmental changes occurs around 36.5 cal kBP, which in relation to the Greenland ice-core record locates between GI-8 and GI-7 events. Some geological evidences are available from the Warta valley (Petera, 2002) and the Widawka valley (Krzyszkowski, 1990, 1991, 1992; Kasse et al., 1998; Krzyszkowski, 1998; Wachecka-Kotkowska et al., 2014), but the current recognition provides no grounds for concluding about common changes in fluvial tendencies in the valleys of the Łódź region (Fig. 5).
The cluster of 14C dates occurs ca. 30.5 cal kBP, which can be correlated with the GI-5.1 warm event. The next one is at ca. 29 cal kBP (GI-4), and the next one is at ca. 27.5 cal kBP (GI-3). Comparing the PDF shape with the integrated image of fluvial tendencies shows the existence of a trigger factor during 30.5–27.5 cal kBP. This resulted in multidirectional responses of rivers, manifested, for example, in a change in the components of the erosion/accumulation balance, a change in the channel pattern, or the formation of organic horizons and even peatbogs in the bottoms of river valleys.
A clear decrease in the number of 14C dates in favour of luminescence dates is from 27.5 cal kBP to 17.0 cal kBP. These relationships between the PDFs reflect a change in the river valleys, expressed by a strong aggradation, primarily of mineral sediments, deposited in a braided river regime during the cold maximum in the Upper Plenivistulian; this is particularly visible in the rivers of the Łódź region, which belong to the Odra River catchment.
From about 17.0 cal kBP (the last deglaciation period) the PDF of radiocarbon dates begins to rise. This time seems crucial for the further evolution of the environment of the North Atlantic region because of a large-scale climatic reorganisation at about 16.2 cal kBP, correlated with Heinrich event one (Denton et al., 2010). Isotopic record in Greenland cores has revealed an increase of moisture (d-excess), which is associated with other key environmental changes documented in different parts of the globe (Landais et al., 2018). The expression of these phenomena in Łódź region, and in particular the increase in humidity, is transformation in a fluvial environment. Strong erosion tendencies led to the morphological formation of a high terrace built of Plenivistulian deposits. The changes also concerned the transformation of channel pattern from braided to large meanders (Turkowska, 2006).
The sharp increase in the course of the 14C PDF curve correlates with the Bølling-Allerød warming phase (GI-1). It is preceded by a peak of the PDF luminescence curve (GS-1.c1), which is not explained in the fluvial record. The next section of the PDF for radiocarbon dates reflects the rapid climatic fluctuations of the Late Glacial, also recorded in the Greenlandic core within GI-1, which, due to their short duration, had no chance for response in the fluvial environment attempting to stabilisation as general trend to warming progressed. The large number of 14C attributed to the GS-1 cooling is associated with changes in river valleys towards accumulation, which intensified with time. This resulted in replacing the deposition of organic-mineral sediments in the bottoms of valleys with a deposition dominated by mineral sediments, forming the surface of the low terrace (Petera-Zganiacz et al., 2015). This process is not reflected in the PDF for luminescence dates, may be due to rapid redeposition affecting the precision of dating (Dzieduszyńska et al., 2014). The response to rapid environmental changes in the valleys of the Łódź region was different as to the channel pattern and resulted from local morphological conditions (Turkowska, 1995; Dzieduszyńska, 2011).
Between 30.5–27.5 cal kBP and 15–11.7 cal kBP, the fluvial environment responded to climate changes in the Northern Hemisphere but the varied responses indicate that these changes were too mild to cause such a consistent response in fluvial trends in the Łódź region as it was in the 27.5–17.0 cal kBP. The results obtained for the Łódź region are currently difficult to compare with the results of research conducted using similar methods in the Carpathian Foreland and the Carpathian Foothills (e.g. Gębica et al., 2015; Starkel et al., 2015, 2017). Although this area is about 150–250 km away from the Łódź region and has a different morphological characteristics, similar reactions of rivers to overregional paleoenvironmental changes can be expected. However, direct correlations prevent the use of different version of calibration curves.
The limitations of the collective analysis method are related to several factors:
Linking dates to dated episodes. The basis of such study is a detailed analysis of source data and the selection of dates for analysis. This factor is the most important. In the case of the analysed region, this stage covers the time period from 2017, when the authors started creating a database for the region. It should be noted that many of the sites included in the study are sites where the authors had already worked much earlier than 2017.
The size of the available set of dates. The larger the number, the greater the possibilities of reconstructing past environmental changes. The authors have made every effort to include all age determinations made for the Łódź region in the database.
Number of sites. For individual researched sites, there is no continuous record for the time period covered by the research. Hence, the greater the number of sites, the greater the possibility of covering the entire analysed time period with reconstructions. The authors have put every effort to include all investigated sites from the analysed region in the database. The lack of dates from a certain time period may be the result of erosion or too few sites included in the analysis. Therefore, we focus on analysing the peaks of the distribution, not its gaps.
Date uncertainties. The greater the uncertainties, the wider the PDF distributions and the more difficult they are to correlate with the INTIMATE stratigraphy. Precise 14C AMS dates are most desirable. The importance of luminescence dates in this type of analyses is much smaller than that of radiocarbon dates. The vast majority of radiocarbon age determinations included were made using conventional techniques and are characterised by greater uncertainties than AMS dates. Certainly, in the future, new 14C age determinations using the AMS technique will contribute to more detailed reconstructions.
6. Conclusion
A comprehensive analysis of 14C age determinations from the Łódź region reveals a correlation between local environmental changes and changes recorded in the NGRIP core. Radiocarbon dating of organic materials associated with fluvial environmental changes indicates that these changes mainly occurred during interstadial periods. Particularly significant changes are observed for interstadials GI-3, GI-4 and GI-5.1. For older periods, we also observe peaks in the PDF distributions, but due to a decrease in the number of dates and increasing uncertainties with age, it becomes more challenging to unambiguously assign them to specific interstadials. Geological data at our disposal are based on sedimentological studies in individual river valleys and were obtained in conditions of obvious limitations resulting from the specificity of the fluvial environment. The course of the PDF curves, in particular, the curve created on the basis of radiocarbon dating and the comparison of its course with the record of changes in the oxygen isotope in the Greenland ice-cores, suggests that there may have been more erosion and accumulation phases. Further work on this topic will be continued, but more precise reconstructions will require studies of new sites and the availability of a greater number of precise age determinations. However, direct correlations prevent the use of different version of the radiocarbon calibration curve in the papers cited above.
Acknowledgements
We would like to thank Prof. Piotr Kittel and Prof. Jacek Forysiak for providing unpublished dates.
Notes
[1] Source of Funding
Some dates were obtained as part of the research project No. 2016/21/B//ST10/02451 entitled ‘Morphogenetic processes as determinants of vegetation patterns under impact of the Younger Dryas global climatic changes’ financed by the National Science Center.
Supplementary
Database of radiocarbon and luminescence dates for fluvial sediments, Łódź region, central Poland.
| No. | Site name / Sample name | Long E | Lat N | Alt. [m a.s.l.] | Dated material | Lab. Code | 14C Age [BP] | Dating technique AMS / LSC / GPC | References |
|---|---|---|---|---|---|---|---|---|---|
| 1 | Aleksandrów (KWB Adamów) | No data | No data | No data | organic silt | Lod 1045 | 23010±390 | LSC | Forysiak J. 2005. Rozwój doliny Warty między Burzeninem i Dobrowem po zlodowaceniu warty. Acta Geographica Lodziensia 90: 5–116. (in Polish, summary in English) |
| 2 | organic silt | Lod 1084 | 24400±470 | LSC | |||||
| 3 | Bechcice | No data | No data | No data | peat | IGSB 1381 | 11020±230 | LSC | Stachowicz-Rybka R, Obremska M, Kittel P, Pawłowski D, Cywa K, Forysiak J. 2011. Zapis zmian paleośrodowiskowych w kontekście archeologicznym w osadach wypełnienia paleokoryta w dolinie Neru na stanowisku Kolonia Bechcice (woj. Łódzkie, Polska Środkowa). V Konferencja Paleobotaniki Czwartorzędu, Górzno: 13–17. (in Polish) |
| 4 | organic silt | MKL 285 | 11240±180 | LSC | Kittel P. 2012. Budowa i ewolucja doliny Neru w rejonie stanowiska Lutomiersk-Koziówki w świetle badań geoarcheologicznych. Acta Geographica Lodziensia 100:113–133. (in Polish, summary in English) | ||||
| 5 | Byszewy | No data | No data | No data | peat | Lod-467 | 8420±170 | LSC | Kamiński J. 1993. Późnoplejstoceńska i holoceńska transformacja doliny Moszczenicy jako rezultat zmian środowiska naturalnego oraz działalności człowieka. Acta Geographica Lodziensia 64. (in Polish, summary in English) |
| 6 | Gieczno | No data | No data | No data | organic silt | Lod 437 | 30500±800 | LSC | |
| 7 | Głowy | 18.67 | 52.1 | 96 | peat | MKL 1647 | 10360±70 | LSC | Majecka A, Okupny D, Borówka RK, Tomkowiak J, Fortuniak A, Forysiak J, Petera-Zganiacz J, Słowiński M, Krajewska I. 2014. Osady kopalnego starorzecza Warty z późnego vistulianu w odkrywce Koźmin-Głowy (Kotlina Kolska) w świetle wstępnych analiz paleoekologicznych [In:] XXI Konferencja Stratygrafia Plejstocenu Polski “Dynamika lądolodów plejstoceńskich na obszarze Sokólszczyzny i Równiny Augustowskiej”, Augustów: 68–69. (in Polish) |
| 8 | gyttja | MKL 1649 | 11120±70 | LSC | |||||
| 9 | gyttja | MKL 1648 | 11260±70 | LSC | |||||
| 10 | gyttja | MKL 2311 | 11350±130 | LSC | |||||
| 11 | gyttja | MKL 2312 | 12140±140 | LSC | |||||
| 12 | gyttja | MKL 2313 | 12350±130 | LSC | |||||
| 13 | peat | MKL 1646 | 9930±60 | LSC | |||||
| 14 | Janiszew Poduchowny | 18.66 | 52.09 | 96.5 | peat | Lod 1284 | 25100±500 | LSC | Petera-Zganiacz J. 2007. Stratygrafia osadów vistuliańskich a młodoczwartorzędowa aktywność tektoniczna w okolicach Koźmina. Prace Instytutu Geografii Akademii Świętokrzyskiej w Kielcach 16: 103–116. (in Polish, summary in English) |
| 15 | 18.65 | 52.09 | 96.8 | peat | Lod 1392 | 28330±740 | LSC | ||
| 16 | Kamion | No data | No data | No data | organic silt + peat | Lod 680 | 11250±170 | LSC | Kobojek E. 2000. Morfogeneza doliny Rawki. Acta Geographica Lodziensia 77. (in Polish, summary in English) |
| 17 | mud and clay enriched in humus horizon | Gd-4344 | 13500±290 | GPC | Cichosz-Kostecka A, Mycielska-Dowgiałło E, Manikowska B. 1991. Late Glacial aeolian processes in the light of sediment analysis from Kamion profile near Wyszogród. Zeitschrift für Geomorphologie, Suppl.-Bd. 90: 45–50. | ||||
| 18 | mud and clay enriched in humus horizon | Gd-4343 | 14300±300 | GPC | |||||
| 19 | 20.18 | 52.35 | No data | mud and clay enriched in humus horizon | Lod 85 | 14590±270 | LSC | Manikowska B. 1985. O glebach kopalnych, stratygrafii i litologii wydm Polski środkowej. Acta Geographica Lodziensia 52. (in Polish, summary in English) | |
| 20 | Kolonia Bechcice | No data | No data | No data | decomposed peat | IGSB-1382 | 8250±150 | LSC | Kittel P., 2014. Slope deposits as an indicator of anthropopressure in the light of research in Central Poland. Quaternary International 324: 34–55. |
| 21 | organic mud | Lod-1441 | 9020±80 | LSC | |||||
| 22 | Kolonia Bechcice | 19.23 | 51.75 | No data | decomposed peat | Poz-41755 | 9090±50 | AMS | Płóciennik M., Kittel P., Borówka R.K., CywaK., Okupny D., Obremska M., PawłowskiD., Stachowicz-Rybka R., SzpernaR., WitkowskiA., et al. 2016. Warunki paleoekologiczne subkopalnego koryta Kolonia Bechcice na tle hydrologii środkowego odcinka doliny Neru. Acta Geographica Lodziensia 105: 107–124. (inPolish, summary in English) |
| 23 | gyttja | MKL-417 | 9520±90 | LSC | |||||
| 24 | No data | No data | No data | organic silt | IGSB-1384 | 9120±440 | LSC | unpublished | |
| 25 | Koźmin JPII/I | No data | No data | No data | organic silt with charcoal | MKL-1388 | 9240±80 | LSC | unpublished |
| 26 | Koźmin-KN | 18.67 | 52.10 | 96.0 | gyttja | MKL-4276 | 8380±100 | LSC | unpublished |
| 27 | gyttja | MKL-4277 | 8740±90 | LSC | |||||
| 28 | gyttja | MKL-3336 | 9310±80 | LSC | |||||
| 29 | gyttja | MKL-3373 | 8270±100 | LSC | |||||
| 30 | Koźmin-Las | 18.67 | 52.08 | 97.5 | organic matter in sandy silt | MKL-1077 | 9780±110 | LSC | Dzieduszyńska D, Petera-Zganiacz J, TwardyJ, Kittel P, Moska P and Adamiec G, 2014a. Optical dating and sedimentary record from the terrace depositional profile of the Warta River (central Poland). Geochronometria 41(4): 361–368. |
| 31 | 18.67 | 52.08 | 97.5 | organic silt | MKL-1076 | 9780±150 | LSC | ||
| 32 | 18.67 | 52.08 | 97.5 | plant remains: Betula sect. Albae - 2 fruit scales | Poz 50361 | 10000±80 | AMS | ||
| 33 | 18.67 | 52.08 | 97.5 | plant remains: Betula sect. Albae - 2 fruit scales; Pinus Sylvestris - 1 shoot | Poz 50360 | 10430±80 | AMS | ||
| 34 | 18.67 | 52.08 | 97.5 | plant remains: Pinus sylvestris - shoots & fragment of needle | Poz 50356 | 10850±60 | AMS | ||
| 35 | Koźmin | 18.67 | 52.08 | 97.5 | charcoal in flood sediments | GdA-6077 | 10480±50 | AMS | unpublished |
| 36 | 18.65 | 52.08 | 97.5 | organic silt | Gd-9740 | 10200±430 | GPC | Petera-Zganiacz J, Dzieduszyńska D. 2007. Wymowa paleogeograficzna horyzontu pni kopalnych w osadach późnego vistulianu. Acta Geographica Lodziensia 93: 57–66. (in Polish, summary in English) | |
| 37 | 18.65 | 52.09 | 97 | organic silt | Lod 1389 | 10350±90 | LSC | ||
| 38 | No data | No data | No data | organic silt | Lod-661 | 8250±120 | LSC | Petera J. 2002. Vistuliańskie osady dolinne w basenie uniejowskim i ich wymowa paleogeograficzna. Acta Geographica Lodziensia 83. (in Polish, summary in English) | |
| 39 | No data | No data | No data | peat | Lod 974 | 11980±110 | LSC | MAiE archives | |
| 40 | 18.61 | 52.03 | 107 | organic silt | MKL 4275 | 12420±130 | LSC | unpubished | |
| 41 | 18.66 | 52.08 | 97.5 | peat | Lod 768 | 18480±230 | LSC | Petera J. 2002. Vistuliańskie osady dolinne w basenie uniejowskim i ich wymowa paleogeograficzna. Acta Geographica Lodziensia 83. (in Polish, summary in English) | |
| 42 | 18.65 | 52.08 | 97 | organic silt | Lod 659 | 24200±300 | LSC | ||
| 43 | 18.66 | 52.08 | 97.5 | organic silt | Lod 769 | 29950±900 | LSC | ||
| 44 | 18.67 | 52.09 | 97 | organic silt | Lod 1403 | 31280±1050 | LSC | Petera-Zganiacz J, Adamiec G. 2010. The age of the Warta river valley deposits based on 14C, TL, OSL dating methods (Kotlina Kolska, Middle Poland). 10th International Conference “Methods of Absolute Chronology”. 22–25 April 2010, Gliwice, Poland: 112. | |
| 45 | Koźmin Północ | 18.66 | 52.08 | 97 | organic silt | Lod 879 | 26290±560 | LSC | Petera J. 2002. Vistuliańskie osady dolinne w basenie uniejowskim i ich wymowa paleogeograficzna. Acta Geographica Lodziensia 83. (in Polish, summary in English) |
| 46 | organic silt | Lod 878 | 31740±1100 | LSC | |||||
| 47 | organic silt | Lod 881 | 36310±1860 | LSC | |||||
| 48 | Koźmin Środkowy | 18.67 | 52.08 | 97.5 | organic silt | Lod 700 | 28600±260 | LSC | Petera J. 2002. Vistuliańskie osady dolinne w basenie uniejowskim i ich wymowa paleogeograficzna. Acta Geographica Lodziensia 83. (in Polish, summary in English) |
| 25 | Koźmin-Kwiatków | No data | No data | No data | organic silt | GdS-4021 | 9980±100 | LSC | unpublished |
| 49 | 18.68 | 52.10 | 96.5 | organic silt | GdS-4062 | 10600±90 | LSC | ||
| 51 | 18.68 | 52.10 | 96.3 | organic silt | GdS-4030 | 9990±90 | LSC | ||
| 52 | organic silt | GdS-4048 | 10380±260 | LSC | |||||
| 53 | Krzeczów | No data | No data | No data | peat | Lod-365 | 9080±150 | LSC | Kanwiszer A, Trzeciak P. 1991. Lodz radiocarbon dates III. Radiocarbon 33(1): 115–130. |
| 54 | Kwiatków | 18.68 | 52.1 | 96.5 | organic silt | MKL 1644 | 10940±100 | LSC | Petera-Zganiacz J, Piotrowska M, TwardyJ, Dzieduszyńska DA, Okupny D, Forysiak J, Rzepecki S. 2019a. Environmental conditions as a key factor in the functioning of wells at a settlement from the Roman period of the Iron Age. Quaternary International 501: 250–268. |
| 55 | organic silt | MKL 1645 | 10960±100 | LSC | |||||
| 56 | Kwiatków DJ | 18.68 | 52.1 | 96 | organic silt | MKL 3335 | 10720±100 | LSC | Dzieduszyńska DA, Petera-Zganiacz J. 2018. Small-scale geologic evidence for Vistulian decline cooling periods: case studies from the Łódź Region (Central Poland). Bulletin of the Geological Society of Finland 90(2): 209–222. |
| 57 | Lublinek | No data | No data | No data | organic silt | Gd-9196 | 10220±170 | LSC | Turkowska K, Dzieduszyńska D. 2011. Local evidence of landform evolution vs. global changes – a case of Younger Dryas study in the upper Ner valley system, central Poland. Geographia Polonica 84, Special Issue 1: 147–162. |
| 58 | organic silt | Gd-10027 | 10690±140 | LSC | |||||
| 59 | organic layer | Lod 444 | 11320±160 | LSC | |||||
| 60 | organic mud | Lod 479 | 12470±180 | LSC | Turkowska K. 1988. Rozwój dolin rzecznych na Wyżynie Łódzkiej w późnym czwartorzędzie. Acta Geographica Lodziensia 57. (in Polish, summary in English) | ||||
| 61 | 19.35 | 51.73 | No data | organic silt | Lod 238 | 12950±390 | LSC | ||
| 62 | 19.35 | 51.73 | No data | organic silt in situ | Lod 370 | 13800±200 | LSC | ||
| 63 | No data | No data | No data | organic mud | Lod 445 | 16200±200 | LSC | Turkowska K, Dzieduszyńska D. 2011. Local evidence of landform evolution vs. global changes – a case of Younger Dryas study in the upper Ner valley system, central Poland. Geographia Polonica 84, Special Issue 1: 147–162. | |
| 64 | organic mud | Lod 478 | 17100±200 | LSC | |||||
| 65 | organic detritus | Gd-1906 | 21720±220 | GPC | Turkowska K. 1988. Rozwój dolin rzecznych na Wyżynie Łódzkiej w późnym czwartorzędzie. Acta Geographica Lodziensia 57. (in Polish, summary in English) | ||||
| 66 | 19.35 | 51.73 | No data | organic silt | Lod 275 | 9850±250 | LSC | ||
| 67 | No data | No data | No data | organic detritus | Gd-7541 | 9470±40 | LSC | ||
| 68 | organic detritus | Lod 274 | 9380±250 | LSC | Turkowska K. 1988. Rozwój dolin rzecznych na Wyżynie Łódzkiej w późnym czwartorzędzie. Acta Geographica Lodziensia 57. | ||||
| 69 | organic detritus | Gd-10099 | 9200±90 | GPC | Turkowska K, Dzieduszyńska D. 2011. Local evidence of landform evolution vs. global changes – a case of Younger Dryas study in the upper Ner valley system, central Poland. Geographia Polonica 84, Special Issue 1: 147–162. | ||||
| 70 | Lublinek | No data | No data | No data | poorly decomposed peat | Gd-2410 | 8400±200 | GPC | Turkowska K. 1988. Rozwój dolin rzecznych na Wyżynie Łódzkiej w późnym czwartorzędzie. Acta Geographica Lodziensia 57. (in Polish, summary in English) |
| 71 | organic layer | Lod 342 | 8350±160 | LSC | Turkowska K. 1988. Rozwój dolin rzecznych na Wyżynie Łódzkiej w późnym czwartorzędzie. Acta Geographica Lodziensia 57. (in Polish, summary in English) | ||||
| 72 | organic layer | Lod 373 | 8250±150 | LSC | |||||
| 73 | pine cone | Gd-1839 | 8240±160 | GPC | Turkowska K. 1988. Rozwój dolin rzecznych na Wyżynie Łódzkiej w późnym czwartorzędzie. Acta Geographica Lodziensia 57. (in Polish, summary in English) | ||||
| 74 | organic layer | Lod 276 | 8180±220 | GPC | Turkowska K. 1990. Main fluvial episodes in the Ner Valley in the last 22 000years; a detailedin Lublinek near Łódź, Central Poland. Quaternary Studies in Poland 9: 85–89. | ||||
| 75 | Lutomiersk-Koziówki | No data | No data | No data | organic silt with plant detritus | MKL-286 | 9240±120 | LSC | Kittel P. 2012. Budowa i ewolucja doliny Neru w rejonie stanowiska Lutomiersk-Koziówki w świetle badań geoarcheologicznych. Acta Geographica Lodziensia 100: 113–133. (in Polish, summary in English) |
| 76 | peat | MKL-287 | 8670±70 | LSC | |||||
| 77 | peat | MKL-284 | 9030±160 | LSC | |||||
| 78 | organic silt with plant detritus | MKL-283 | 9240±120 | LSC | |||||
| 79 | Łęg Ręczyński | 19.22 | 51.23 | No data | peat | Lod 328 | 10270±220 | LSC | Kanwiszer A, Trzeciak P. 1986. Lodz radiocarbon dates II. Radiocarbon 28(3): 1102–1109. |
| 80 | Łykowe | 18.78 | 51.2 | No data | sandy peat | Lod-150 | 8070±180 | LSC | Kanwiszer A, Trzeciak P. 1991. Lodz radiocarbon dates III. Radiocarbon 33(1): 115–130. |
| 81 | sandy peat | Lod-149 | 9150±210 | LSC | |||||
| 82 | organic silt | Lod 148 | 10380±220 | LSC | MAiE archives | ||||
| 83 | peat | Lod 358 | 11700±200 | LSC | |||||
| 84 | Majkowice | No data | No data | No data | peat | Gd-2044 | 13030±200 | GPC | Szumański A. 1983. Palaeochannelsof large meandersin the river valley of the Polish Lowland. Quaternary Studies in Poland 4: 207–16. |
| 85 | Paskrzyn | 19.87 | 51.23 | 182.5 | choarcoal | Lod 263 | 11600±300 | LSC | MAiE archives |
| 86 | 19.87 | 51.23 | No data | organic silt | Lod 244 | 12250±190 | LSC | ||
| 87 | 19.87 | 51.23 | 183 | sandy silt with plant detritus | Lod 262 | 13200±200 | LSC | ||
| 88 | Polesie | No data | No data | No data | sand and silty sand | Lod-1380 | 21990±350 | LSC | Twardy J. 2008. Transformacja rzeźby centralnej części Polski Środkowej w warunkach antropopresji. Łódź: Wydawnictwo Uniwersytetu Łódzkiego. (in Polish) |
| 89 | Przedbórz | 19 53 00 | 51 03 00 | 190 | peat | Gd-1468 | 8890±60 | GPC | Szumański A. 1983. Paleochannels of the large meanders in the river valleys of the Polish Lowland. Quaternary Studies in Poland 4: 207–216. |
| 90 | Rogóźno | No data | No data | No data | plant remains | Lod-442 | 8950±180 | LSC | Kamiński J. 1993. Późnoplejstoceńska i holoceńska transformacja doliny Moszczenicy jako rezultat zmian środowiska naturalnego oraz działalności człowieka. Acta Geographica Lodziensia 64. (in Polish, summary in English) |
| 91 | plant remains | Lod-443 | 8700±160 | LSC | |||||
| 92 | organic silt | Lod 411 | 10400±200 | LSC | |||||
| 93 | Rozprza | 19.67 | 51.3 | 183 | macrofossils in organic mud; Pinus sylvestris - 22 shoots and 2 needles; Betula sect. albae - 1 fruit scale and 1 fruit; Betula nana - 3 fruits | MKL-A4682 | 10069±27 | AMS | unpublished |
| 94 | gyttja | MKL-2408 | 10200±120 | LSC | Kittel P, Sikora J, Woroniecki P. 2018. A Late Medieval motte-and-bailey settlement in a lowland river valley landscape of Central Poland. Geoarchaeology 33: 558–578. | ||||
| 95 | clayey gyttja | MKL-2818 | 10380±70 | LSC | |||||
| 96 | macrofossils in coarse detritus gyttja with sandy admixtures: Pinus sylvestris - 8 shoots and 5 bud scales; shrub buds undif. - 5; Betula sect. albae - 4 fruit scales | MKL-A3933 | 10415±26 | AMS | |||||
| 97 | gyttja | MKL-2959 | 10810±90 | LSC | |||||
| 98 | macrofossils in coarse detritus gyttja: Pinus sylvestris – fragments of needle | MKL-A3566 | 10877±31 | LSC | |||||
| 99 | macrofossils in peaty organic mud: Pinus sylvestris - 20 shoots; Betula sect. albae - 2 fruit scales and 3 fruits; Betula nana - 4 fruit scales and 2 fruits; Filipendula ulmaria - 1 seed; Urtica dioica - 1 seed | MKL-A4681 | 10889±35 | AMS | |||||
| 100 | gyttja | MKL-2960 | 10930±100 | LSC | |||||
| 101 | peaty organic mud; Pinus sylvestris - 2 seeds and 20 shoots; Betula sect. albae - 2 fruit scales; Carex sp. trigonous - 1 fruit | MKL-A3934 | 11029±26 | LSC | |||||
| 102 | clayey organic mud | MKL-2819 | 11070±80 | LSC | |||||
| 103 | macrofossils in organic mud: Pinus sylvestris - 1 fragment of cone, 5 shoots and 2 fragments of needle; Betula sect. albae - 2 fruit scales and 5 fruits; Betula nana - 7 fruit scales and 6 fruits | MKL-3503A | 11126±82 | AMS | |||||
| 104 | macrofossils in organic mud: Pinus sylvestris - 4 fragments of cone and 3 bud scales; Betula sect. albae - 2 fruit scales | MKL-A3935 | 11404±27 | AMS | |||||
| 105 | clayey organic mud | MKL-2961 | 12010±120 | LSC | |||||
| 106 | laminated organic mud | MKL-2820 | 12720±80 | LSC | |||||
| 107 | Swędów JK | No data | No data | No data | peat | Lod-303 | 8740±110 | LSC | Kamiński J. 1989. Wpływ holoceńskich procesów eolicznych na kształtowanie dna doliny Moszczenicy. Acta Geographica Lodziensia 59:11–17. |
| 108 | peat | Lod 339 | 32800±900 | LSC | Kamiński J. 1993. Późnoplejstoceńska i holoceńska transformacja doliny Moszczenicy jako rezultat zmian środowiska naturalnego oraz działalności człowieka. Acta Geographica Lodziensia 64. | ||||
| 109 | 146 | organic silt | Lod 286 | 10370±250 | LSC | ||||
| 110 | organic silt | Lod 304 | 10850±180 | LSC | |||||
| 111 | Swędów | 19.52 | 51.92 | 145 | organic silt | GdS 3963 | 11390±100 | LSC | Petera-Zganiacz J, Dzieduszyńska DA, Forysiak J, Twardy J, Milecka K, Czerwiński B. 2019b. The Late Vistulian record in deposits of the Moszczenica River valley at the Swędów site (Central Poland). [In:] Börner A. Hüneke H. Lorenz S. (Eds.) Field Symposium of the INQUA PeriBaltic Working Group “From Weichselian Ice-Sheet Dynamics to Holocene Land Use Development in Western Pomerania and Mecklenburg”. Abstract Volume. Scientific Technical Report STR 19/01, Potsdam: GFZ German Research Centre for Geosciences:74–76. DOI: http://doi.org/10.2312/GFZ.b103-19012 |
| 112 | organic silt | GdS 3970 | 11410±65 | LSC | |||||
| 113 | organic silt, rejuvenated date, not analysed | GdS-3983 | 8980±95 | LSC | |||||
| 114 | Swędów II | 19.52 | 51.92 | 146,25 | organic silt | GdA-6444 | 10660±60 | AMS | unpublished |
| 115 | Świerczyna | No data | No data | No data | wood | Poz-52513 | 8060±90 | AMS | Pawłowski D, Płóciennik M, Brooks SJ, Luoto TP, Milecka K, Nevalainen L, Peyron O, Self A, Zieliński T. 2015. A multiproxy study of Younger Dryas and Early Holocene climatic conditions from the Grabia River paleo-oxbow lake (central Poland). Palaeogeography, Palaeoclimatology, Palaeoecology 438: 34–50. |
| 116 | stems of moss | Poz-54910 | 9500±50 | AMS | |||||
| 117 | 19.01 | 51.47 | 94 | plant remains | Poz 52514 | 10010±70 | AMS | ||
| 118 | plant remains | Poz 54911 | 10150±90 | AMS | |||||
| 119 | plant remains | Poz 54915 | 10250±110 | AMS | |||||
| 120 | plant remains | Poz 54914 | 10360±60 | AMS | |||||
| 121 | plant remains | Poz 54913 | 10370±80 | AMS | |||||
| 122 | plant remains | Poz 52516 | 10420±60 | AMS | |||||
| 123 | Troniny | 18.75 | 51.1 | No data | organic silt | Lod 357 | 10710±180 | LSC | MAiE archives |
| 124 | Tum | No data | No data | No data | peat | Lod-1558 | 8650±80 | LSC | Marosik P, Forysiak J. 2014. Ukształtowanie terenu, budowa geologiczna i rozwój paleogeograficzny otoczenia grodziska w Tumie. [In:] Grygiel R, Jurek T (eds.), Początki Łęczycy. Archeologia środowiskowa średniowiecznej Łęczycy, t. I. MAiE, Łódź: 59–94. (in Polish) |
| 125 | peat | Lod-1499 | 8790±80 | LSC | |||||
| 126 | organic silt | Lod-1598 | 8950±80 | LSC | |||||
| 127 | peat | Lod-1596 | 9010±80 | LSC | |||||
| 128 | organic silt | Lod-1588 | 9190±80 | LSC | |||||
| 129 | organic silt | Lod-1595 | 9250±80 | LSC | |||||
| 130 | peaty silt | Lod-1590 | 9490±90 | LSC | |||||
| 131 | peaty gyttja | Lod-1589 | 9770±90 | LSC | |||||
| 132 | gyttja | Lod 1560 | 10190±90 | LSC | |||||
| 133 | organic silt | Lod 1592 | 10210±90 | LSC | |||||
| 134 | peat | Lod 1599 | 10390±90 | LSC | |||||
| 135 | peat | Lod 1591 | 10870±100 | LSC | |||||
| 136 | gyttja | Lod 1498 | 10880±100 | LSC | |||||
| 137 | gyttja | Lod 1549 | 11270±100 | LSC | |||||
| 138 | gyttja | Lod 1593 | 11280±100 | LSC | |||||
| 139 | gyttja | Lod 1559 | 11290±100 | LSC | |||||
| 140 | Warenka | 18.61 | 52.03 | 107 | organic silt | MKL 4280 | 19970±260 | LSC | unpublished |
| 141 | organic silt | MKL 4278 | 22540±210 | LSC | |||||
| 142 | organic silt | MKL 4279 | 23170±230 | LSC | |||||
| 143 | 18.63 | 52.05 | 105 | organic silt | GdA-6445 | 22370±150 | AMS | ||
| 144 | organic silt | GdA-6446 | 19580±120 | AMS | |||||
| 145 | organic silt | GdA-6447 | 25460±200 | AMS | |||||
| 146 | Warszyce | No data | No data | No data | peat | Lod-469 | 8900±170 | LSC | Kamiński J. 1993. Późnoplejstoceńska i holoceńska transformacja doliny Moszczenicy jako rezultat zmian środowiska naturalnego oraz działalności człowieka. Acta Geographica Lodziensia 64. (in Polish, summary in English) |
| 147 | organic silt | Lod 439 | 28900±700 | LSC | |||||
| 148 | Wierzbowa | 19.08 | 51.97 | 112–116 | organic mud | Lod-1450 | 9270±80 | LSC | Kittel P., 2014. Slope deposits as an indicator of anthropopressure in the light of research in Central Poland. Quaternary International 324: 34–55. |
| 149 | Parchliny A (PARCH 3) | 19.14 | 51.23 | 175.5 | organic horizon in sandy-muddy deposits | GdS-1128 | 43500 ± 2000 | LSC | Wachecka-Kotkowska L, Krzyszkowski D, Klaczak K, Król E, 2014. Middle Weichselian pleniglacial sedimentation in the Krasówka river palaeovalley, Central Poland. Annales Societatis Geologorum Poloniae 84(4): 323–340. |
| 150 | Parchliny A PARCH 2) | 19.14 | 51.23 | 163.9 | peat; middle part of organic horizon | GdS-1127 | 47500 ± 3500 | LSC | |
| 151 | Parchliny B (PARCH 4) | 19.15 | 51.23 | 164.4 | organic horizon in sand-mud | GdS-1366 | 33090 ± 580 | LSC | |
| 152 | Parchliny B (PARCH5) | 19.15 | 51.23 | 165.7 | organic horizon in sand-mud | GdS-1371 | 24080 ± 250 | LSC | |
| 153 | Folwark 1; B/2691 | 192 | humic acids | GrN-18148 | 23370 ± 250 | AMS | Kasse C, Huijzer AS, Krzyszkowski D, Bohncke SJP and Coope GR. 1998. Weichselian Late Pleniglacial and Late-glacial depositional environments, Coleoptera and periglacial climatic records from central Poland (Betchatow). Journal of Quaternary Science 13(5): 455–469. | ||
| 154 | 197 | organic deposits | GrN-18147 | 24630 ± 110 | AMS | Kasse C, Huijzer AS, Krzyszkowski D, Bohncke SJP and Coope GR. 1998. Weichselian Late Pleniglacial and Late-glacial depositional environments, Coleoptera and periglacial climatic records from central Poland (Betchatow). Journal of Quaternary Science 13(5): 455–469. | |||
| 155 | Folwark 1; B/2692 | 192 | humic acids | GrN-20387 | 22730 ± 250 | AMS | Kasse C, Huijzer AS, Krzyszkowski D, Bohncke SJP and Coope GR. 1998. Weichselian Late Pleniglacial and Late-glacial depositional environments, Coleoptera and periglacial climatic records from central Poland (Betchatow). Journal of Quaternary Science 13(5): 455–469. | ||
| 156 | humic acids | GrN-18150 | 23400 ± 320 | AMS | |||||
| 157 | 19.29 | 51.25 | 197 | organic deposits | GrN-18149 | 24590 ± 120 | AMS | Krzyszkowski D. 1998. Stratigraphy and sedimentology of Weichselian deposits at Folwark, Belchatów outcrop, central Poland. Quaternary Studies in Poland 15: 3–26. | |
| 158 | Folwark 2; B/2695 | 197 | organic deposits | GrN-18155 | 25970 ± 220 | AMS | Kasse C, Huijzer AS, Krzyszkowski D, Bohncke SJP and Coope GR. 1998. Weichselian Late Pleniglacial and Late-glacial depositional environments, Coleoptera and periglacial climatic records from central Poland (Betchatow). Journal of Quaternary Science 13(5): 455–469. | ||
| 159 | organic deposits | GrN-20388 | 26320 ± 270 | AMS | |||||
| 160 | organic deposits | GrN-18156 | 27190 ± 200 | AMS | |||||
| 161 | organic deposits | GrN-20529 | 27270 ± 750 | AMS | |||||
| 162 | Folwark 2; B/2696 | organic deposits | GrN-20528 | 21420 ± 350 | AMS | ||||
| 163 | organic deposits | GrN-18158 | 26190 ± 270 | AMS | |||||
| 164 | organic deposits | GrN-18157 | 26430 ± 240 | AMS | |||||
| 165 | organic deposits | GrN-20389 | 26620 ± 360 | AMS | |||||
| 166 | Folwark 8; B/2742 | 19.27 | 51.22 | 199 | plant macrofossils | GrA-3016 | 22990 ± 120 | AMS | |
| 167 | Kuców C-I | No data | No data | No data | organic material in loam | Lod-738 | 31860 ± 350 | LSC | Trzeciak P, Borowiec I. 2013. Oznaczanie chronologii bezwzględnej metodą radiowęglową w Pracowni Muzeum Archeologicznego i Etnograficznego w Łodzi. Prace i Materiały Muzeum Archeologicznego i Etnograficznego w Łodzi, Seria Numizmatyczno-Konserwatorska. (in Polish) |
| 168 | Kuców C-III | No data | No data | No data | organic material in silt/clay | Lod-746 | 25620 ± 540 | LSC | MAiE archives |
| 169 | Stawek γ-96 | No data | No data | No data | organic material in silty sand | Lod-737 | 20170 ± 250 | LSC | Trzeciak P, Borowiec I. 2013. Oznaczanie chronologii bezwzględnej metodą radiowęglową w Pracowni Muzeum Archeologicznego i Etnograficznego w Łodzi. Prace i Materiały Muzeum Archeologicznego i Etnograficznego w Łodzi, Seria Numizmatyczno-Konserwatorska. (in Polish) |
| 170 | No data | No data | No data | No data | unknow | unknow | 23700 ± 800 | LSC | Manikowska B. 1996. Dwucykliczność ewolucji środowiska peryglacjalnego w Polsce Środkowej podczas vistulianu. Biuletyn Państwowego Instytutu Geologicznego 373: 97–106. (in Polish, summary in English) |
| 171 | Bełchatów | No data | No data | No data | organic mud | Gd-2640 | 12440 ± 180 | GPC | Goździk, JS. 1995b. Vistulian sediments in the Bełchatów open cast mine, Central Poland. Qualernary Studies in Poland 13: 13–26. |
| 172 | organic mud | Gd-4348 | 13670 ± 240 | GPC | |||||
| 173 | Bełchatów Piaski | No data | No data | No data | plant remains | Lod 116 | 14350 ± 580 | LSC | Goździk J. 1980. Osady i struktury peryglacjalne z plejstocenu okolic Bełchatowa. Przewodnik LIII, Zjazdu Polskiego Towarzystwa Geologicznego. Wydawnictwa Geologiczne, Waszawa: 322–325. (in Polish) |
| 174 | Bełchatów JG/82 | No data | No data | No data | organic materials in silt | Gd-2035 | 11630 ± 180 | GPC | French HM, Goździk JS 1988. Pleistocene epigenetic and syngenetic frost fissures, Bełchatów, Poland. Canadian Journal of Earth Science 25(12): 2017–2027. |
| 175 | Bełchatów profile B; kopalnia-D | No data | No data | No data | peat | Lod-317 | 32700 ± 900 | LSC | Kanwiszer A, Trzeciak P. 1991. Lodz radiocarbon dates III. Radiocarbon 33(1): 115–130. |
| 176 | Bełchatów; I/83/JG | 51.25 | 19.38 | peat | Gd-1707 | 11170 ± 110 | GPC | Michczyńska D.J., Dzieduszyńska D.A., Petera-Zganiacz J., Wachecka-Kotkowska L., Krzyszkowski D., Wieczorek D., Ludwikowska-Kędzia M., Gębica P. Starkel L., 2022. Climatic oscillations during MIS 3-2 recorded in sets of 14C and OSL dates - a study based on data from Poland. Radiocarbon 64(6): 1373–1386. | |
| 177 | BełchatówII/83/JG | 19.38 | 51.25 | peat | Gd-2189 | 10160 ± 140 | GPC | ||
| 178 | Piaski 3 | No data | No data | No data | organic material in ooze formation | Lod-118 | 25200 ± 740 | LSC | Goździk J. 1980. Osady i struktury peryglacjalne z plejstocenu okolic Bełchatowa. Przewodnik LIII, Zjazdu Polskiego Towarzystwa Geologicznego. Wydawnictwa Geologiczne, Waszawa: 322–325. |
| 179 | Piaski prof 1/061077 | No data | No data | No data | peat | Gd-777 | 21970 ± 810 | GPC | Goździk J. 1986. Czwartorzęd w regionie kopalnie węgla brunatnego, Bełchatów. II Zjazd Geografów Polskich, Łódź, 11 – 13 września, 1986. Przewodnik wycieczek: 109–114. (in Polish) |
| 180 | Widawka valley | No data | No data | No data | organic layer | Gd-5484 | 23600 ± 400 | GPC | Goździk, JS. 1995b. Vistulian sediments in the Bełchatów open cast mine, Central Poland. Qualernary Studies in Poland 13: 13–26. |
| 181 | organic layer | Gd-6003 | 24200 ± 650 | GPC | |||||
| 182 | organic layer | Gd-5485 | 26900 ± 500 | GPC |
| No. | Site name / Sample name | Long E | Lat N | Alt. [m a.s.l.] | Dated material | Lab. Code | Luminescence age [BP] | Technique TL/OSL | References |
|---|---|---|---|---|---|---|---|---|---|
| 1 | Chałupki k/Przedborza | 51.07 | 19.88 | no data | sand (fluvial) | PIG238 | 24000 ± 5000 | OSL | Wieczorek D, Stoiński A, Zabielski R, 2019. Objaśnienia do Szczegółowej mapy geologicznej Polski w skali 1:50 000, arkusz Przedbórz (775). (Explanations to the Detailed Geological Map of Poland in the scale 1:50,000, Przedbórz sheet (775)). (in Polish) NAG, PIG-PIB Warszawa (electronical version). |
| 2 | sand (fluvial) | PIG237 | 24000 ± 6000 | OSL | |||||
| 3 | sand (fluvial) | PIG239 | 26000 ± 5000 | OSL | |||||
| 4 | Koźmin | 18.67 | 50.08 | 97 | sand (fluvial) | GdTL-1410 | 12780 ± 620 | OSL | Dzieduszyńska D., Petera-Zganiacz J., Twardy J., Kittel P., Moska P., Adamiec G., 2014b – Optical dating and sedimentary record from the terrace depositional profile of the Warta River (Central Poland). Geochronometria, 41(4); 361–368 |
| 5 | sand (fluvial) | GdTL-1412 | 13130 ± 730 | OSL | |||||
| 6 | sand (fluvial) | GdTL-1413 | 13140 ± 920 | OSL | |||||
| 7 | sand (fluvial) | GdTL-1516 | 13690 ± 680 | OSL | |||||
| 8 | 52.09 | sand (fluvial) | GdTL 925 | 13900±640 | OSL | ||||
| 9 | 50.08 | sand (fluvial) | GdTL-1515 | 14310 ± 660 | OSL | ||||
| 10 | sand (fluvial) | GdTL-1517 | 14330 ± 740 | OSL | |||||
| 11 | 52.09 | sand (fluvial) | GdTL 924 | 31000 ± 1600 | OSL | Petera-Zganiacz J, Adamiec G. 2010. The age of the Warta river valley deposits based on 14C, TL, OSL dating methods (Kotlina Kolska, Middle Poland). 10th International Conference “Methods of Absolute Chronology”. 22–25 April 2010, Gliwice, Poland: 112. | |||
| 12 | sand (fluvial) | GdTL 923 | 31600 ± 1300 | OSL | |||||
| 13 | 52.08 | sand (fluvial) | GdTL 987 | 33600 ± 1700 | OSL | ||||
| 14 | 52.09 | sand (fluvial) | GdTL 922 | 37300 ± 1700 | OSL | ||||
| 15 | Kolonia Bechcice | no data | no data | no data | sand (fluvial) | GW-1126 | 16000 ± 2400 | TL | Kittel P. 2012. Budowa i ewolucja doliny Neru w rejonie stanowiska Lutomiersk-Koziówki w świetle badań geoarcheologicznych. Acta Geographica Lodziensia 100:113–133. (in Polish, summary in English) |
| 16 | sand (fluvial) | GW 1125 | 16100 ± 2400 | TL | |||||
| 17 | sand (fluvial) | GW-1124 | 19400 ± 2900 | TL | |||||
| 18 | sand (fluvial) | GW-0802 | 23600 ±3500 | TL | |||||
| 19 | sand (fluvial) | GW-0801 | 26600 ± 4000 | TL | |||||
| 20 | Rozprza | 19.67 | 51.3 | 183 | sand (fluvial) | UJK-OSL-72 | 24700 ± 3700 | OSL | Sikora J, Kittel P, Frączek M, Głąb Z, Golyeva A, Mueller-Bieniek A, Schneeweiß J, Tomczyńska Z, Wasylikowa K, Wiedner K. 2019. A palaeoenvironmental reconstruction of the rampart construction of the medieval ring-fort in Rozprza, Central Poland. Archaeological and Anthropological Sciences 11:4187–4219. |
| 21 | Szynkielew | no data | no data | no data | sand (fluvial) | no data | 19900±3000 | TL | Kittel P., 2016. Badania geoarcheologiczne pokrywy stokowej na stanowisku archeologicznym Szynkielew 11, gm. Pabianice. Acta Universitatis Lodziensis. Folia Geographica Physica 15: 25–35. (in Polish, summary in English) |
| 22 | sand (fluvial) | 20600±3100 | TL | ||||||
| 23 | Warenka | 18.62 | 52.04 | 105 | sand (fluvial) | GdTL-3440 | 17400 ± 1400 | OSL | unpublished |
| 24 | 18.62 | 52.04 | 105 | sand (fluvial) | GdTL-3529 | 24100 ± 1600 | OSL | ||
| 25 | 18.62 | 52.04 | 105 | sand (fluvial) | GdTL-3530 | 24900 ± 1500 | OSL | ||
| 26 | 18.61 | 52.03 | 105 | sand (fluvial) | GdTL-3177 | 26700 ± 1500 | OSL | ||
| 27 | 18.62 | 52.04 | 105 | sand (fluvial) | GdTL-3531 | 26700 ± 1700 | OSL | ||
| 28 | Warenka | 18.62 | 52.04 | 105 | sand (fluvial) | GdTL-3532 | 29300 ± 2000 | OSL | unpublished |
| 29 | 18.61 | 52.03 | 105 | sand (fluvial) | GdTL-3178 | 30300 ± 1700 | OSL | ||
| 30 | Swędów | 51.92 | 19.53 | 145 | sand (fluvial) | GdTL-3140 | 18900±1200 | OSL | Michczyńska D.J., Dzieduszyńska D.A., Petera-Zganiacz J., Wachecka-Kotkowska L., Krzyszkowski D., Wieczorek D., Ludwikowska-Kędzia M., Gębica P. Starkel L., 2022. Climatic oscillations during MIS 3-2 recorded in sets of 14C and OSL dates - a study based on data from Poland. Radiocarbon 64(6): 1373–1386. |
| 31 | sand (fluvial) | GdTL-3141 | 20900±1200 | OSL | |||||
| 32 | no data | no data | no data | sand (fluvial) | GdTL-3142 | 13600±540 | OSL | ||
| 33 | sand (fluvial) | GdTL-3137 | 19800±1300 | OSL | |||||
| 34 | Lutomiersk Koziówki | 19.22 | 51.75 | 152.5 | sand (fluvial) | KIE-603 | 22900 ± 3400 | TL | Kittel P. 2012. Budowa i ewolucja doliny Neru w rejonie stanowiska Lutomiersk-Koziówki w świetle badań geoarcheologicznych. Acta Geographica Lodziensia 100:113–133. (in Polish, summary in English) |
| 35 | sand (fluvial) | KIE-601 | 23100 ± 3500 | TL | |||||
| 36 | sand (fluvial) | KIE-604 | 23300 ± 3500 | TL | |||||
| 37 | Restarzew Środkowy | no data | no data | no data | sand (fluvial) | PIG364 | 12400±2800 | OSL | Bieńko K., Cieślak A., Wieczorek D., 2022. Objaśnienia do Szczegółowej mapy geologicznej Polski w skali 1:50 000, arkusz Zelów (699) (Explanations to the Detailed Geological Map of Poland in the scale 1:50,000, Zelów sheet (699)). (in Polish) NAG, PIG-PIB Warszawa (electronical version). |
| 38 | Dubie | no data | no data | no data | sand (fluvial) | PIG363 | 14600±2500 | OSL |