
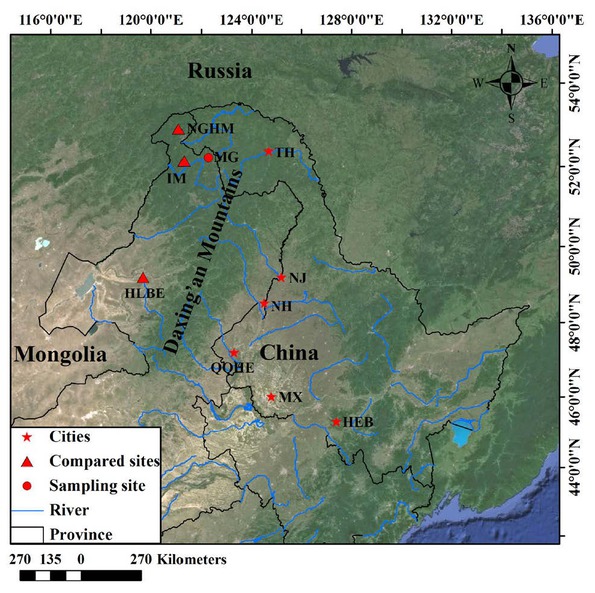
Fig. 1
Location of the sampling site (MG). Northern Greater Higgnan Mountains (HGHM) (Zhang et al., 2013), Inner Mongolia (IM) (Zhang et al., 2011) and Hulunbuir (HLBE) (Shi et al., 2015) were u asterisk sed for comparison. The cities TH(Tahe), NJ (Nenjiang), NH(Nehe), QQHE(Qiqihar), MX(Maoxing) and HEB (Haerbin) were marked with asterisk.
Table 1
Statistical features of STD chronology.
| Statistic | STD |
|---|---|
| Mean sensitivity | 0.23 |
| Standard deviation | 0.26 |
| First order autocorrelation | 0.60 |
| Mean correlation within trees | 0.60 |
| Variance in first eigenvector (%) | 42.0 |
| Signal-to-noise ratio (SNR) | 27.6 |
| Mean ring width (mm) | 1.16 |
| Expressed population signal (EPS) | 0.91 |
| First year where SSS>0.85 (number of trees) | 1880 (3) |
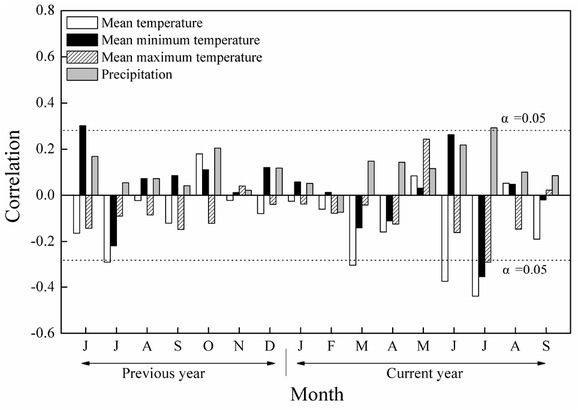
Fig. 2
Correlation coefficients between the monthly climate variables and tree-ring indices for 1959–2014.
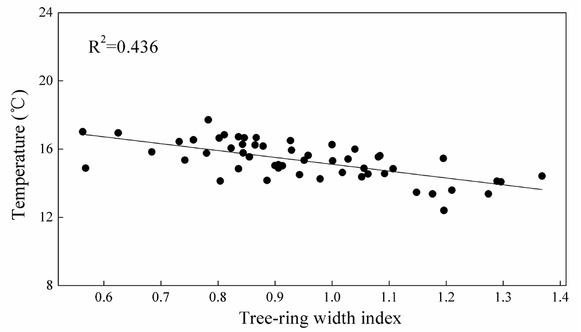
Fig. 3
Scatter plot of the tree-ring width index and the averaged Tmean6–7 from June to July (1959–2014).
Table 2
Statistics of calibration and verification test for the common period of 1959–2014.
| Calibration | R | R2 | Verification | R | Reduction of error | Coefficient of efficiency | Sign test | Product means test |
|---|---|---|---|---|---|---|---|---|
| Whole section 1959-2014 | 0.66 a | 0.436 a | ||||||
| Front section 1959-1983 | 0.53 a | 0.28 a | Back section 1984–2014 | 0.71a | 0.61a | 0.35a | (26+ /5-) a | 2.8a |
| Back section 1984-2014 | 0.71 a | 0.50 a | Front section 1959–1984 | 0.53a | 0.61a | 0.43a | (21+ / 5-) a | 3.3a |
Table 3
Rank of years of warm/cold reconstructed mean temperature from June to July (Tmean6–7).
| Rank | Warm year | Tmax6-7 RECHT89 (°C) | Cold year | Tmax6-7 |
|---|---|---|---|---|
| 1 | 2008 | 17.28 | 1888 | 12.66 |
| 2 | 2003 | 16.85 | 1893 | 13.21 |
| 3 | 2012 | 16.67 | 1902 | 13.22 |
| 4 | 1994 | 16.65 | 1932 | 13.33 |
| 5 | 2014 | 16.59 | 1898 | 13.42 |
| 6 | 1954 | 16.46 | 1880 | 13.60 |
| 7 | 2011 | 16.43 | 1991 | 13.62 |
| 8 | 2004 | 16.38 | 1934 | 13.72 |
| 9 | 1886 | 16.36 | 1882 | 13.73 |
| 10 | 1885 | 16.28 | 1892 | 13.81 |
| 11 | 1975 | 16.26 | 1978 | 13.91 |
| 12 | 1967 | 16.15 | 1891 | 13.94 |
| 13 | 1919 | 16.14 | 1895 | 14.04 |
| 14 | 1883 | 16.13 | 1958 | 14.05 |
| 15 | 2001 | 16.11 | 1890 | 14.05 |
| 16 | 2005 | 16.09 | 1927 | 14.10 |
| 17 | 1939 | 16.07 | 1900 | 14.15 |
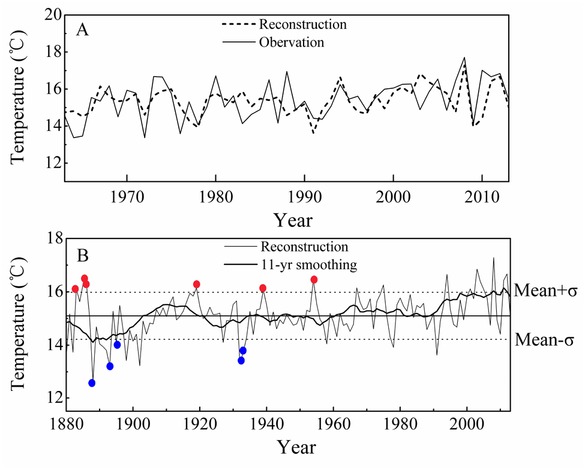
Fig. 4
(A) Comparison of actual and reconstructed Tmean6–7 from 1959 to 2014 and (B) the reconstructed June-July temperature series since 1880. The smoothed line indicates the 11-year moving average, and red dots represent drought events, blue dots represent flood events.
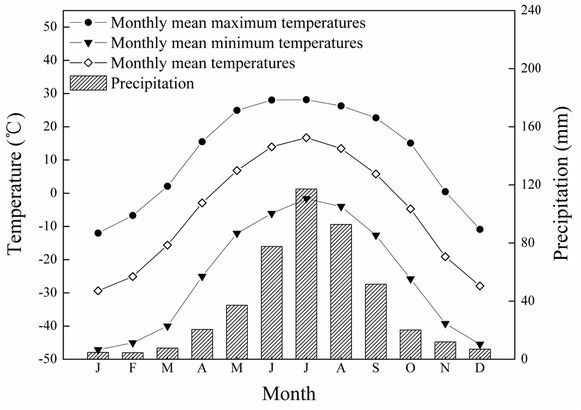
Fig. 5
Mean monthly temperature (in °C) and total precipitation (in mm) at Mangui (MG) in the northern Daxing’an Mountains (AD 1959–2014) based on interpolated values from 164 climate stations.
Table 4
The dry/wet years of the reconstructed temperature for the Mangui (MG) region in comparison with historical documents (Wen and Sun, 2007).
| Dry and wet years | Short description of weather or related events |
|---|---|
| 1883 | Heilongjiang: Severe drought occurred in 27 regions in summer, such as Qiqihar, Haerbin, Moergen (now Nenjiang), Maoxing, Ningguta, etc. |
| 1885 | Heilongjiang: Drought occurred in summer, such as Heilongjiang city, Moergen (now Nenjiang), Qiqihar, Sanxing (now Yilan), Ningguta, etc. |
| 1886 | Heilongjiang: Drought occurred in summer, such as Heilongjiang City, Qiqihar, Moergen (now Nenjiang), Maoxing, Ningguta, etc. |
| 1919 | Heilongjiang: Drought occurred in summer, such as Haerbin, Tonghe, Qiqihar, Xibuteha (now Zhalantun), Nehe, Anda, Zhaozhou, etc. |
| 1939 | Heilongjiang: Severe drought occurred in Jiamusi in summer. |
| 1954 | Heilongjiang: Drought occurred in summer, such as, Nenjiang, Shangzhi, Tieli, Suiling, Hailun, Nenjiang, etc. |
| 1888 | Heilongjiang: Flooding disaster occurred in 27 regions in summer, such as Qiqihar, Moergen (now Nenjiang), Maoxing, etc. |
| 1892 | Heilongjiang: Flooding disaster occurred in 20 regions in summer, such as Qiqihar, Maoxing, Wuchang, etc. |
| 1895 | Heilongjiang: Flooding disaster occurred in summer, such as Heilongjiang City, Hulan, Boduna, Haerbin, etc. |
| 1932 | Heilongjiang: Severe flooding disaster occurred in summer, such as Zhanlantun, Qiqihar, Haerbin, Tahe, Zhaodong, Dongning, etc. |
| 1934 | Heilongjiang: Flooding disaster occurred in summer, such as Anda, Qiqihar, Haerbin, Nenjiang, Hulan, etc. |
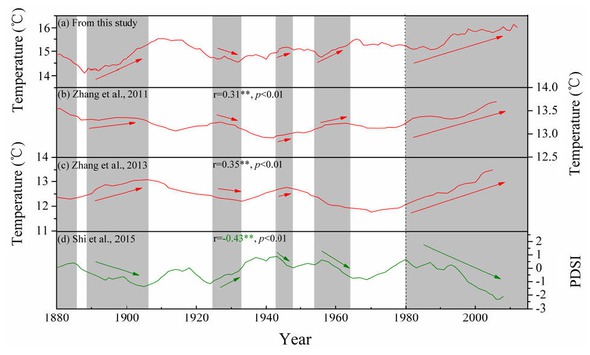
Fig. 6
Comparison of June–July mean temperature reconstruction in MG with other tree-ring proxies from surrounding areas: (a) June–July maximum temperature reconstruction in this study; (b) May– September temperature reconstruction in Inner Mongolia (Zhang et al., 2011); (c) May–October temperature reconstruction in northern Greater Higgnan Mountains, China (Zhang et al., 2013); (d) Annual PDSI reconstruction from tree-ring of Mongolian pine in Hulunbuir, Northeast China (Shi et al., 2015). The gray areas mean the common warm/cold periods.
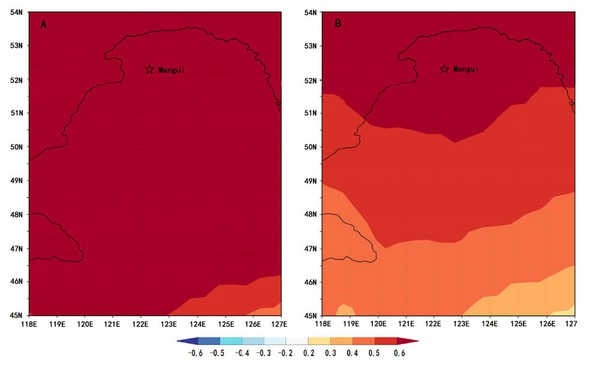
Fig. 7
Spatial correlation of (A) instrumental and (B) reconstructed June–July temperatures with regional gridded June–July temperatures during the period 1959–2014. The asterisk mark in is the sampling position.
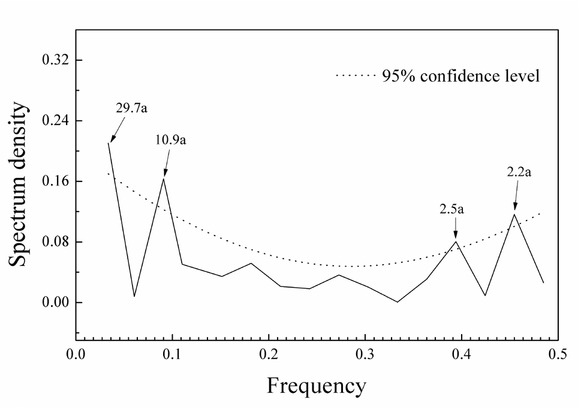
Fig. 8
The power spectrum analyses of reconstructed June–July mean temperature.
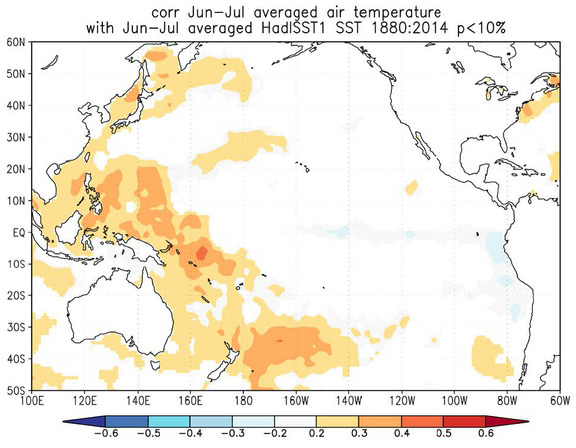
Fig. 9
Spatial correlation for the reconstruction with June–July averaged HadlSST1 SST during the period of 1880–2014.