
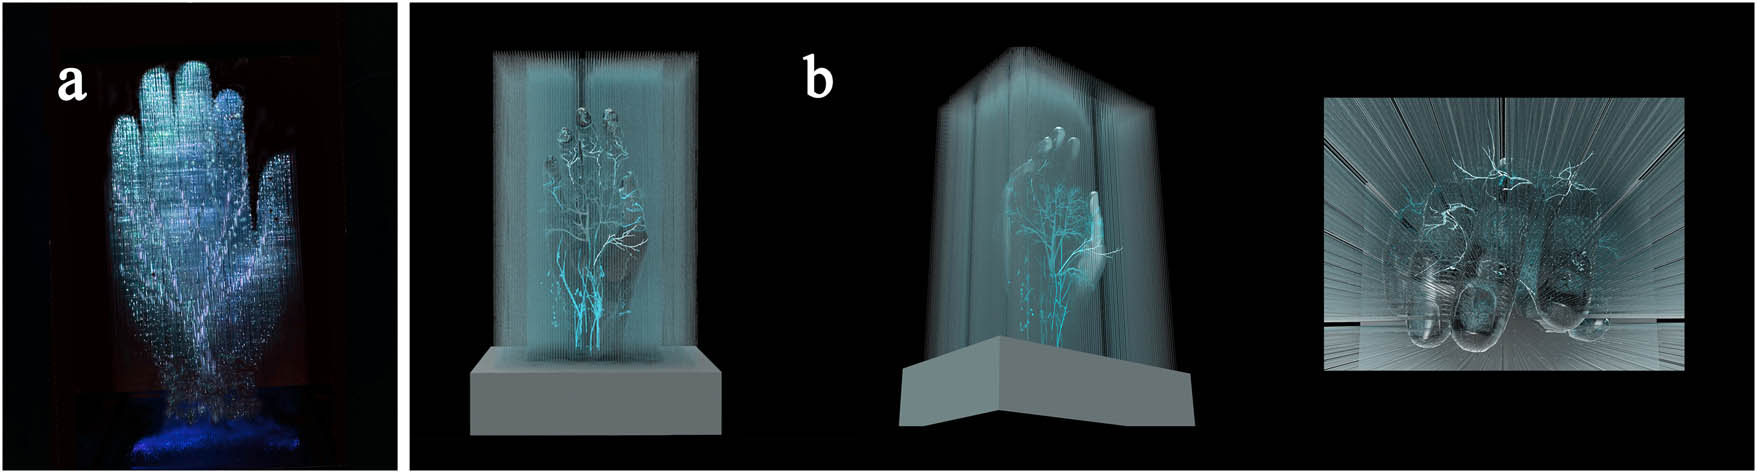
Figure 1
The physical prototype and its 3D model: (a) Image of the physical prototype; (b) 3D model of the prototype.
Source: Authors’ contribution.
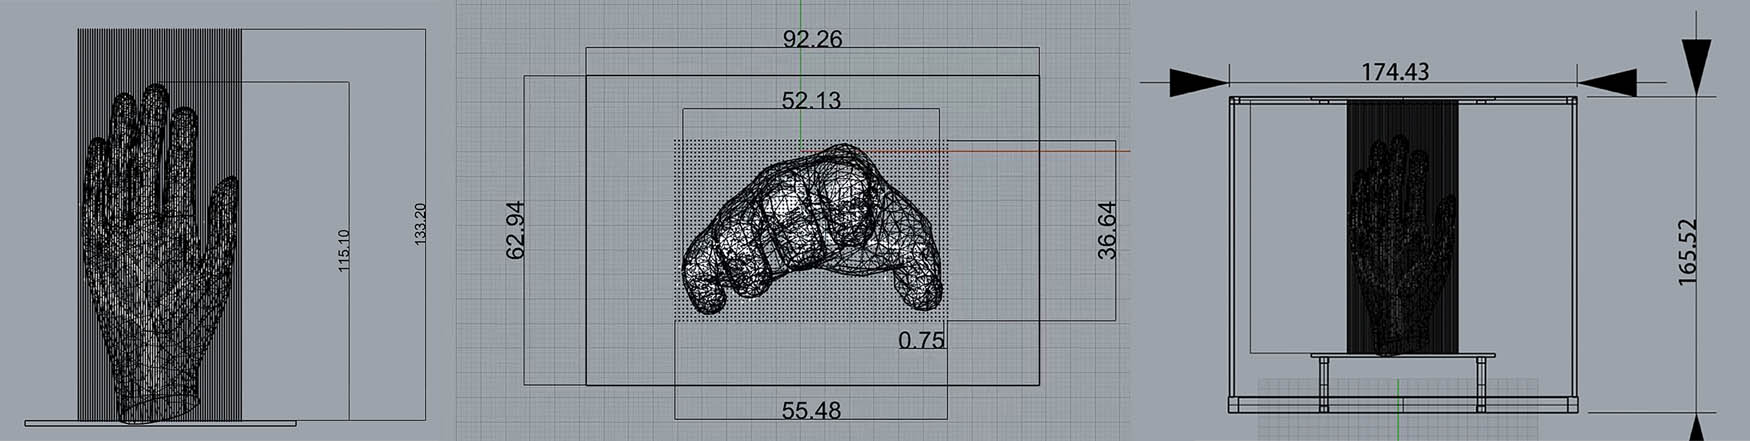
Figure 2
Multi-view drawing of the prototype.
Source: Authors’ contribution.
Table 1
Optical fiber processing experiment
| Sample code | Light source color | Diameter (mm) | Processing technology | Process | Daytime photos | Nighttime photos |
|---|---|---|---|---|---|---|
| A | Red | 0.25 | Normal state | Connect light source on one end |

|

|
| B | Red | 0.25, 0.5 | Coil | Coil optical fiber and connect light source at one end |

|

|
| C | Red | 0.5 | Engraved | Cut around fiber skin with a scissor or a utility knife |

|

|
| D | Red | 0.25, 0.5 | Rub | Rub fiber skin with sandpaper |

|

|
| E | Red | 0.5 | Bend | Bend anywhere on the fiber |

|

|
| F | Red | 0.5 | Turn on the light source at both ends | Connect the light source at both ends of the optical fiber |

|

|
| G | Red | 0.5 | Bend and coil | Coil after bending anywhere on the optical fiber |

|

|
| H | Red | 0.25 | Embroider | Embroidery on black fabric with optical fiber |

|

|
| I | Red | 0.75 | Rub | Lay optical fiber on tape flatly, make a pattern by rubbing with sandpaper, and connect the light source at one end |

|

|
Source: Authors’ contribution.
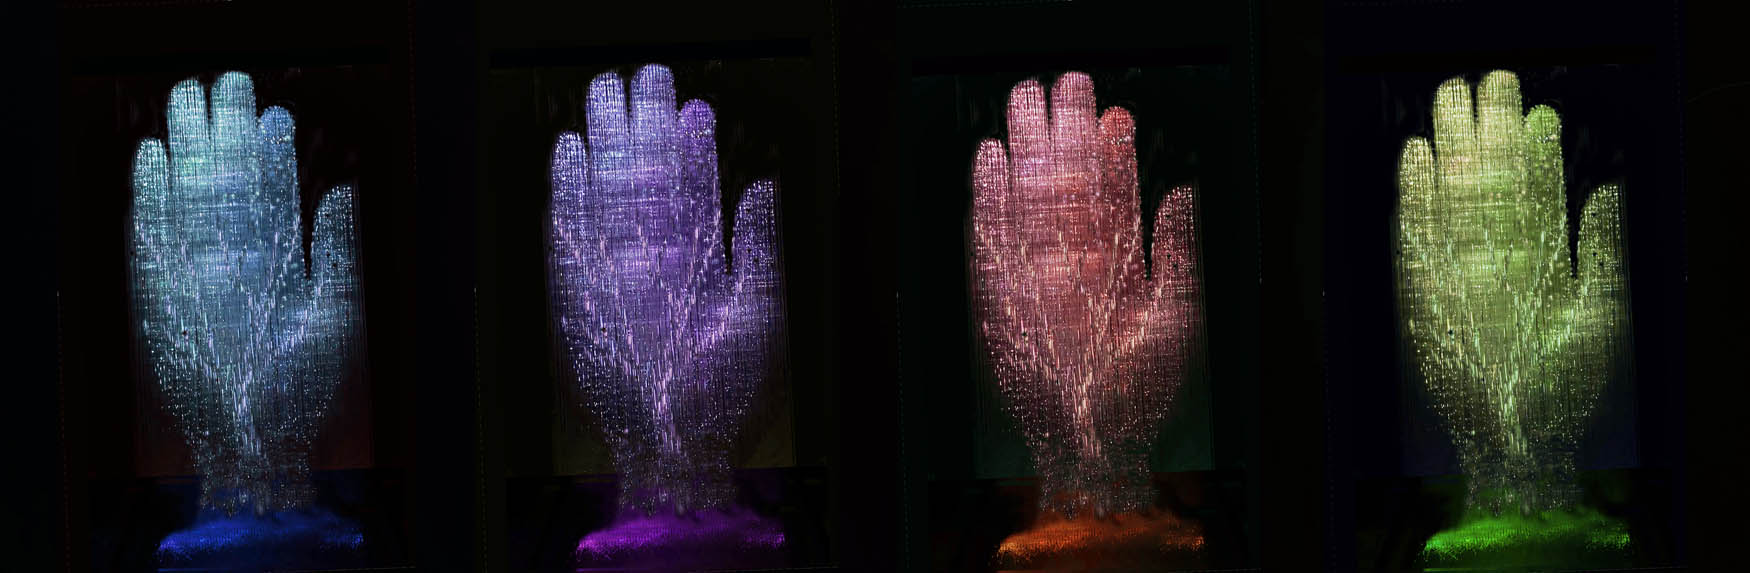
Figure 3
Visual effects under different colored lights.
Source: Authors’ contribution.
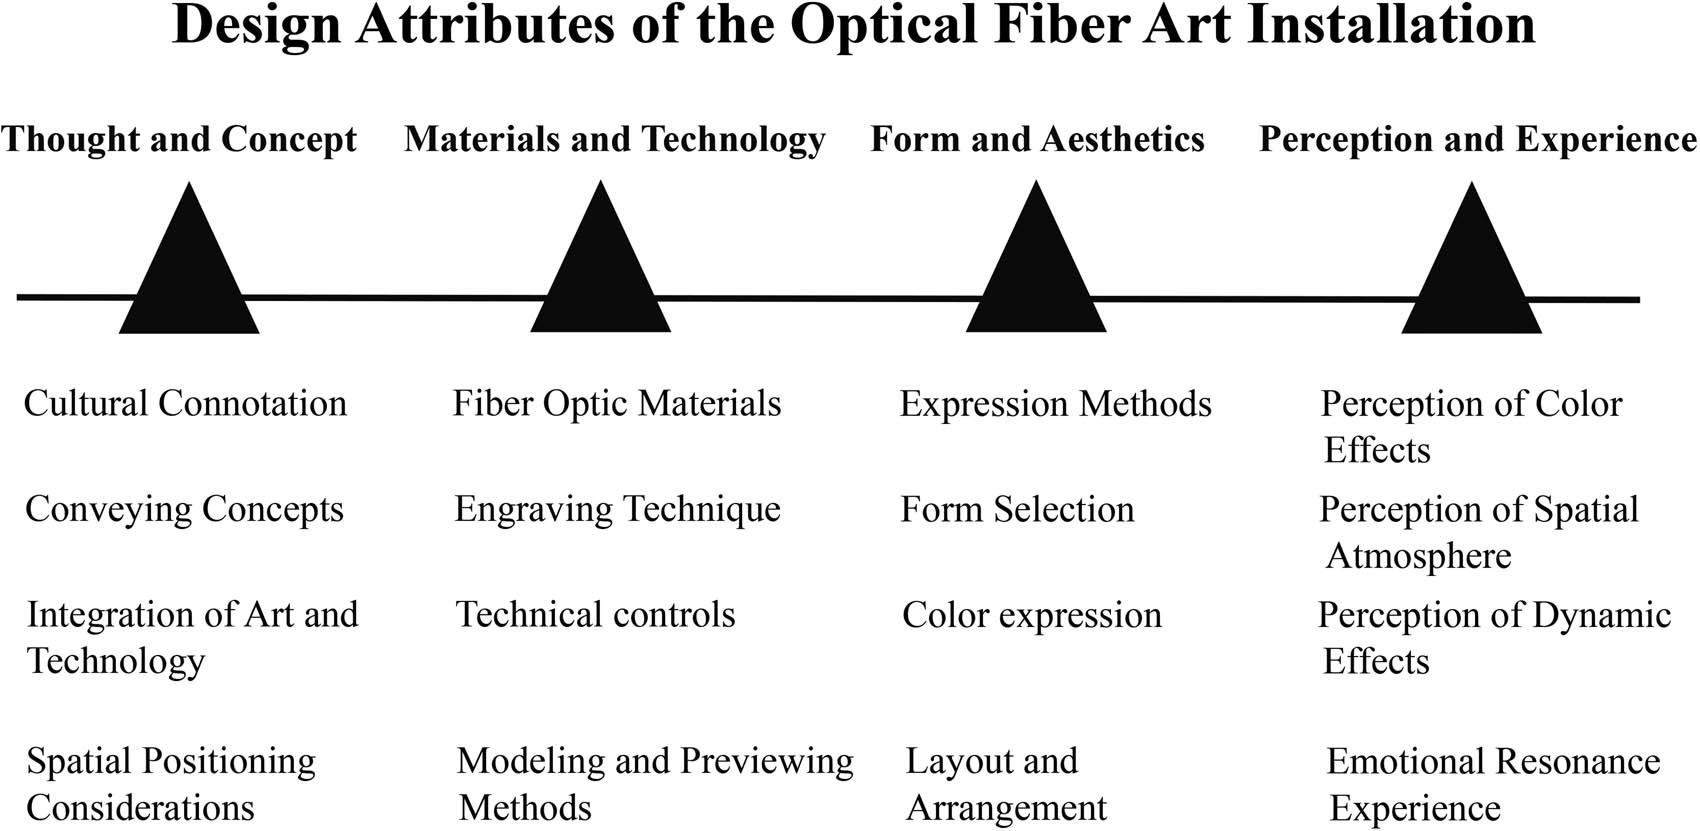
Figure 4
Design attributes of the optical fiber art installation.
Source: Authors’ contribution.
Table 2
Demographic characteristics of respondents (N = 103)
| Demographic dimension | Category | Number (n) | Proportion (%) |
|---|---|---|---|
| Gender | Male | 59 | 57.3 |
| Female | 44 | 42.7 | |
| Age | 18∼25 Years | 28 | 27.2 |
| 26∼30 Years | 35 | 33.98 | |
| 31∼40 Years | 24 | 23.3 | |
| >40 Years | 16 | 15.52 | |
| Education | Senior high school and below | 19 | 18.45 |
| College degree and above | 84 | 81.55 | |
| Occupation | Marketing/Sales/Commerce | 16 | 15.53 |
| Enterprise employee | 32 | 31 | |
| Student | 25 | 24.3 | |
| Freelancer | 18 | 17.5 | |
| Others (Teacher/Medical, etc.) | 12 | 11.67 |
Source: Authors’ contribution.
Table 3
Summary of KANO Model analysis results
| No. | Features/Services | M | O | A | I | R | Q | Result |
|---|---|---|---|---|---|---|---|---|
| 1 | Views on the optical fiber art installation | 20.39% | 9.71% | 49.51% | 20.39% | 0% | 0% | A |
| 2 | Cultural connotations | 0% | 0% | 0% | 65.05% | 34.95% | 0% | I |
| 3 | Conveying concepts | 0% | 0% | 0% | 11.65% | 88.35% | 0% | R |
| 4 | Integration of art and technology | 20.39% | 43.69% | 19.42% | 16.5% | 0% | 0% | O |
| 5 | Spatial positioning considerations | 40.78% | 6.8% | 35.92% | 16.5% | 0% | 0% | M |
| 6 | Fiber optic materials | 26.21% | 36.89% | 17.48% | 19.42% | 0% | 0% | O |
| 7 | Engraving technique | 58.25% | 9.71% | 14.56% | 17.48% | 0% | 0% | M |
| 8 | Technical controls | 0% | 0% | 0% | 45.63% | 54.37% | 0% | R |
| 9 | Modeling and previewing | 21.36% | 16.5% | 50.49% | 11.65% | 0% | 0% | A |
| 10 | Expressions methods | 0% | 0% | 0% | 19.42% | 80.58% | 0% | R |
| 11 | Form selection | 54.37% | 12.62% | 9.71% | 23.3% | 0% | 0% | M |
| 12 | Color expression | 18.45% | 1.94% | 17.48% | 62.14% | 0% | 0% | I |
| 13 | Layout and arrangement | 23.3% | 33.01% | 27.18% | 16.5% | 0% | 0% | 0 |
| 14 | Perception of color effects | 25.24% | 9.71% | 15.53% | 49.51% | 0% | 0% | I |
| 15 | Perception of spatial atmosphere | 10.68% | 7.77% | 49.51% | 32.04% | 0% | 0% | A |
| 16 | Perception of dynamic effects | 57.28% | 9.71% | 13.59% | 19.42% | 0% | 0% | M |
| 17 | Emotional resonance experience | 51.56% | 8.74% | 17.48% | 22.33% | 0% | 0% | M |
Result Classification:.
A: Attractive attributes; O: One-dimensional attributes; M: Must-be attributes; I: Indifferent attributes; R: Reverse attributes; Q: Questionable attributes.
Source: Authors’ contribution.
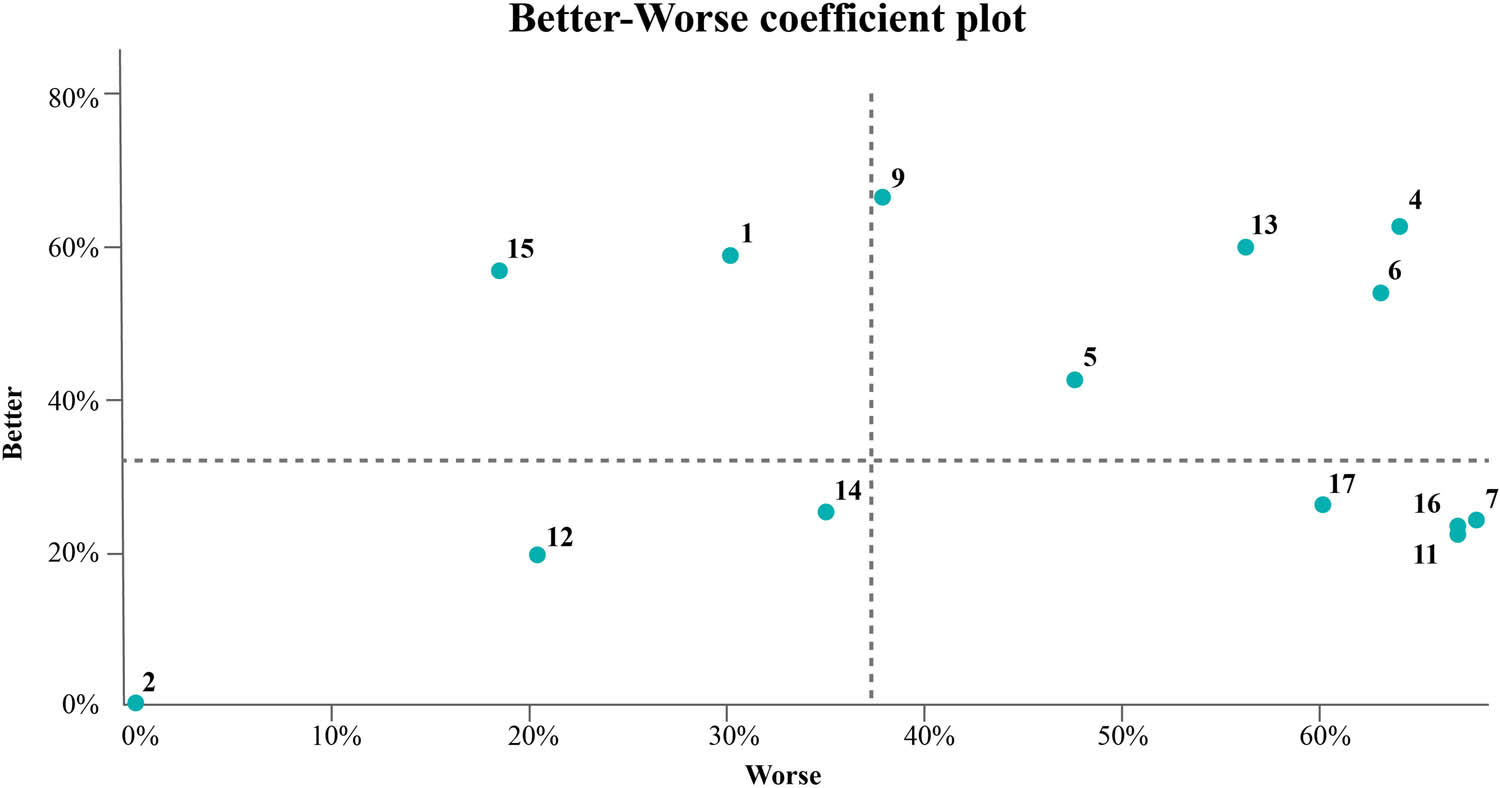
Figure 5
The Better–Worse coefficient plot. Note: This figure is based on the Kano model results and plots the Better and Worse values calculated using equations (1) and (2) from the paper. Each point in the figure represents one design attribute. The Y-axis corresponds to the Better value, while the X-axis corresponds to the absolute value of the Worse value. Attributes are mapped onto a two-dimensional coordinate system according to their coefficient profiles and are divided into four quadrants: Quadrant I represents One-dimensional attributes (high Better, high |Worse|); Quadrant II represents Attractive attributes (high Better, low |Worse|); Quadrant III represents Indifferent attributes (low Better, low |Worse|); and Quadrant IV represents Must-be attributes (low Better, high |Worse|). This visualization intuitively illustrates the non-linear impact characteristics of design attributes on user satisfaction.
Source: Authors’ contribution.
Table 4
Sensitivity Coefficients and Bootstrap 95% CIs for Design Attributes
| No. | Features/Services | Better | Worse | ω | 95% CI Lower Bound | 95% CI Upper Bound | Results | Sort |
|---|---|---|---|---|---|---|---|---|
| 1 | Views on the optical fiber art installation | 59.22% | −30.1% | 0.664 | 0.612 | 0.715 | A | 8 |
| 2 | Cultural connotations | 0% | 0% | 0 | 0 | 0 | I | 14 |
| 3 | Convey ideas | 0% | 0% | 0 | 0 | 0 | R | / |
| 4 | Art and technology merge ideas | 63.11% | −64.08% | 0.899 | 0.861 | 0.934 | O | 1 |
| 5 | Spatial positioning thinking | 42.72% | −47.57% | 0.639 | 0.588 | 0.690 | O | 10 |
| 6 | Fiber optic materials | 54.37% | −63.11% | 0.833 | 0.790 | 0.875 | O | 2 |
| 7 | Engraving technique | 24.27% | −67.96% | 0.722 | 0.670 | 0.773 | M | 5 |
| 8 | Technical controls | 0% | 0% | 0 | 0 | 0 | R | / |
| 9 | Model the form of a production preview | 66.99% | 37.86% | 0.769 | 0.720 | 0.817 | O | 4 |
| 10 | Expressions | 0% | 0% | 0 | 0 | 0 | R | / |
| 11 | Pattern selection | 22.33% | −66.99% | 0.706 | 0.654 | 0.757 | M | 7 |
| 12 | Color expression | 19.42% | −20.39% | 0.282 | 0.241 | 0.325 | I | 13 |
| 13 | Layout arrangement | 60.19% | −56.31% | 0.824 | 0.781 | 0.866 | O | 3 |
| 14 | Color effect perception | 25.24% | −34.95% | 0.431 | 0.378 | 0.483 | I | 12 |
| 15 | Spatial atmosphere perception | 57.28% | −18.45% | 0.602 | 0.550 | 0.653 | A | 11 |
| 16 | Dynamic effect perception | 23.3% | −66.99% | 0.709 | 0.657 | 0.760 | M | 6 |
| 17 | Emotional resonance experience | 26.21% | −60.19% | 0.656 | 0.605 | 0.706 | M | 9 |
Note: Bootstrap resampling (1,000 iterations) was used to calculate confidence intervals (CIs). Values for No. 2, 3, 8, and 10 are 0 because these attributes are classified as Indifferent (I) or Reverse (R) needs, with no valid Better–Worse coefficient values for sensitivity calculation.
Source: Authors’ contribution.