
1. Introduction
1.1. The Development of Smart Textile Installations
The ongoing advancement of technology has facilitated the pervasive integration of intelligent trends into various aspects of daily life, with smart textile installations emerging as a representative embodiment of this progression. In recent years, remarkable progress has been made particularly in the domains of perceptual capabilities and immersive spatial experience design. This trajectory is illustrated by Mlakar et al.’s The Sound of Textile [1], an interactive system using seven sensor-embedded textile strips to translate touch into sound, thereby establishing a new paradigm for sensory experience in smart textiles. Jonsson and Kooroshnia investigated the integration of dichroic filters with textile weaving techniques, creating dynamic spatial experiences through variations in light and color, which reveals the potential of textile materials in shaping perception and spatial emotion [2]. Huang and Romano’s Coral Morph employs transformable textiles and heart-rate visualization for emotional regulation, confirming users’ emotional connection [3]. From the perspective of spatial relationship theory, Küre demonstrated the narrative potential of textiles as an artistic medium [4]. Collectively, these studies indicate that smart textile installations are transitioning from a focus on technical implementation toward emotionally resonant and human-centered interaction design.
The advancements in interactive smart textile installations are largely attributed to continuous breakthroughs in technology and materials [5]. Technically, common interactive creations primarily follow a “sensing-acquisition–control-response” pathway: data on audience behavior or environmental conditions are captured by embedded sensors such as infrared, piezoresistive, and photosensitive sensors [6], and are then processed and output in real-time by open-source hardware controllers like Arduino and Raspberry Pi. The widespread adoption of this technical approach benefits substantially from the low-cost and accessible hardware foundation provided by such open-source platforms [7]. Meanwhile, AI technology is redefining interactive possibilities for artistic installations by algorithmically interpreting multimodal audience data [8]. In terms of textile innovation, smart fibrous materials – including shape-memory polymer fibers, photochromic fibers, thermochromic fibers, and optical fibers [9] – are increasingly being incorporated into artistic installations through cross-disciplinary innovation. Optical fiber technology, in particular, provides unique sensing and decorative functions. Raji et al. systematically reviewed the sensing applications of plastic optical fibers (POF) in smart garments, emphasizing their potential for monitoring strain and temperature through parameters [10]. Selm et al. pioneered the study of integrated lighting and sensing designs in polymer optical fiber textiles, noting that textile structures impart lightweight and flexible characteristics to optical fibers [11]. Koyama et al. utilized heterogeneous core fibers blended with wool to develop plain-weave fabrics capable of monitoring subtle bending, successfully applying them to gesture recognition [12].
1.2. The Challenge of Design and Kano Model Application
However, the design-to-implementation process for smart textile installations faces significant challenges. Designers often struggle with interdisciplinary coordination between textile engineering, electronics, and interaction design, leading to misaligned creative visions and technical execution [13]. More critically, there lacks a systematic method to identify which design features truly enhance user satisfaction versus those that may be non-essential or even cause dissatisfaction [14]. This optimization dilemma becomes particularly acute in large-scale installations where post-completion modifications are costly [15]. The absence of scientifically grounded tools to prioritize design attributes based on user emotional response often forces designers to rely on intuition alone, resulting in unpredictable user reception and potential negative feedback [16].
This is where the Kano model offers a strategic solution. Developed by Professor Noriaki Kano, this framework analyzes how product attributes differentially impact satisfaction [17]. It posits a nonlinear relationship [18], classifying attributes into five types [19]: Must-be (basic expectations), One-dimensional (performance-proportional), Attractive (delighters), Indifferent (neutral), and Reverse (undesirable). The standard analysis involves three key steps: first, collecting paired user responses to both functional and dysfunctional formulations of each attribute; second, classifying each attribute into one of the five categories based on established response patterns; and third, calculating the Better and Worse coefficients to quantify their respective influence on satisfaction and dissatisfaction. This structured approach effectively transforms subjective user feedback into actionable design priorities [20].
While the Kano model has been extensively applied in product and service design, its utilization in the domain of smart textile installation design – particularly for obtaining early-stage feedback through physical prototypes – remains relatively unexplored. At the level of design research, this study contributes to and extends Kano theory in the following ways: (1) In contrast to Lin et al. [19], who applied the model for post-launch requirement validation and defect rectification of commercialized products, this research advances its application to the mid-design phase of prototype testing. This shift enables immediate, user feedback-driven design iteration, directly addressing the critical challenge of high post-implementation modification costs inherent to large-scale installations. (2) Unlike Shahin et al. [17], whose work focused on theoretical classification and extension of the Kano model, this study enhances its practical implementation. By employing a physical prototype as a concrete evaluation medium, it mitigates the user cognitive bias often associated with the abstract descriptions used in traditional Kano questionnaires. (3) The introduction of a sensitivity coefficient facilitates the quantitative prioritization of attributes. This provides a refined, data-driven basis for decision-making derived from Kano classifications, thereby overcoming the limitations of the traditional Better–Worse quadrant analysis. (4) Compared to studies that primarily focus on analyzing positive attributes [20], this work provides a systematic analytical dimension for handling negative user feedback and uncovering latent optimization potential through a thorough examination of Reverse and Indifferent needs.
1.3. Research Questions and Hypotheses
This study aims to provide a structured framework to overcome a critical challenge in smart textile installation design: the systematic translation of user expectations into design priorities.
Research Question 1 (RQ1): How can user feedback from a physical prototype be systematically translated into prioritized design attributes for a smart textile installation?
Hypothesis 1 (H1): The application of the Kano model, complemented by sensitivity coefficient analysis, will effectively categorize and rank design attributes, providing a clear, data-driven hierarchy for design optimization.
Research Question 2 (RQ2): To what extent can a prototype-driven optimization framework mitigate the key challenges of interdisciplinary coordination and post-implementation user dissatisfaction in smart textile installation projects?
Hypothesis 2 (H2): An optimization strategy prioritizing One-dimensional and Attractive attributes while rectifying shortcomings in Must-be and Reverse ones will foster interdisciplinary alignment and mitigate user dissatisfaction.
2. Materials and Methods
2.1. Physical Prototype Design as Experimental Case
This study adopted a case-based research approach to develop and validate an optimization framework for smart textile installations. A physical prototype of an optical fiber art installation (Figure 1a) served as the experimental subject, with the final version intended for deployment in the atrium of a large commercial plaza in Shenzhen, China. The design integrates the imagery of the Tree of Life and the Buddhist Abhaya mudra, utilizing optical fiber engraving technology to construct a three-dimensional form (Figure 1b). The prototype measures 55.48 cm (L) × 36.64 cm (W) × 115.1 cm (H) (Figure 2). It leverages the light-guiding properties of optical fibers and engraving techniques to achieve the visual presentation of the three-dimensional form and the creation of spatial atmosphere. A series of performance tests on fiber materials and processing techniques were conducted during the research process to identify the optimal technical solution for this design.
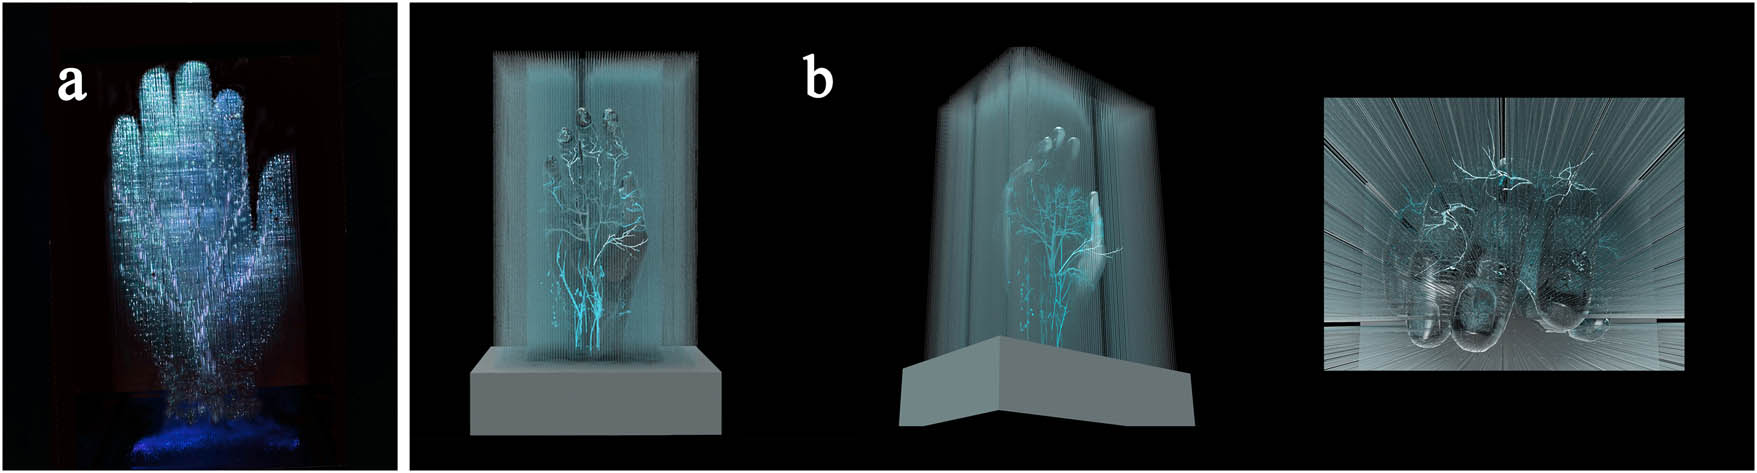
Figure 1
The physical prototype and its 3D model: (a) Image of the physical prototype; (b) 3D model of the prototype.
Source: Authors’ contribution.
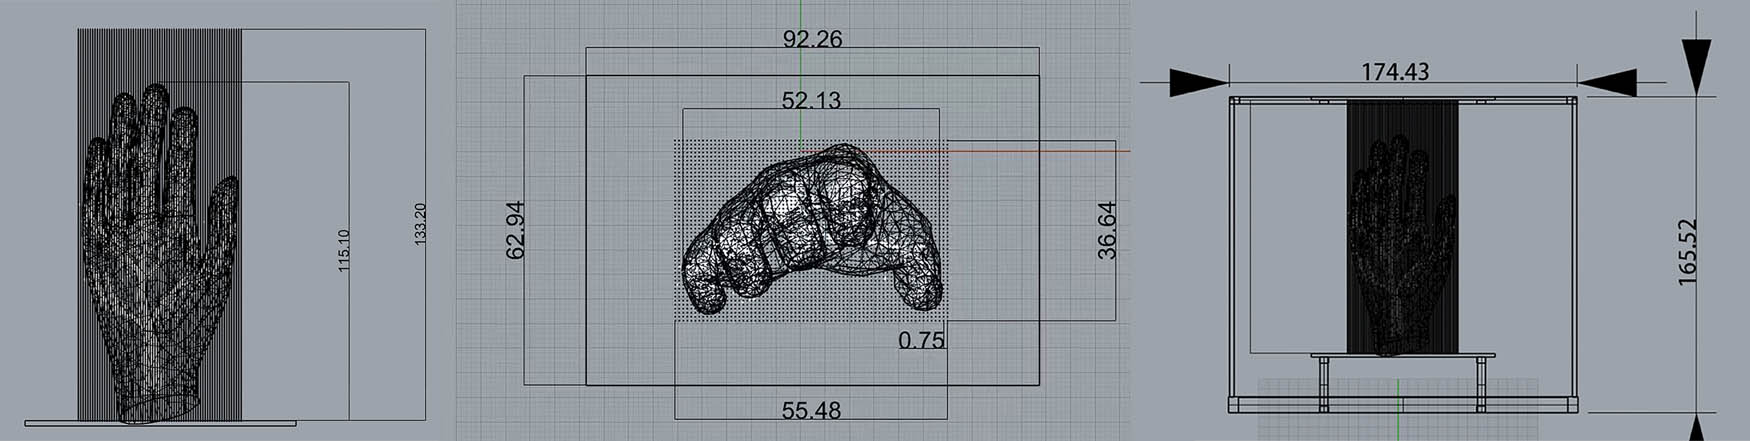
Figure 2
Multi-view drawing of the prototype.
Source: Authors’ contribution.
Optical fiber, often abbreviated as fiber optics, is a tool made from glass or plastic fibers that employs the principle of total internal reflection to transmit light. The light transmittance of optical fibers, also known as light loss, is a crucial parameter that impacts the visual effect of this design. Low light loss equates to better light-guiding performance and more abundant energy, whereas high light loss yields the opposite effect. Originally, experiments were conducted using both plastic optical fibers and glass optical fibers. The experimental comparison revealed that, over short distances, plastic optical fibers exhibit lower light loss than their glass counterparts. However, as the fiber length increases, plastic optical fibers experience higher light loss compared to glass optical fibers. Overall, within lengths of up to 160 cm, plastic optical fibers demonstrate lower light loss than glass optical fibers. Various plastic optical fibers of different diameters were selected and subjected to a series of process tests, yielding relevant index parameters (Table 1).
Table 1
Optical fiber processing experiment
| Sample code | Light source color | Diameter (mm) | Processing technology | Process | Daytime photos | Nighttime photos |
|---|---|---|---|---|---|---|
| A | Red | 0.25 | Normal state | Connect light source on one end |

|

|
| B | Red | 0.25, 0.5 | Coil | Coil optical fiber and connect light source at one end |

|

|
| C | Red | 0.5 | Engraved | Cut around fiber skin with a scissor or a utility knife |

|

|
| D | Red | 0.25, 0.5 | Rub | Rub fiber skin with sandpaper |

|

|
| E | Red | 0.5 | Bend | Bend anywhere on the fiber |

|

|
| F | Red | 0.5 | Turn on the light source at both ends | Connect the light source at both ends of the optical fiber |

|

|
| G | Red | 0.5 | Bend and coil | Coil after bending anywhere on the optical fiber |

|

|
| H | Red | 0.25 | Embroider | Embroidery on black fabric with optical fiber |

|

|
| I | Red | 0.75 | Rub | Lay optical fiber on tape flatly, make a pattern by rubbing with sandpaper, and connect the light source at one end |

|

|
Source: Authors’ contribution.
Following comparative experiments, samples C and I exhibited experimental results that closely aligned with the design expectations, prompting the selection of these two for further engraving and friction experiments. Through the engraving experiments, it was discovered that the size of the engravings, fiber diameter, fiber arrangement density, and light intensity of the light source all significantly impact the visual effect of the three-dimensional graphic. Comparatively, the 0.75-mm-diameter plastic optical fiber demonstrated suitable flexibility, ease of engraving, resistance to breakage, excellent light transmission performance, and an optimal engraving spacing of 7.5 mm.
The optical fibers are inserted into a coupling head connected to a 45-W LED light source. This setup efficiently captures the light source, ensuring optimal light-guiding effects. The light source is remotely controlled to adjust its brightness, color, and mode. To enrich the visual experience, a seven-color gradient mode cycles through blue, purple, red, orange, yellow, green, and cyan (Figure 3). As the colors transition, the light source’s brightness shifts from weak to strong, imparting a rhythmic and respiratory-like sensation. Upon completing the prototype fabrication and technical optimization, the physical prototype was finalized as the test sample for the Kano model.
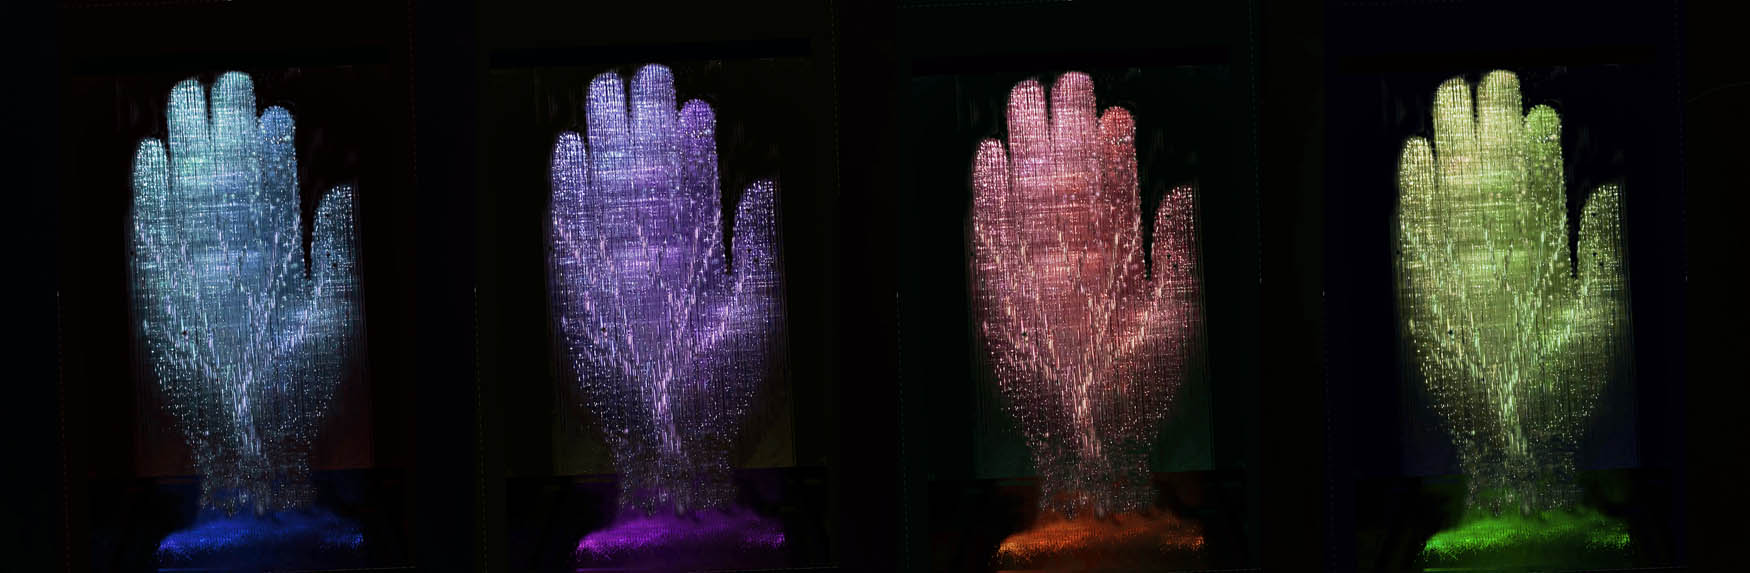
Figure 3
Visual effects under different colored lights.
Source: Authors’ contribution.
2.2. Kano model-based Research and Needs Attribute Analysis
It is important to acknowledge that while the Kano model provides robust demand classification, it is not without limitations. First, it captures static user preferences and is not sensitive to the dynamic evolution of long-term experience [18]. Second, its results can be susceptible to the phrasing of questionnaire items and respondents’ subjective interpretations. To address this, the iterative design logic of our framework inherently accommodates future expansion for tracking long-term user experience and dynamically adjusting design attributes. Furthermore, this study employs a physical prototype as the feedback medium, providing users with a tangible object for evaluation, which effectively mitigates the abstraction inherent in purely text-based questionnaires. Compared to methods requiring complex pairwise comparisons like the Analytic Hierarchy Process (AHP) or the construction of a House of Quality in Quality Function Deployment (QFD), the Kano model offers a more straightforward and efficient operational process. This makes it well-suited for the rapid collection and analysis of user feedback. The decision to employ a single core model also allows for a clearer validation of the effectiveness of the fundamental “prototype-to-Kano-analysis” pathway. Additionally, this study introduces a sensitivity coefficient to perform secondary quantification of the Kano model results, thereby compensating for its limitation in establishing fine-grained prioritization among attributes within the same category.
To systematically evaluate user perceptions of the prototype, the characteristics of this smart textile installation were categorized into four dimensions: “Thought and Concept,” “Materials and Technology,” “Form and Aesthetics,” and “Perception and Experience.” Subsequently, these dimensions were further broken down into 16 sub-features (Figure 4). A structured Kano questionnaire was developed based on these features, with satisfaction levels divided into five categories according to the “two-factor theory.” The survey included “like” and “dislike” options, with respondents choosing from five satisfaction levels ranging from “strongly like” to “strongly dislike” based on their personal preferences. Upon finalizing the questionnaire, it was distributed to potential users for evaluating the physical prototype. The collected data were then examined using the Kano model, classifying each feature of the design based on the five need attributes outlined by the Kano model.
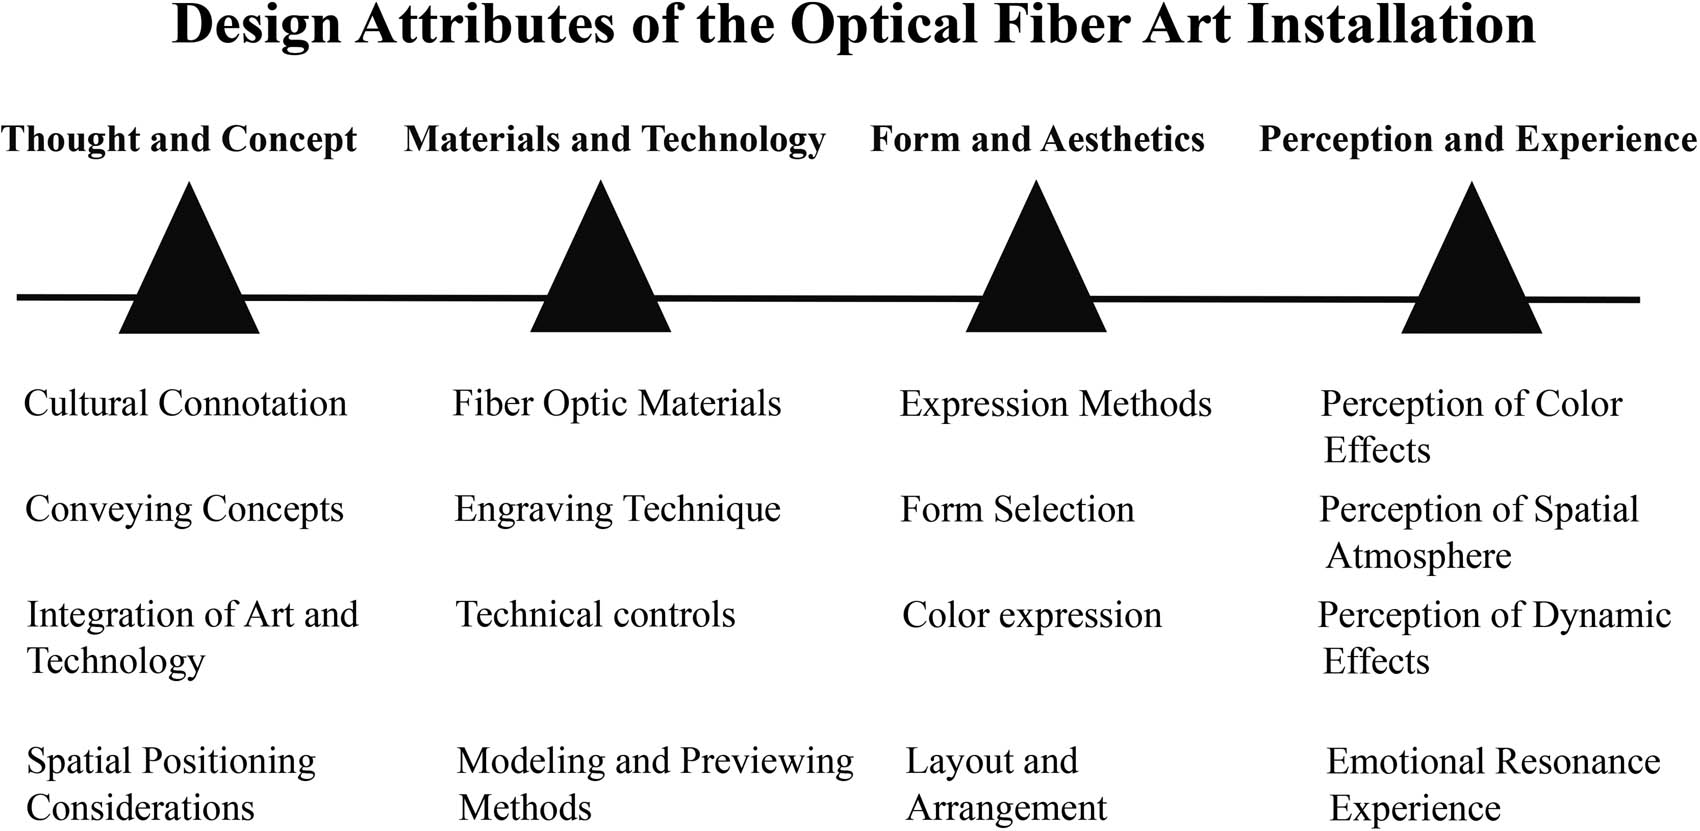
Figure 4
Design attributes of the optical fiber art installation.
Source: Authors’ contribution.
To quantify the nonlinear impact of design attributes on user satisfaction, this study employed the classic Kano model methodology to compute two key indices: the Better coefficient and the Worse coefficient [21]. The Better coefficient reflects the extent to which fully implementing an attribute can enhance user satisfaction, whereas the Worse coefficient indicates the degree of dissatisfaction that would arise if the attribute were absent. Mathematically, these coefficients are calculated as the proportions of positive responses (i.e., those classified as Attractive [A] or One-dimensional [O]) and negative responses (i.e., One-dimensional [O] or Must-be [M]), respectively, relative to the total number of valid responses. This approach converts qualitative preference data into comparable quantitative metrics, thereby providing a rigorous basis for categorizing user needs and prioritizing design features. The calculation formulas are as follows:
Satisfaction coefficient:
Dissatisfaction coefficient:
By calculating the Better–Worse coefficient, the preferences and satisfaction levels of users regarding various design feature options can be analyzed quantitatively. The Better value is used to evaluate user satisfaction with each feature of the smart textile installation, with a typical range between 0 and 1. Higher values of Better indicate greater user satisfaction. On the other hand, the Worse value ranges from −1 to 0, with larger absolute values of Worse corresponding to lower user satisfaction. To further prioritize and quantify demand attributes for each feature of the smart textile installation, this research incorporates the calculation of sensitivity coefficients.
To enable a more refined prioritization among attributes within the same category, this study introduces a sensitivity coefficient (denoted as ω), drawing upon the methodological basis established in prior work [22,23]. The coefficient is calculated based on the Better and Worse values. Its core principle is analogous to the concept of vector magnitude (Euclidean norm) in a two-dimensional space: the Better value (positive potential) and the absolute value of Worse (negative potential) are treated as two orthogonal dimensions. This specific norm was selected over alternatives, such as the sum of absolute values or the maximum value, because it balances the contribution of both dimensions and assigns a higher composite weight to attributes that score notably on both scales. This aligns with the decision-making logic in design optimization, which requires a balanced consideration of both “attractiveness” and “necessity.” The coefficient ω provides a composite measure of an attribute’s overall intensity of impact on user affect. An ω value closer to 1 indicates that the attribute is more likely to elicit a strong user reaction – whether satisfaction or dissatisfaction – and therefore warrants greater attention in resource allocation. The calculation formula is as follows:
A total of 110 questionnaires were distributed, and 103 valid responses were collected. This sample size satisfies the empirical requirements for Kano model analysis; it is generally recognized that 30–50 valid responses are sufficient to obtain stable classification trends – a threshold that has been consistently supported in prior Kano-related studies [21,22,23].
For instance, Berger et al. reported stable results with 50 responses [21], while Li et al. [22] and Li et al. [23] reported sample sizes of 43 and 75, respectively.
This survey employed a purposive sampling method, targeting potential audiences from the Shenzhen commercial plaza where the installation is intended to be located, ensuring the sample aligns with the characteristics of the actual user population. Detailed demographic data of the respondents are presented in Table 2, with key characteristics as follows: the 26–30 age group accounted for 33.98%, 81.55% held a college diploma or higher, 15.53% worked in marketing/sales/commerce, and the gender distribution was 59 male and 44 female participants. The questionnaire was divided into two parts: the first collected basic personal information, and the second consisted of 17 sets of items designed to evaluate various design attributes of the installation from both positive and negative dimensions. SPSS analysis indicated a Cronbach’s α of 0.889 and a KMO value of 0.756, confirming good internal consistency and sampling adequacy for the questionnaire. The Kano model was then applied to classify the attributes of the various features of the smart textile installation. A Better–Worse coefficient analysis was conducted, resulting in a coefficient analysis scatter plot. The Kano model analysis results for the smart textile installation are presented (Table 3).
Table 2
Demographic characteristics of respondents (N = 103)
| Demographic dimension | Category | Number (n) | Proportion (%) |
|---|---|---|---|
| Gender | Male | 59 | 57.3 |
| Female | 44 | 42.7 | |
| Age | 18∼25 Years | 28 | 27.2 |
| 26∼30 Years | 35 | 33.98 | |
| 31∼40 Years | 24 | 23.3 | |
| >40 Years | 16 | 15.52 | |
| Education | Senior high school and below | 19 | 18.45 |
| College degree and above | 84 | 81.55 | |
| Occupation | Marketing/Sales/Commerce | 16 | 15.53 |
| Enterprise employee | 32 | 31 | |
| Student | 25 | 24.3 | |
| Freelancer | 18 | 17.5 | |
| Others (Teacher/Medical, etc.) | 12 | 11.67 |
Source: Authors’ contribution.
Table 3
Summary of KANO Model analysis results
| No. | Features/Services | M | O | A | I | R | Q | Result |
|---|---|---|---|---|---|---|---|---|
| 1 | Views on the optical fiber art installation | 20.39% | 9.71% | 49.51% | 20.39% | 0% | 0% | A |
| 2 | Cultural connotations | 0% | 0% | 0% | 65.05% | 34.95% | 0% | I |
| 3 | Conveying concepts | 0% | 0% | 0% | 11.65% | 88.35% | 0% | R |
| 4 | Integration of art and technology | 20.39% | 43.69% | 19.42% | 16.5% | 0% | 0% | O |
| 5 | Spatial positioning considerations | 40.78% | 6.8% | 35.92% | 16.5% | 0% | 0% | M |
| 6 | Fiber optic materials | 26.21% | 36.89% | 17.48% | 19.42% | 0% | 0% | O |
| 7 | Engraving technique | 58.25% | 9.71% | 14.56% | 17.48% | 0% | 0% | M |
| 8 | Technical controls | 0% | 0% | 0% | 45.63% | 54.37% | 0% | R |
| 9 | Modeling and previewing | 21.36% | 16.5% | 50.49% | 11.65% | 0% | 0% | A |
| 10 | Expressions methods | 0% | 0% | 0% | 19.42% | 80.58% | 0% | R |
| 11 | Form selection | 54.37% | 12.62% | 9.71% | 23.3% | 0% | 0% | M |
| 12 | Color expression | 18.45% | 1.94% | 17.48% | 62.14% | 0% | 0% | I |
| 13 | Layout and arrangement | 23.3% | 33.01% | 27.18% | 16.5% | 0% | 0% | 0 |
| 14 | Perception of color effects | 25.24% | 9.71% | 15.53% | 49.51% | 0% | 0% | I |
| 15 | Perception of spatial atmosphere | 10.68% | 7.77% | 49.51% | 32.04% | 0% | 0% | A |
| 16 | Perception of dynamic effects | 57.28% | 9.71% | 13.59% | 19.42% | 0% | 0% | M |
| 17 | Emotional resonance experience | 51.56% | 8.74% | 17.48% | 22.33% | 0% | 0% | M |
Result Classification:.
A: Attractive attributes; O: One-dimensional attributes; M: Must-be attributes; I: Indifferent attributes; R: Reverse attributes; Q: Questionable attributes.
Source: Authors’ contribution.
3. Results
The Kano model data were organized, and Better and Worse values were calculated using the Better–Worse coefficient formula. A Better–Worse Coefficient plot (Figure 5) was created to clarify the quadrant classification and demand attribute distribution of each design feature of the smart soft decoration. As shown in Figure 5, there are 11 features that fall under the three demand attributes: attractive needs, must-be needs, and one-dimensional needs. These attributes represent the core aspects that users actively recognize and value during their interaction with the installation, indicating a generally positive reception and engagement with the prototype.
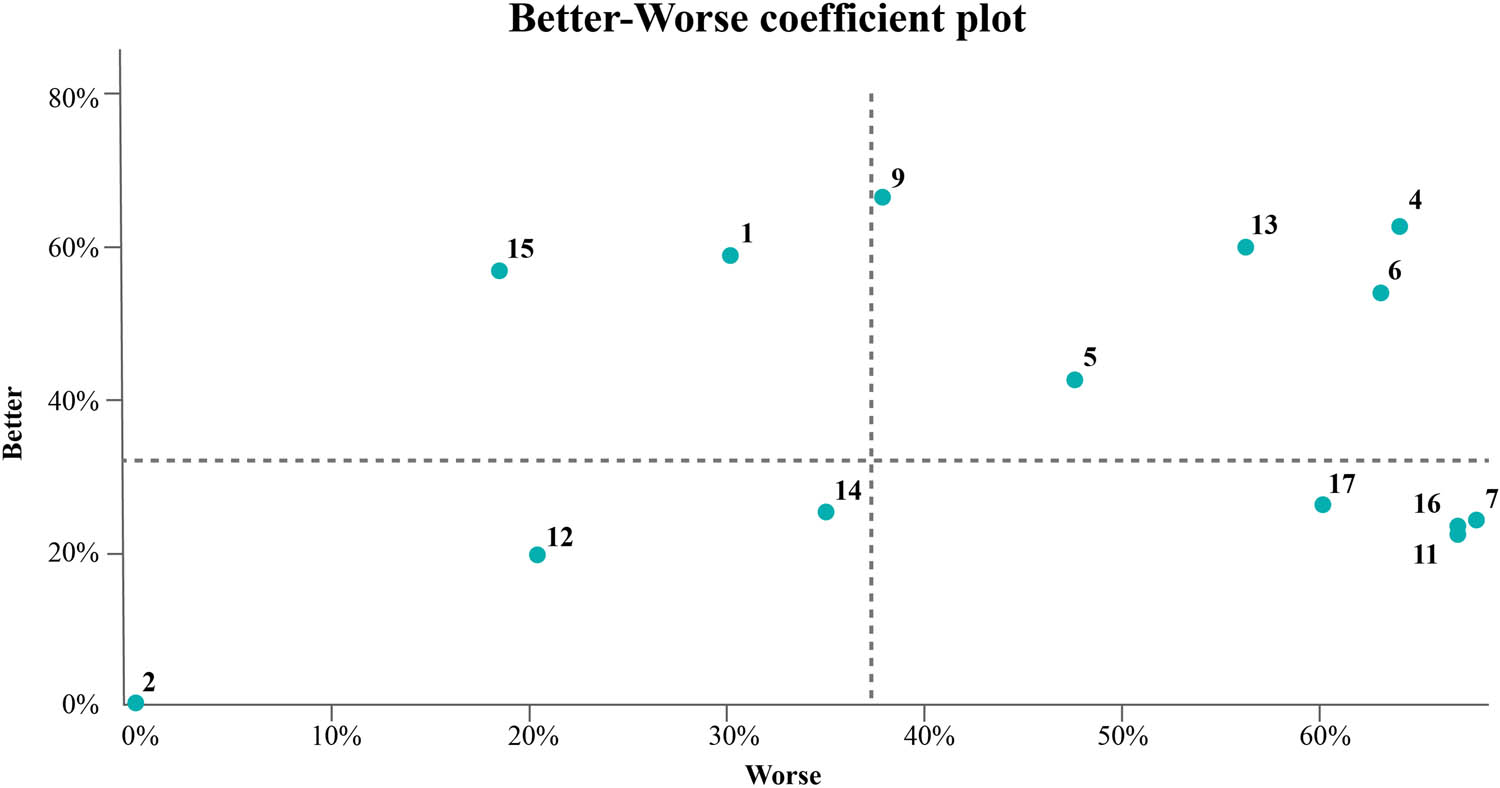
Figure 5
The Better–Worse coefficient plot. Note: This figure is based on the Kano model results and plots the Better and Worse values calculated using equations (1) and (2) from the paper. Each point in the figure represents one design attribute. The Y-axis corresponds to the Better value, while the X-axis corresponds to the absolute value of the Worse value. Attributes are mapped onto a two-dimensional coordinate system according to their coefficient profiles and are divided into four quadrants: Quadrant I represents One-dimensional attributes (high Better, high |Worse|); Quadrant II represents Attractive attributes (high Better, low |Worse|); Quadrant III represents Indifferent attributes (low Better, low |Worse|); and Quadrant IV represents Must-be attributes (low Better, high |Worse|). This visualization intuitively illustrates the non-linear impact characteristics of design attributes on user satisfaction.
Source: Authors’ contribution.
To further refine the analysis, sensitivity coefficients were calculated based on the Better–Worse coefficient results. Combining these with the Better–Worse Coefficient plot results, an overall ranking of the various indicators for this smart soft decoration was established (Table 4). Simultaneously, a ranking of sensitivity coefficients was observed (Table 5), leading to the following conclusions:
Table 4
Sensitivity Coefficients and Bootstrap 95% CIs for Design Attributes
| No. | Features/Services | Better | Worse | ω | 95% CI Lower Bound | 95% CI Upper Bound | Results | Sort |
|---|---|---|---|---|---|---|---|---|
| 1 | Views on the optical fiber art installation | 59.22% | −30.1% | 0.664 | 0.612 | 0.715 | A | 8 |
| 2 | Cultural connotations | 0% | 0% | 0 | 0 | 0 | I | 14 |
| 3 | Convey ideas | 0% | 0% | 0 | 0 | 0 | R | / |
| 4 | Art and technology merge ideas | 63.11% | −64.08% | 0.899 | 0.861 | 0.934 | O | 1 |
| 5 | Spatial positioning thinking | 42.72% | −47.57% | 0.639 | 0.588 | 0.690 | O | 10 |
| 6 | Fiber optic materials | 54.37% | −63.11% | 0.833 | 0.790 | 0.875 | O | 2 |
| 7 | Engraving technique | 24.27% | −67.96% | 0.722 | 0.670 | 0.773 | M | 5 |
| 8 | Technical controls | 0% | 0% | 0 | 0 | 0 | R | / |
| 9 | Model the form of a production preview | 66.99% | 37.86% | 0.769 | 0.720 | 0.817 | O | 4 |
| 10 | Expressions | 0% | 0% | 0 | 0 | 0 | R | / |
| 11 | Pattern selection | 22.33% | −66.99% | 0.706 | 0.654 | 0.757 | M | 7 |
| 12 | Color expression | 19.42% | −20.39% | 0.282 | 0.241 | 0.325 | I | 13 |
| 13 | Layout arrangement | 60.19% | −56.31% | 0.824 | 0.781 | 0.866 | O | 3 |
| 14 | Color effect perception | 25.24% | −34.95% | 0.431 | 0.378 | 0.483 | I | 12 |
| 15 | Spatial atmosphere perception | 57.28% | −18.45% | 0.602 | 0.550 | 0.653 | A | 11 |
| 16 | Dynamic effect perception | 23.3% | −66.99% | 0.709 | 0.657 | 0.760 | M | 6 |
| 17 | Emotional resonance experience | 26.21% | −60.19% | 0.656 | 0.605 | 0.706 | M | 9 |
Note: Bootstrap resampling (1,000 iterations) was used to calculate confidence intervals (CIs). Values for No. 2, 3, 8, and 10 are 0 because these attributes are classified as Indifferent (I) or Reverse (R) needs, with no valid Better–Worse coefficient values for sensitivity calculation.
Source: Authors’ contribution.
Table 5
Priority ranking of design attributes by category
| Category | Sort |
|---|---|
| M: Must-be attributes | 7 > 16 > 11 > 17 |
| O: One-dimensional attributes | 4 > 6 > 13 > 9 > 5 |
| A: Attractive attributes | 1 > 15 |
| I: Indifferent attributes | 14 > 12 > 4 |
Source: Authors’ contribution.
To test the robustness of the sensitivity coefficient ranking, we employed the Bootstrap resampling method (with 1000 iterations) to calculate the 95% confidence intervals for each ω value. This method is suitable for situations where the distribution of this composite metric is not well-defined. As shown in Table 4, the confidence intervals for the highest-ranked attributes (e.g., #4, ω = 0.899, 95% CI [0.861, 0.934]) and the lowest-ranked ones (e.g., #12, ω = 0.282, 95% CI [0.241, 0.325]) do not overlap. This indicates that the observed differences in the priority of design attributes are statistically robust and are not attributable to random sampling error.
Quadrant I (One-dimensional Needs) contains five features, with the highest sensitivity rankings being “4 Art and technology integration concept,” “6 Optical fiber material,” “13 Organization arrangement,” “9 Modeling generation preview method,” and “5 Spatial positioning.” One-dimensional needs are core attributes for improving user satisfaction and should be prioritized in design. These attributes demonstrate a linear relationship with user satisfaction and represent the most effective areas for maximizing user experience improvements.
Quadrant II (Attractive needs) includes two features in this category. According to the sensitivity coefficient ranking, these are “1 Opinions on the optical fiber art installation” and “15 Spatial ambiance perception.” While these attributes can significantly enhance user delight when present, their absence does not cause dissatisfaction, positioning them as strategic differentiators in the design.
Quadrant III (Indifferent needs) comprises three features, with “14 Color effect perception,” “12 Color expression,” and “2 Cultural connotation.” Features classified as indifferent needs bear no substantial influence on user satisfaction, irrespective of their provision or absence. This suggests that users don’t have strong preferences for these attributes, indicating potential inadequacies in design or a lack of user demand, necessitating improvements in these features.
Quadrant IV (Must-be needs) encompasses four critical features, including “7 Engraving technology,” “16 Dynamic effect perception,” “11 Morphological selection,” and “17 Emotional resonance experience.” These attributes represent fundamental requirements that must be fulfilled to avoid significant user dissatisfaction, though their excellent execution does not substantially increase satisfaction.
Additionally, there are reverse needs, totaling three features: “3 Conveying ideas,” “8 Technology control for color-changing light emission,” and “10 Expression techniques.” Since the Better–Worse coefficients for these features within reverse needs are the same, no sensitivity coefficient ranking was performed. Reverse needs represent aspects that users find unappealing, and the presence of these features can lead to decreased user satisfaction. Thus, these elements should be the focal points for design optimization and enhancement. Properly addressing reverse needs can mitigate user resistance towards the design, and consequently, augment its overall attractiveness.
4. Discussion
4.1. Addressing Design Shortcomings: Indifferent and Reverse Needs
The identification of Indifferent Needs reveals critical opportunities for refining the physical prototype before final implementation. The neutral response to “Color Effect Perception” and “Color Expression” despite the technically sophisticated seven-color gradient system indicates that technical capability alone cannot guarantee user engagement. As Witzel and Gegenfurtner emphasize, color serves fundamental cognitive functions in object identification and environmental assessment [24]. Our current implementation may fail to create a coherent color narrative that supports these innate cognitive processes. Optimization requires a more nuanced approach to color dynamics, potentially incorporating principles from natural systems. Replacing the full-spectrum cycling with gradual, monochromatic progressions mimicking natural light shifts could transform color from a technical display feature into an integral component of the spatial atmosphere. Similarly, the indifferent response to “Cultural Connotation” suggests a disconnect between the designer’s intent and user reception in public commercial environments. The optimization strategy should make cultural content optional rather than integral to the core experience. Providing discreet access points to contextual information through QR codes or subtle digital interfaces allows interested viewers to explore deeper meanings without imposing interpretive frameworks on all users.
The Reverse Needs category provides perhaps the most valuable insights for prototype refinement. The negative response to “Technical Controls” appears intrinsically linked to dissatisfaction with the color output itself, underscoring the importance of holistic design thinking where technical interfaces and aesthetic outcomes are developed interdependently. The strong reverse need classification for “Conveying Ideas” and “Expressions” highlights the delicate balance required when translating profound concepts into public installations. User feedback indicates that explicit religious symbolism created discomfort, while biological realism triggered unintended visceral reactions. The solution involves refining execution toward more elegant, biomorphic forms that eliminate potentially unsettling literal references, shifting narrative emphasis toward universal themes of “growth, protection, and interconnectedness” that resonate across diverse audiences.
4.2. Value-creating Foundations: Must-be, One-dimensional, and Attractive Needs
The Must-be Needs constitute the essential foundation without which an installation cannot achieve basic user acceptance. The attribute with the highest sensitivity coefficient – engraving technique – and the second-highest – perception of dynamic effects – are the primary technical means for creating three-dimensional visual forms and dynamic lighting effects. Their high coefficients reflect users’ strong valuation and recognition of the technologically mediated experiences afforded by smart textile installations. Form selection indicates users’ aesthetic acceptance of isomorphic graphic design, while emotional resonance experience signifies users’ acknowledgment of the installation’s capacity to evoke inner emotional connection.
One-dimensional needs represent the primary drivers of user satisfaction, where improved performance directly enhances the user experience. The highest-ranked attribute, “Art and Technology Merge Ideas,” underscores the value users place on seamless integration where technological elements serve artistic expression rather than dominating it. This finding strongly supports our research objective of bridging artistic innovation with technical implementation through systematic methodology. Similarly, the high sensitivity of “Fiber Optic Material” confirms that the intrinsic properties of innovative materials contribute significantly to user engagement. The unique light-transmission qualities and ethereal visual characteristics of optical fibers fundamentally shaped user perceptions, suggesting substantial value in continuing to explore unconventional materials that offer distinctive aesthetic possibilities. The positive response to “Layout Arrangement” indicates a user preference for legible, coherent organizational structures, informing the spatial composition of future projects.
Attractive Needs provide the “delight factors” that can distinguish a competent installation from a memorable one. The high sensitivity of “Views on the Optical Fiber Art Installation” indicates that the novel application of optical fibers in a textile installation context still possesses considerable novelty value. This innovation factor represents a significant competitive advantage, suggesting ongoing opportunities for designers who explore unconventional material applications. The classification of “Spatial Atmosphere Perception” as an Attractive need highlights the transformative potential of well-executed smart textile installations. Users responded enthusiastically to the installation’s ability to redefine the sensory qualities of its environment. This capacity for atmosphere creation represents one of the most promising directions for the field, with potential for enhancement through multi-sensory approaches integrating complementary soundscapes or thermal variations to create more complete immersive experiences.
4.3. Methodological Implications and Limitations
This Kano-based analysis provides a sophisticated, multi-dimensional blueprint for the design and optimization of smart textile installations, directly addressing the research questions posed at the outset. Our findings deliver a clear answer to RQ1: user feedback from a physical prototype can be systematically translated into prioritized design attributes through the rigorous application of the Kano model and sensitivity coefficient analysis. Hypothesis H1 is strongly supported, as the methodology successfully categorized the 17 design features and yielded a clear, data-driven hierarchy for optimization. Furthermore, this study confirms the positive premise of RQ2. The resultant framework demonstrably mitigates key interdisciplinary and post-implementation challenges. By providing a common, data-backed rationale for design decisions, it establishes a robust foundation for alignment between artists, engineers, and designers. Moreover, by strategically prioritizing One-dimensional and Attractive attributes while proactively addressing Must-be and Reverse deficiencies, the framework directly targets the root causes of user dissatisfaction. This provides conclusive support for H2, confirming that such an optimization strategy significantly reduces anticipated user dissatisfaction risks.
It is noteworthy, however, that the conclusions of this study are derived primarily from a single optical-fiber installation case. While this methodological approach is advantageous for an in-depth exploration of the framework’s procedural steps, it inherently limits the generalizability (scalability) of the findings. The applicability of this framework to other smart textile contexts, such as wearable devices or adaptive interior soft furnishings, may be constrained by several factors: (1) It is likely more suitable for projects in the mid-development phase that possess an interactable physical prototype. (2) For functional products where technical attributes are paramount (e.g., medical monitoring garments), the Kano evaluation would need to incorporate dimensions such as wearing comfort and data accuracy, thereby reducing the weight assigned to cultural connotations and spatial atmosphere. (3) User groups differ across application scenarios, leading to corresponding variations in their needs and expectations. (4) Installations with more complex interactive logic may require the decomposition and analysis of a greater hierarchy of attributes. Therefore, future research should involve multi-case comparisons and cross-contextual applications to further refine and validate the framework.
Furthermore, this study serves as a foundational methodological contribution, providing a systematic approach for design optimization. The effectiveness of the specific optimization strategies proposed for the physical prototype based on this analysis constitutes a key avenue for subsequent research. Future work could prioritize the development of a second-generation iterative prototype for validation. A follow-up user study employing the same Kano questionnaire could then be conducted. By comparing the results from both studies – with particular focus on changes in user feedback regarding attributes initially classified as Indifferent or Reverse – researchers could assess the effectiveness of the new prototype’s optimizations and empirically evaluate the practical utility of the proposed framework.
5. Conclusions
This study has established and validated a systematic methodology for optimizing smart textile installation design through the integration of physical prototype evaluation and Kano model analysis. Particular emphasis is placed on the significant role of Indifferent and Reverse attributes in design optimization, despite their frequent neglect in prior research.
By transforming subjective design decisions into empirically validated strategies, this approach not only facilitates more effective transdisciplinary collaboration but also achieves an optimal balance between design innovation and user satisfaction. The case study indicates that the methodology has the potential to reduce post-implementation risks and costs while enhancing project success rates. This research offers designers a set of actionable guidance to navigate interdisciplinary complexities and propose targeted strategies to mitigate user dissatisfaction.
Acknowledgements
We acknowledge Guangdong “GAFA-Gewu Interaction” Material & Media Science Industry Education Integration Practical Teaching Base for the technical and research support.
Funding information
This work was financially supported by 2025 Guangdong Provincial Key Areas Research Program for Higher Education (Grant No. 2025ZDZX4031). This work was also supported by the 2025 Guangdong Education Research Project (Special Fund Project for Higher Education) (Grant No. 2025GXJK0236).
Author contributions
Shun Tian: Conceptualization; Methodology; Prototype fabrication and validation; Formal analysis; Writing – original draft. Linxi Cai: Conceptualization; Resources; Writing – review & editing; Project administration. Jincha Ye: Investigation; Data curation; Visualization.
Conflict of interest statement
Authors state no conflict of interest.
Data availability statement
Relevant experimental data necessary to support the findings of this work are available from the corresponding author upon reasonable request.