
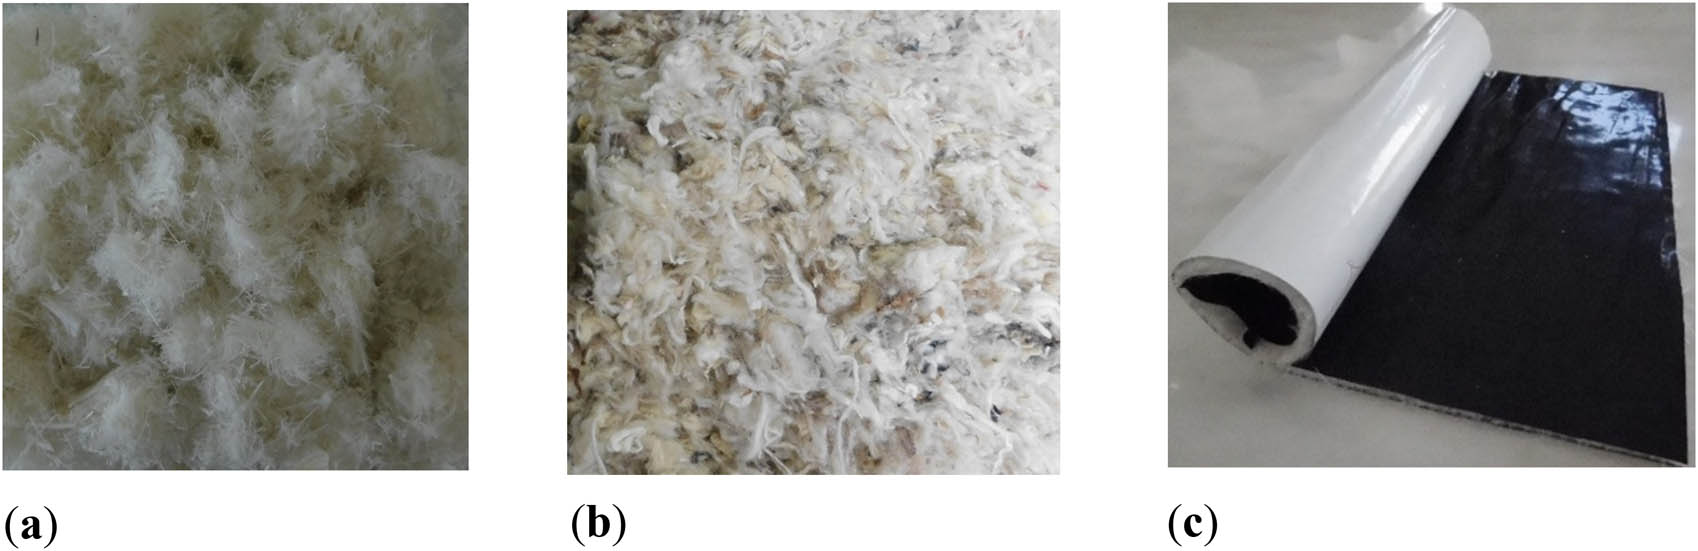
Figure 1
Chicken feathers (a), wool (b), and thermal insulation nonwoven (c).
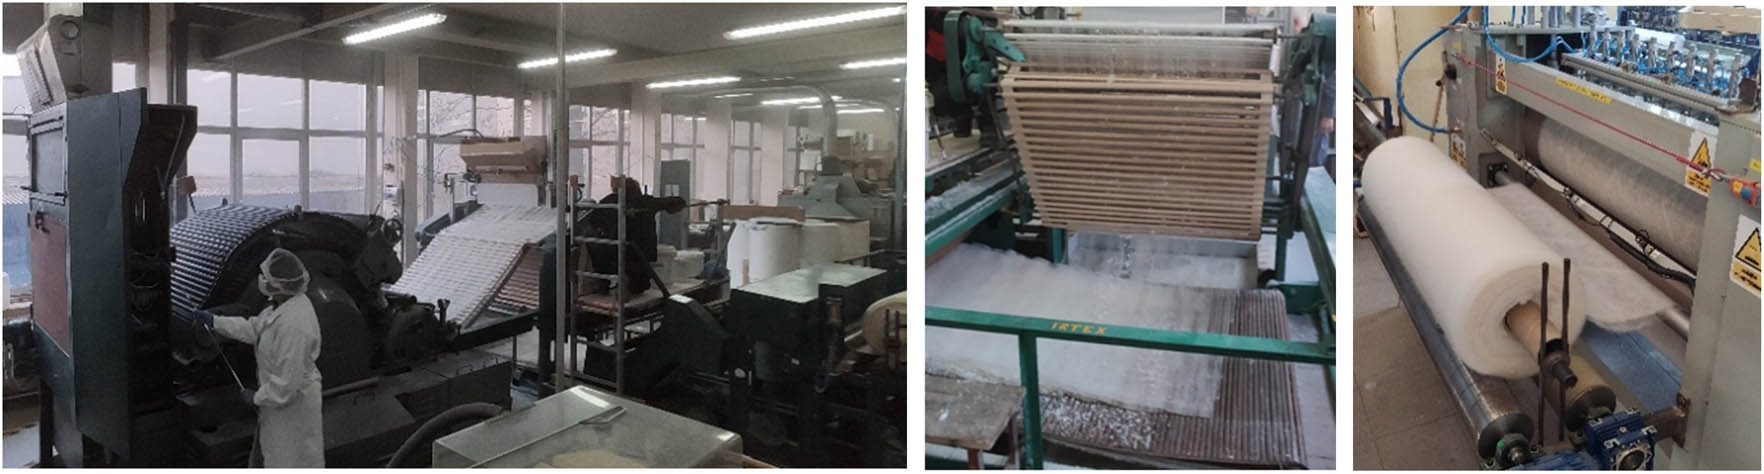
Figure 2
Complete process of nonwoven manufacturing by needle punching.
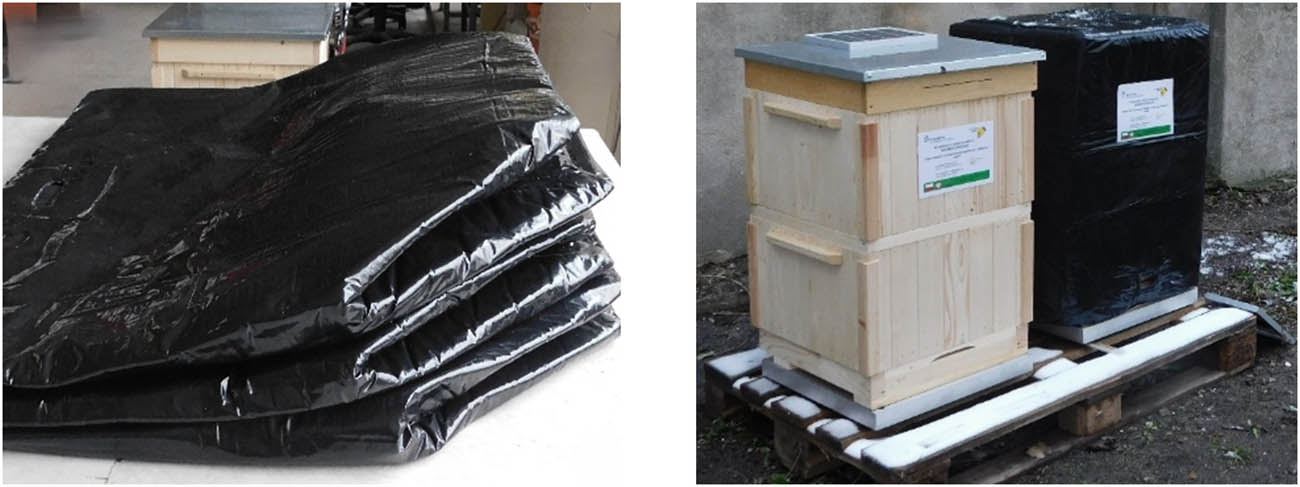
Figure 3
Thermal insulation cover.
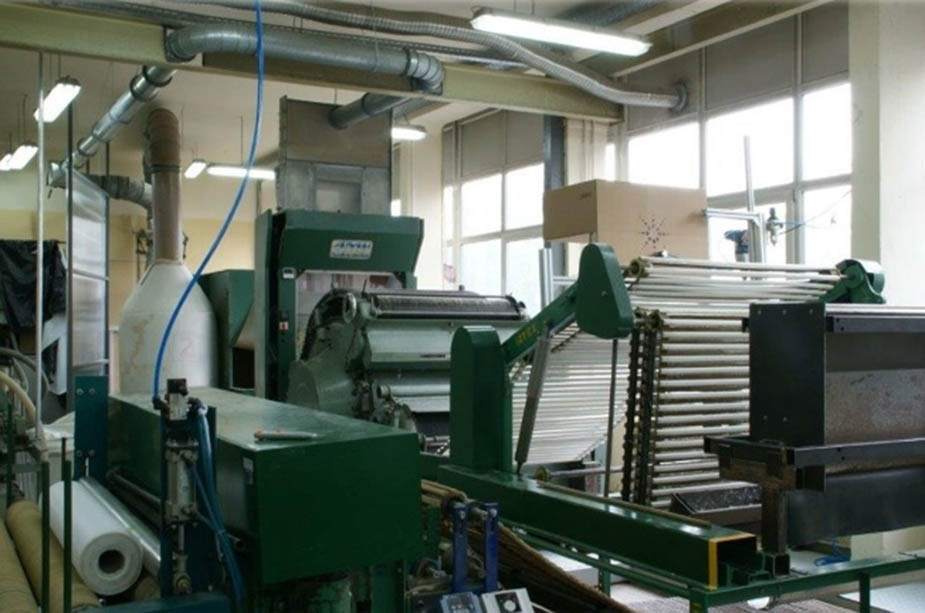
Figure 4
Needle-punching production line for nonwoven insulation using needle punching method.
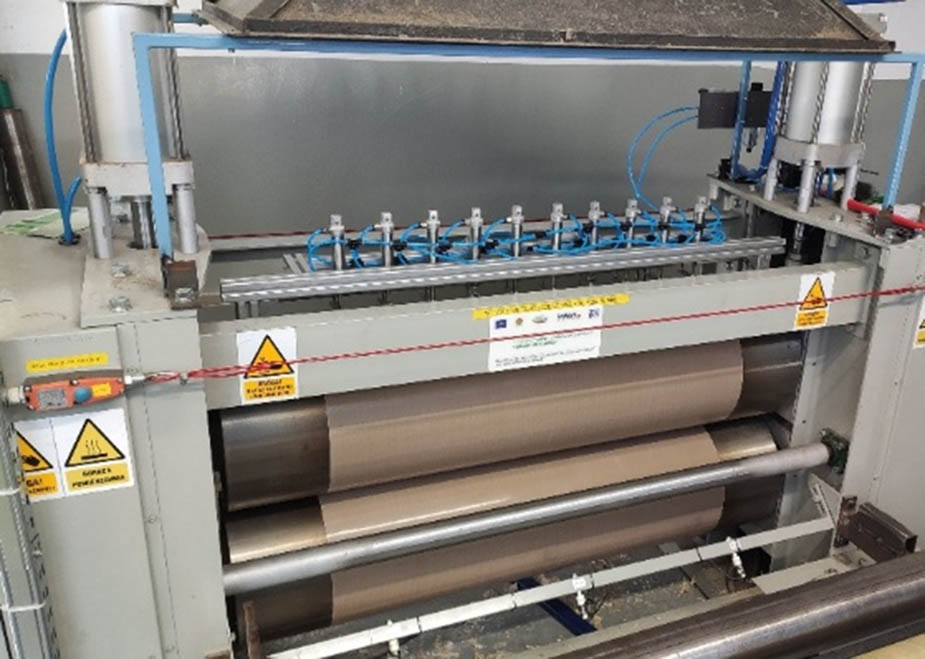
Figure 5
Infrared heating unit used for thermal consolidation of the feather–wool nonwoven composite prior to lamination.
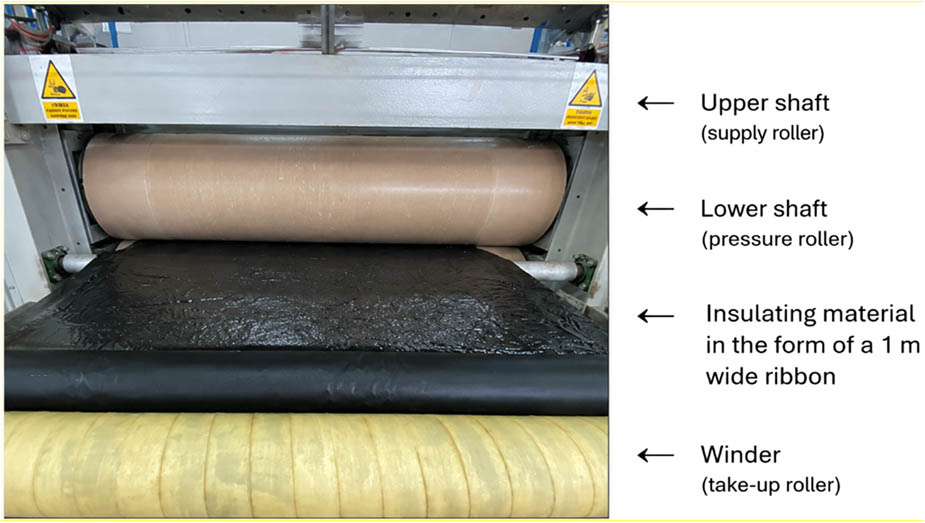
Figure 6
Two-roll calender used for continuous thermal bonding and lamination of the multilayer insulation composite.
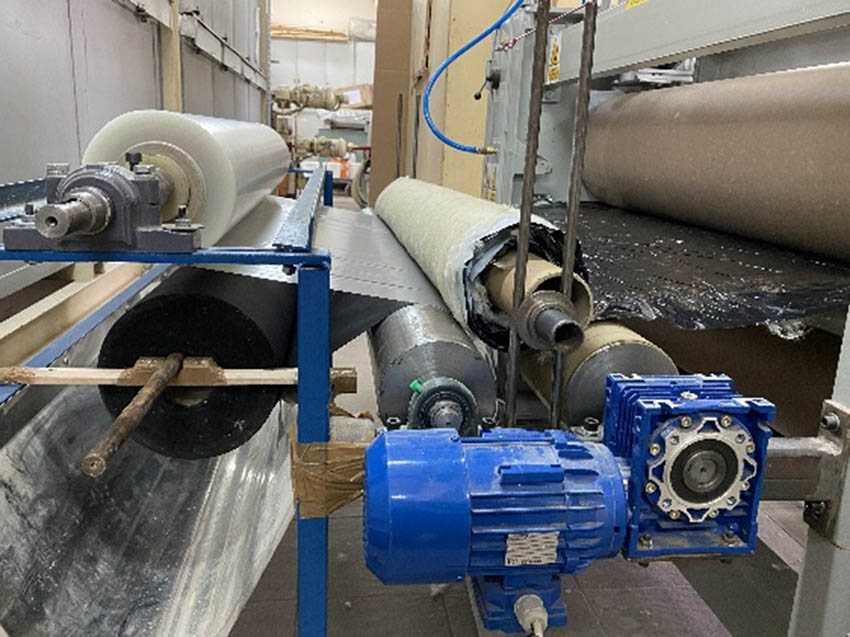
Figure 7
Continuous lamination process of the feather–wool nonwoven composite with compostable film and spunbond layers.
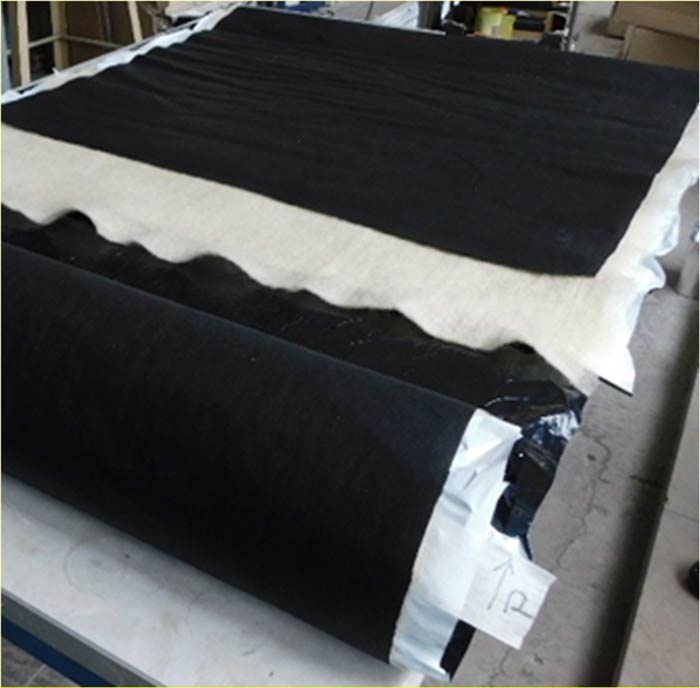
Figure 8
The layering of a composite intended for the construction of a beehive thermal insulation.
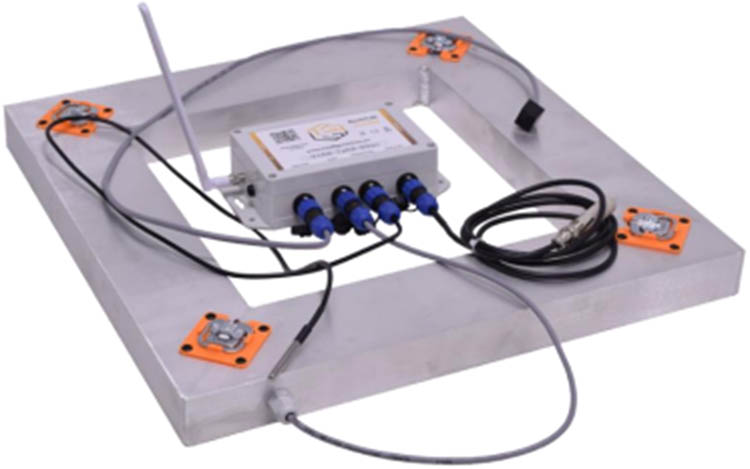
Figure 9
Measuring kit.
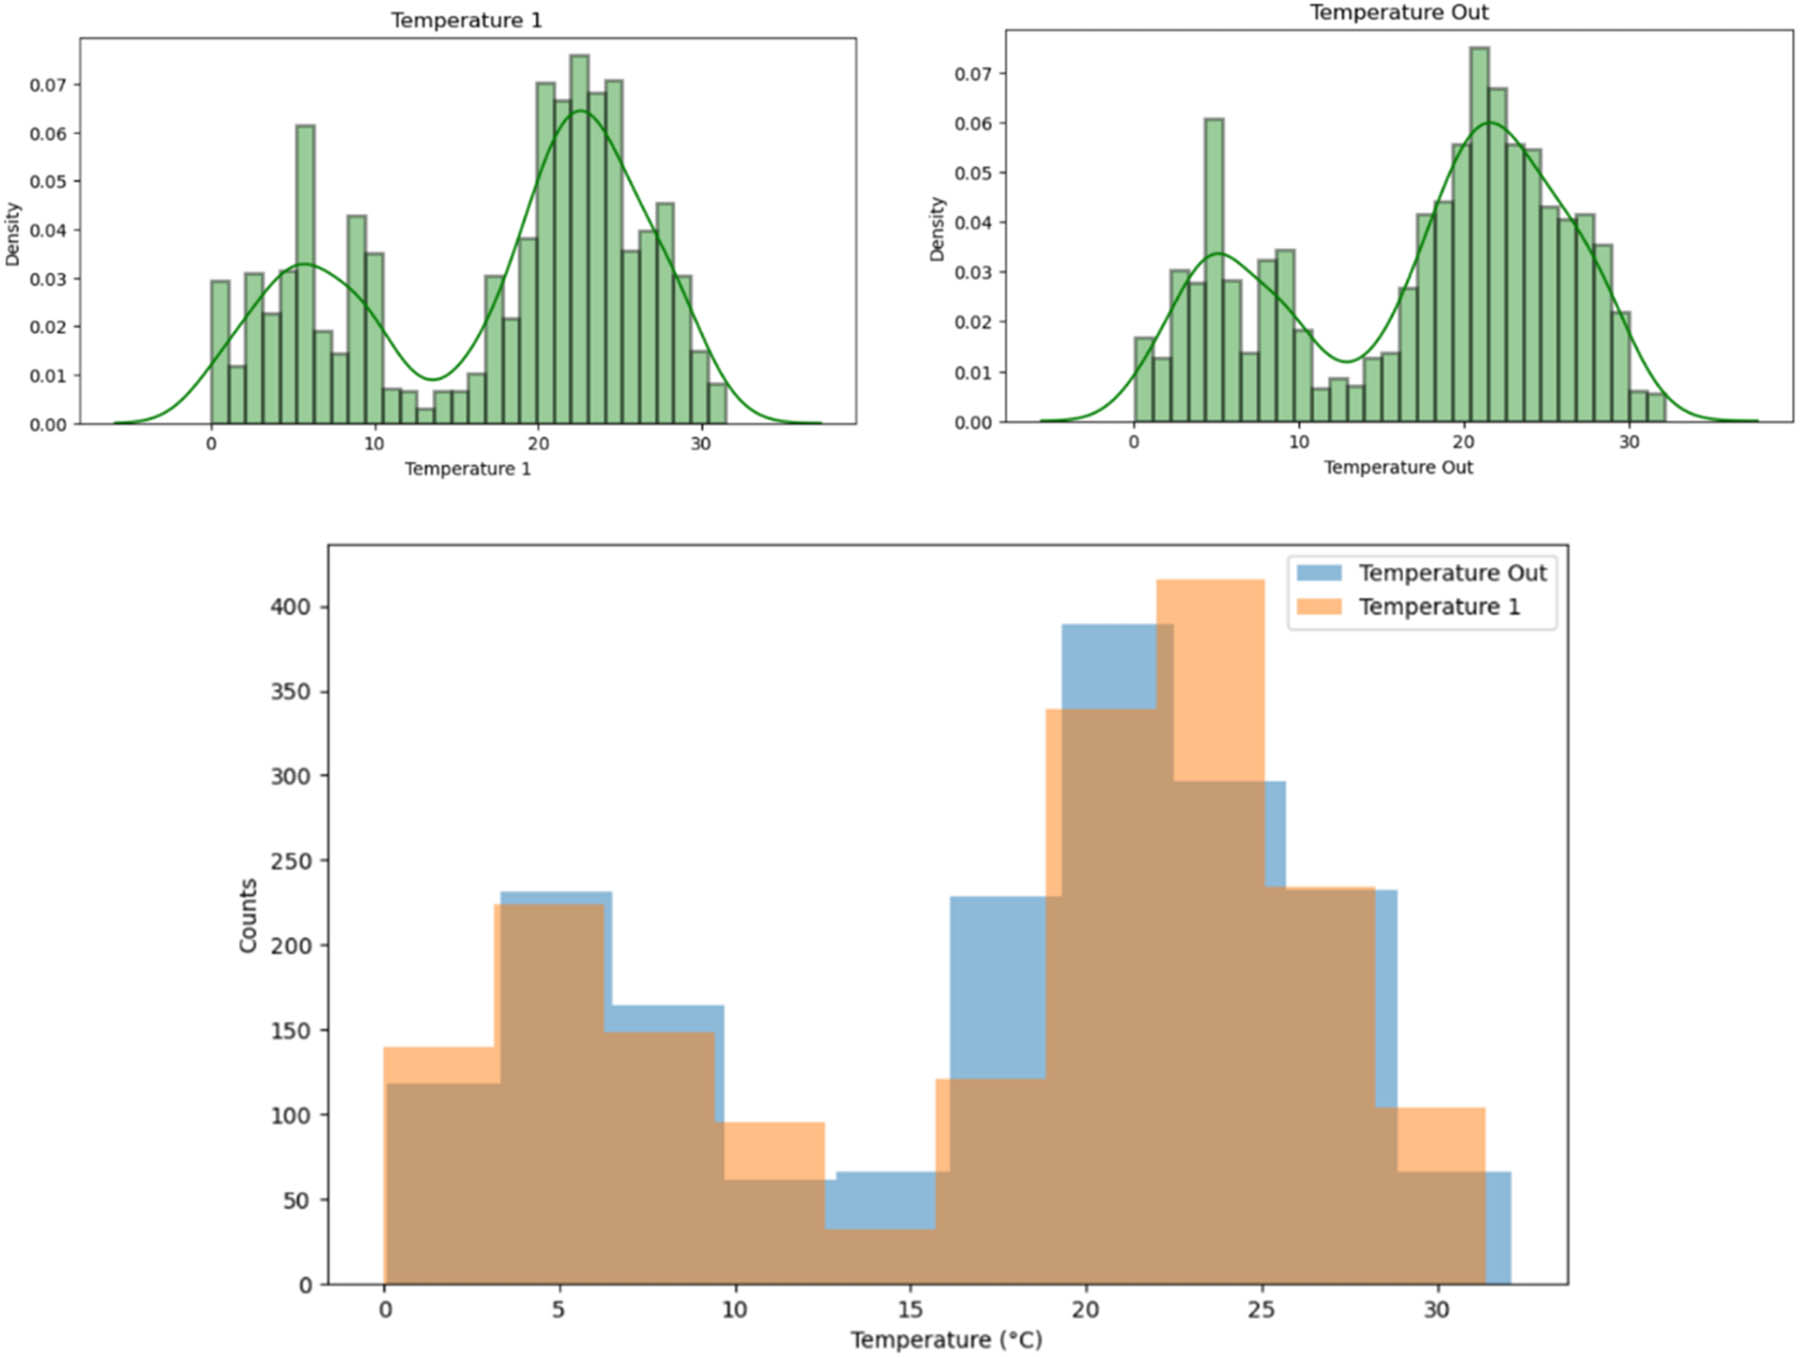
Figure 10
Relationship between external and internal hive temperature, illustrating the thermal buffering effect of the nonwoven insulation layer.
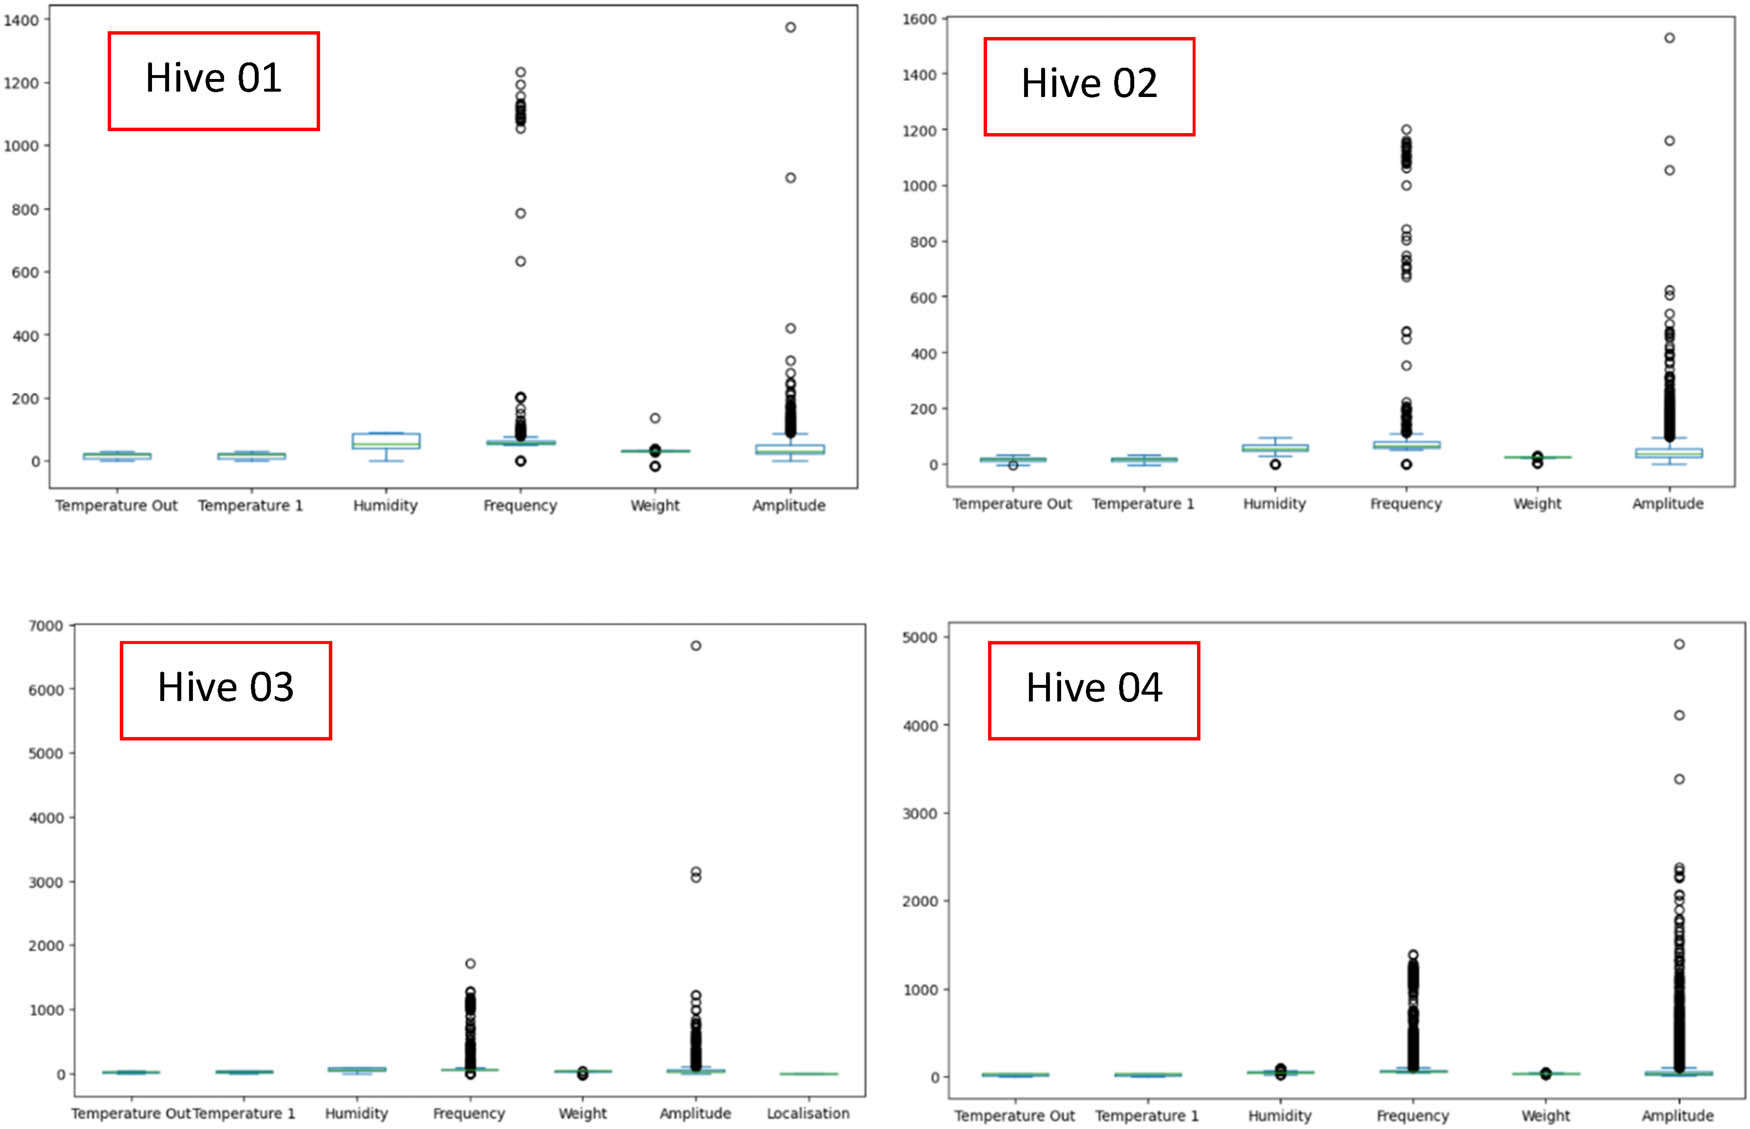
Figure 11
Comparison of temperature, humidity and acoustic activity recorded in empty and occupied hives with and without bio-based nonwoven insulation. Hive 01 – empty hive without insulation, Hive 02 – empty hive with insulation, Hive 03 – hive with bees, without insulation, and Hive 04 – hive with bees, with insulation.
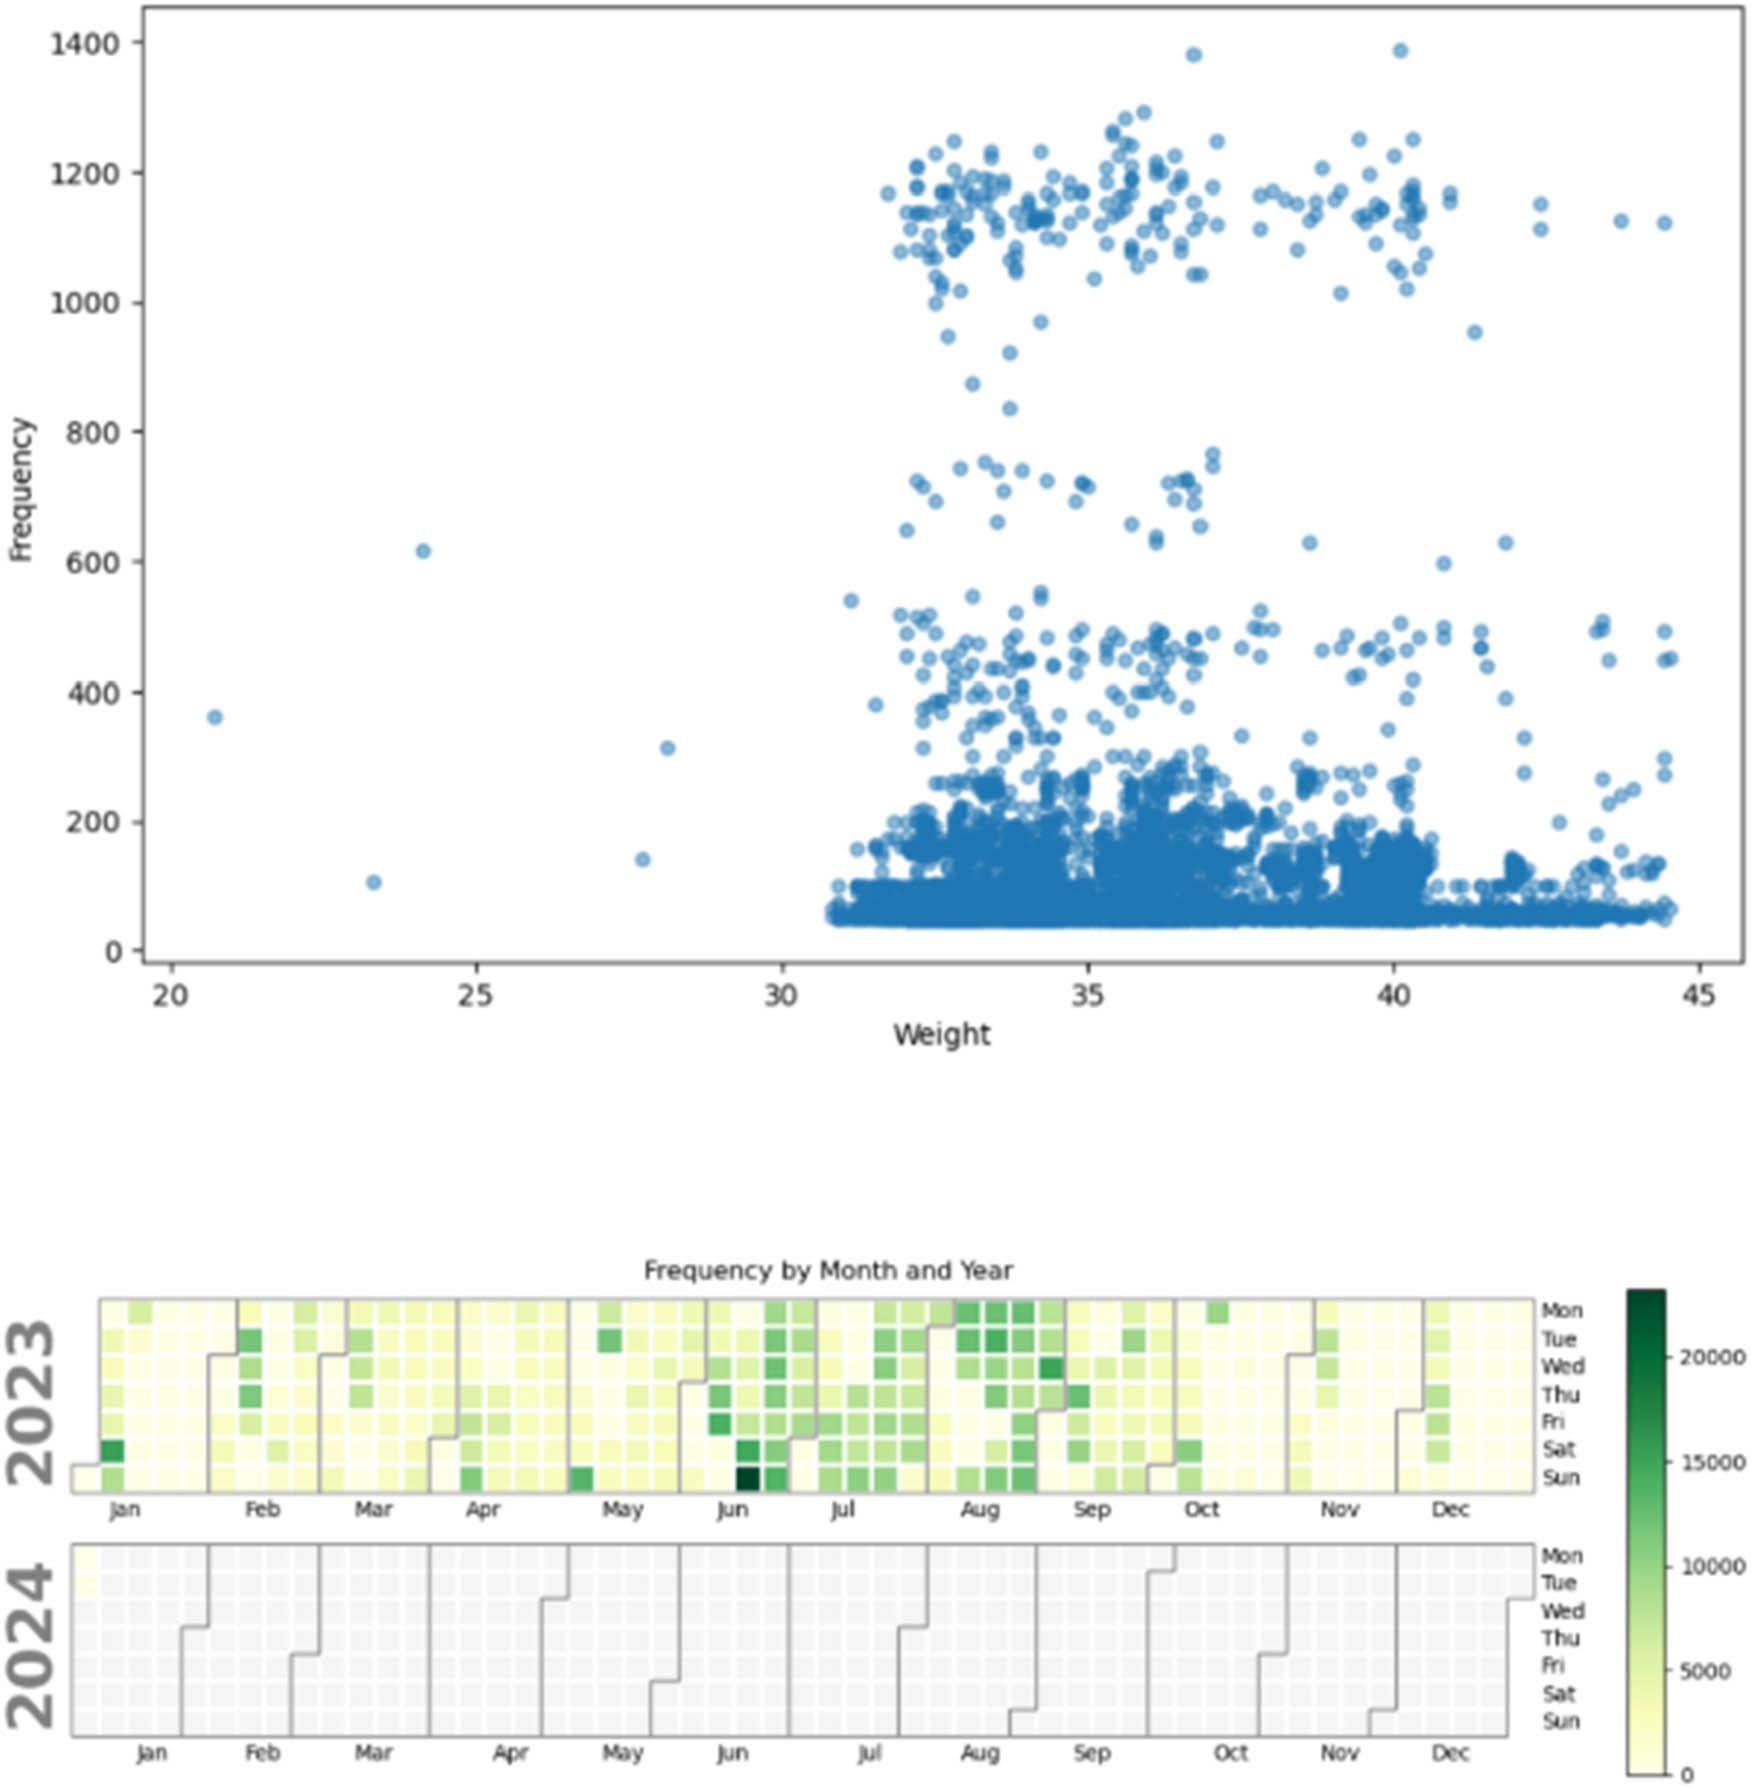
Figure 12
Frequency of bee activity in relation to hive weight and months of the year.
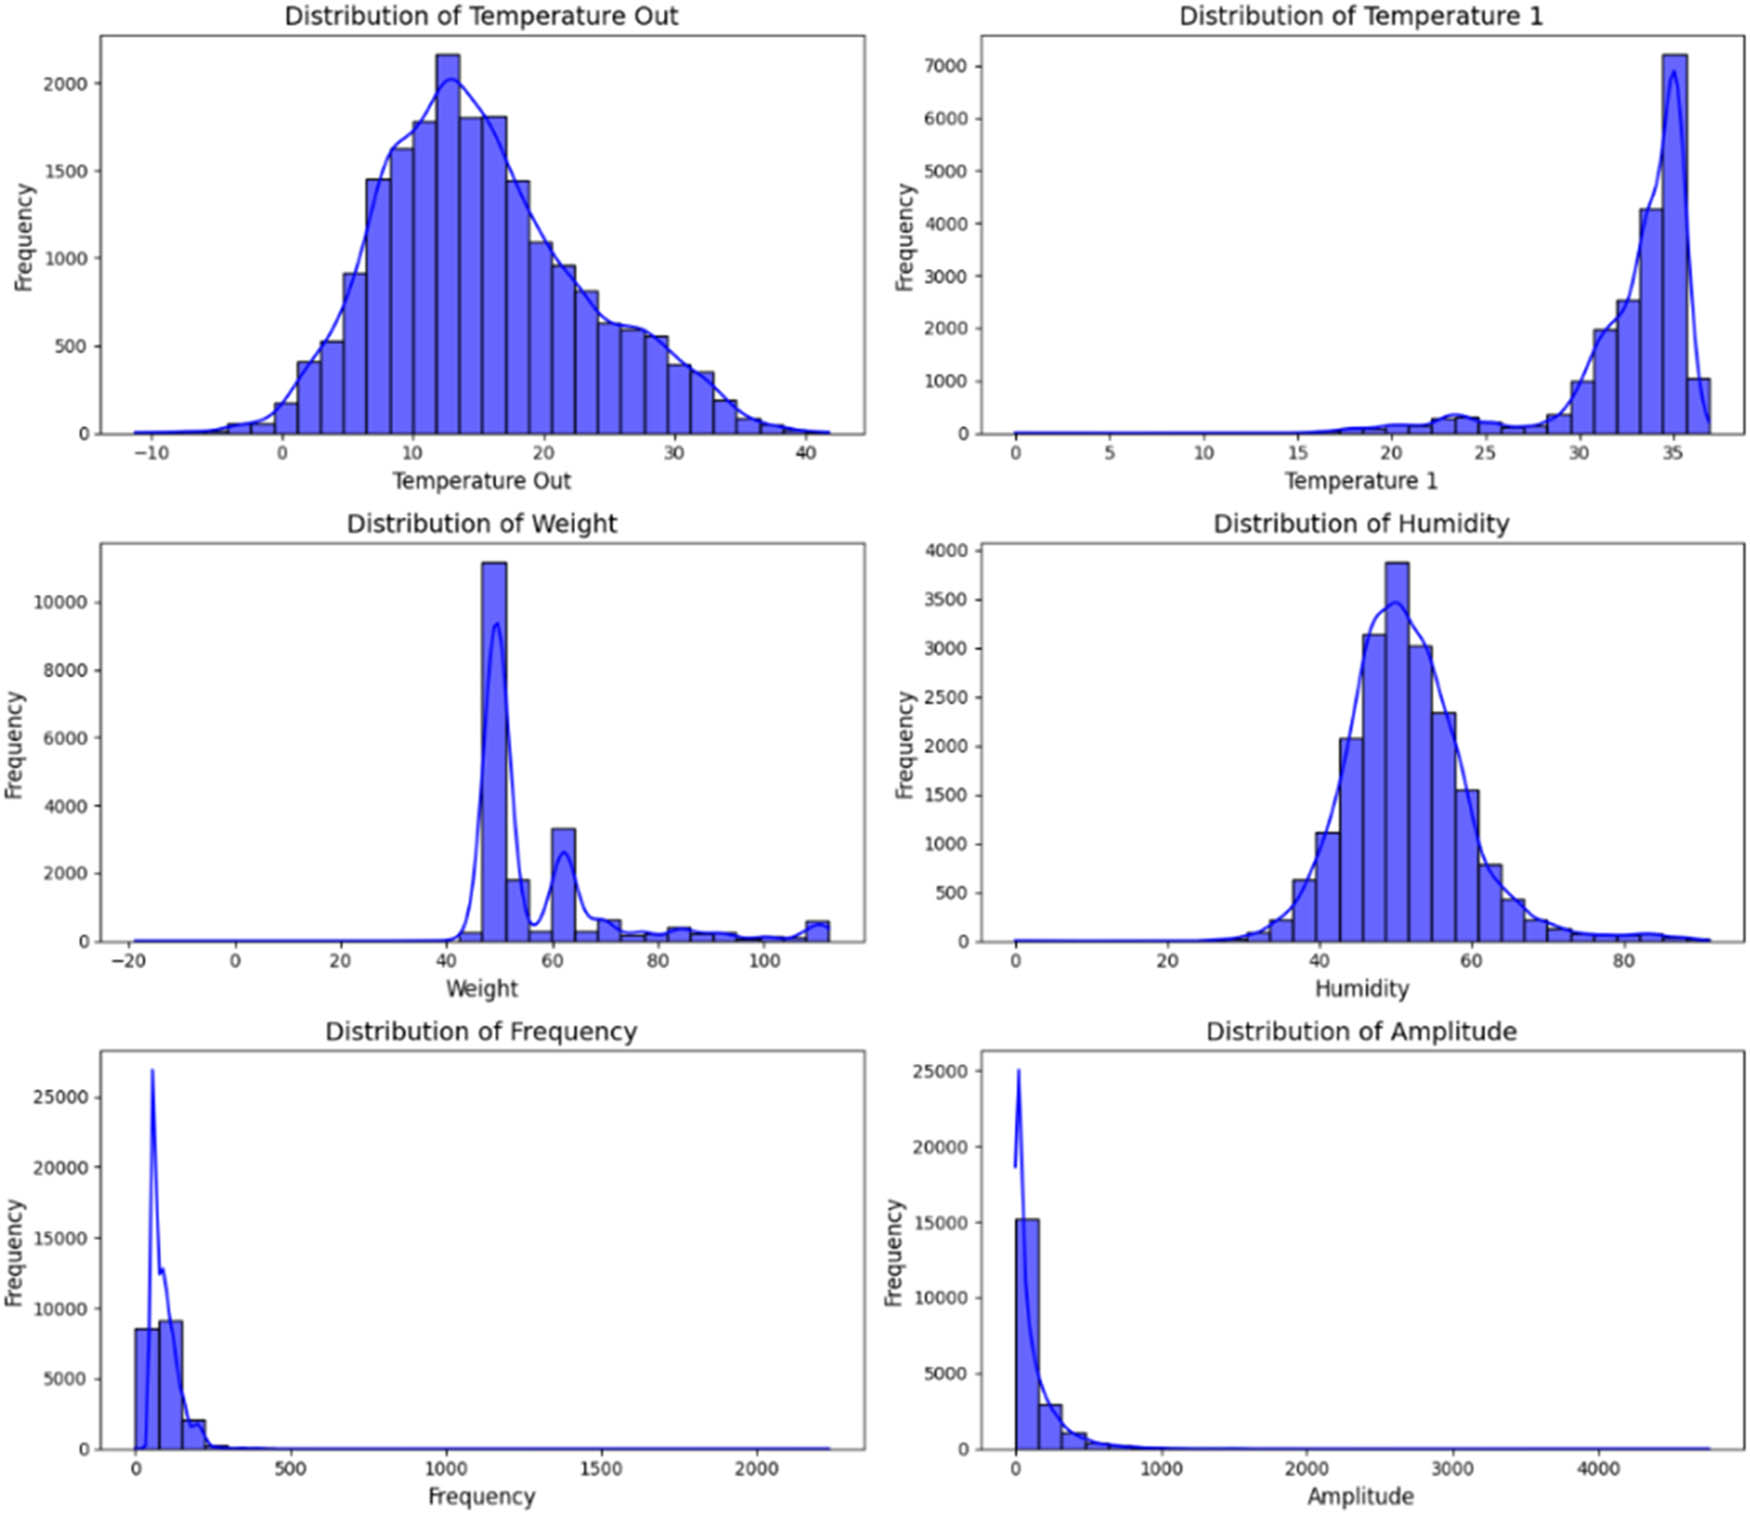
Figure 13
Acoustic and environmental activity patterns in relation to hive conditions and external environmental parameters.
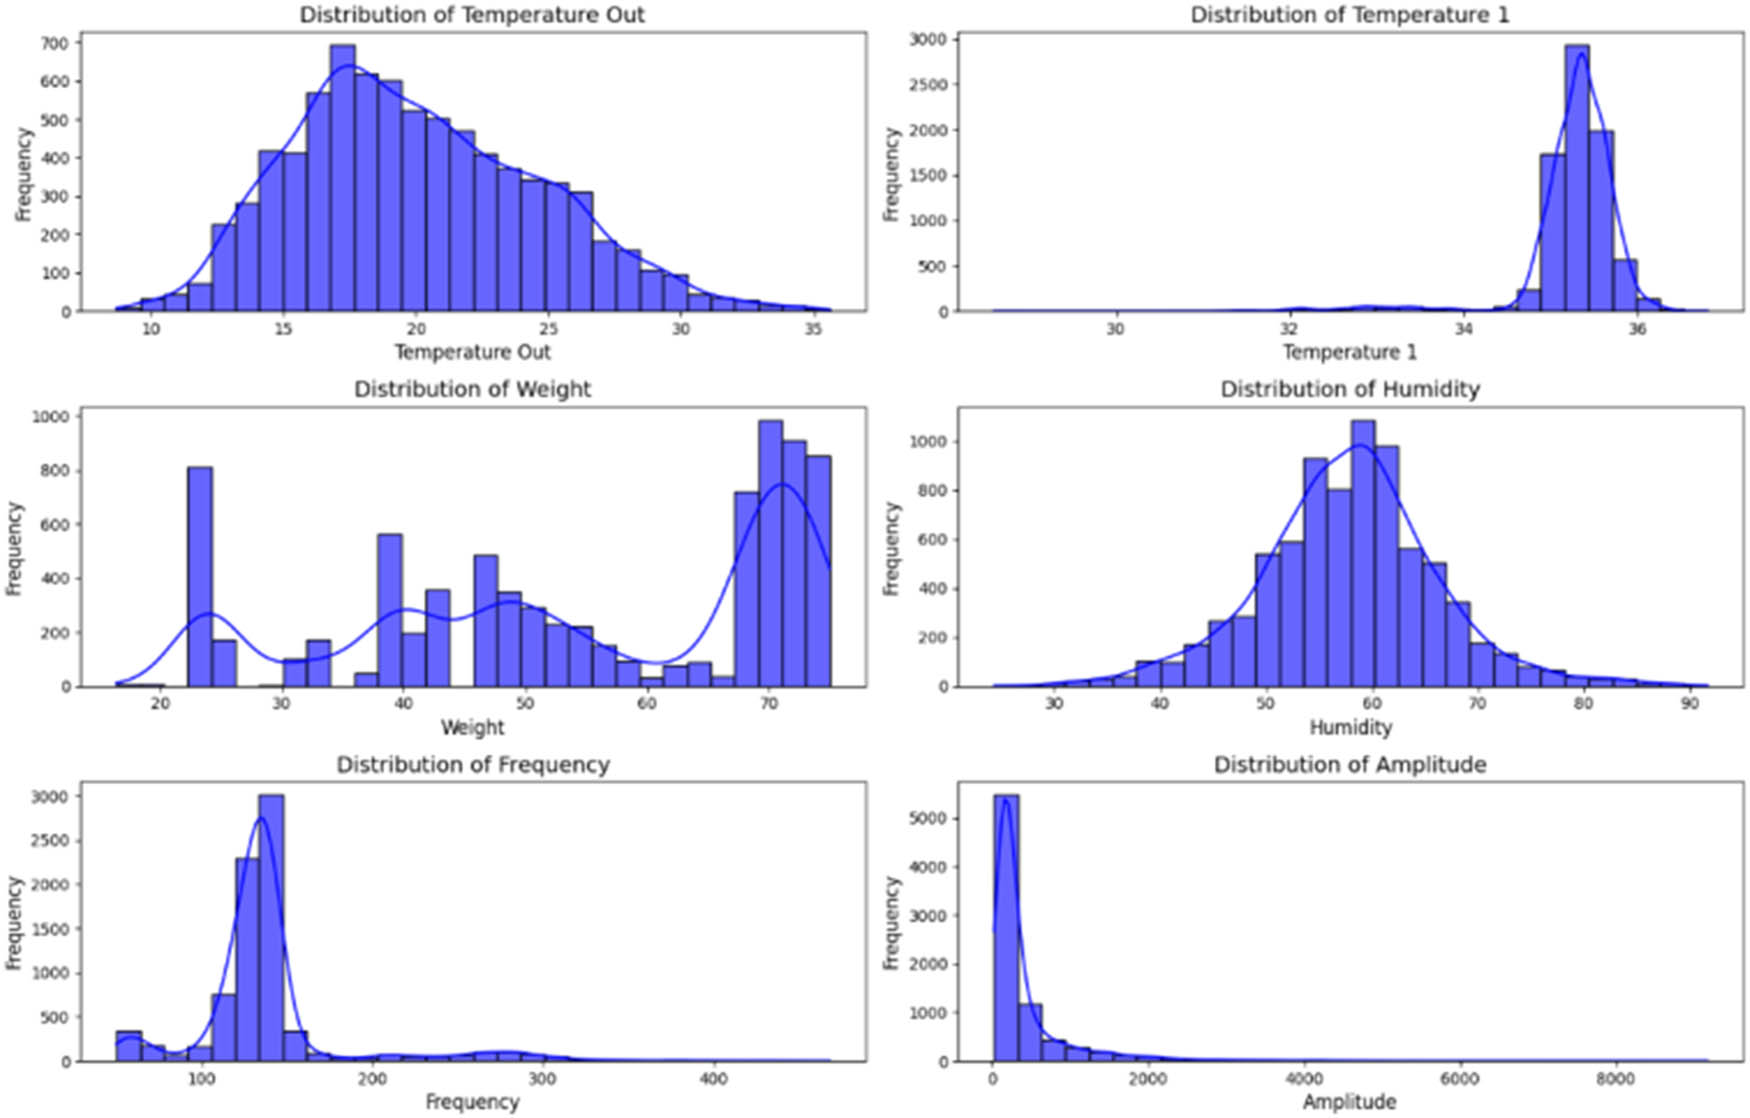
Figure 14
Acoustic and environmental activity patterns in hives with insulation in relation to other parameters.
Table 1
Comparison of thermal conductivity values for selected bio-based and recycled nonwoven insulation materials
| Property | Flax/hemp (lignocellulosic) | Wool | Cellulose (regenerated) | PLA (biopolymer) | Recycled textile nonwovens | Feather/wool nonwoven |
|---|---|---|---|---|---|---|
| Thermal conductivity λ (W/mK) | 0.038–0.045 | 0.035–0.040 | 0.035–0.042 | 0.064–0.090 | 0.040–0.055 | 0.19–0.20 |