
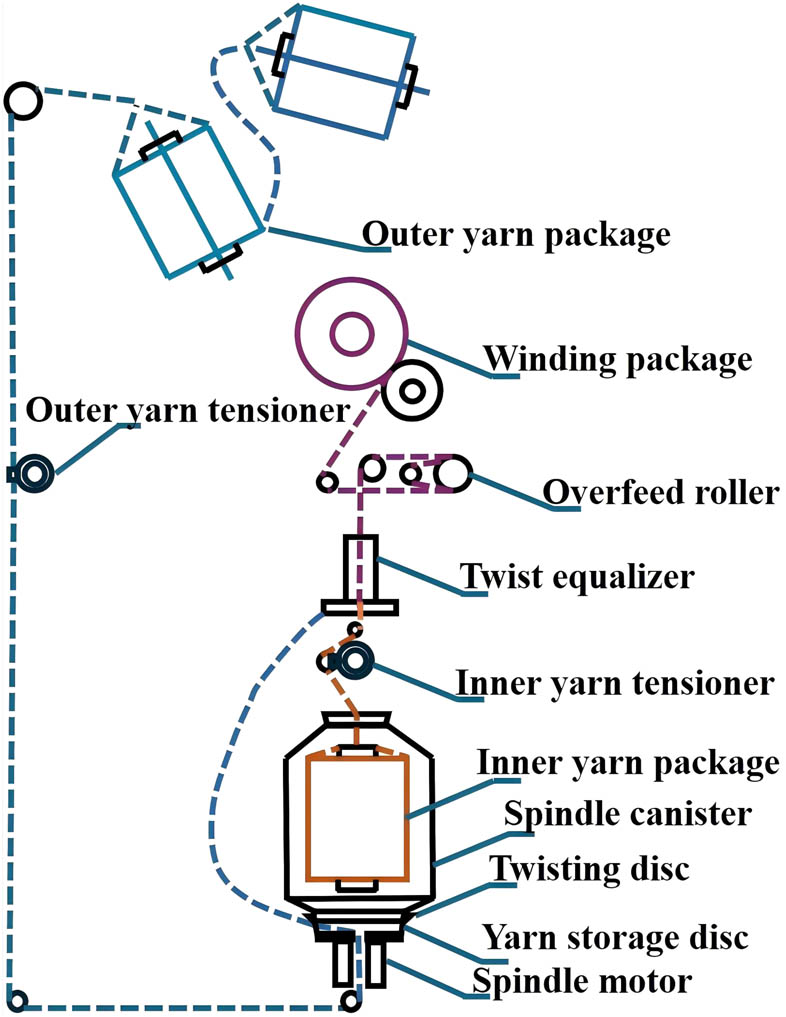
Figure 1
Schematic diagram of the twisting process.
Source: Fu Caizhi. The diagram is derived from the actual experimental direct twisting machines. References are made to Patents CN201110155789, CN202210228767, and CN202310542838.
Table 1
Definition of production variables of straight twisting machine.
| Manufacturing parameter | Parameter interpretation |
|---|---|
| V 1 | Represents the actual operating speed of the spindle during production, measured in revolutions per minute (rpm). |
| P 1 | Represents the ratio of the actual amount of yarn wound during the winding process to the maximum capacity of the package. |
| R 1 | Represents the type of yarn being processed. |
| R 2 | Represents the set rotational speed of the spindle, typically measured in revolutions per minute (rpm). |
| R 3 | Represents the number of twists per unit length of yarn, typically measured in twists per meter (T/m). |
| R 4 | Represents the ratio of the yarn feeding speed by the overfeed roller to the winding speed. An overfeed ratio greater than 1 indicates that the feeding speed is higher than the winding speed, resulting in a relaxed state of the yarn during winding; an overfeed ratio less than 1 indicates that the feeding speed is lower than the winding speed, causing the yarn to be stretched. |
| R 5 and R 6 | Inner yarn tension refers to the pulling force experienced by the yarn inside the direct twisting machine during processing, while outer yarn tension refers to the pulling force on the external yarn. Tension is typically measured in Newtons (N). |
| R 7 and R 8 | Anti-stacking angle refers to the angle between the movement trajectory of the yarn guide and the axis of the yarn package during the winding process in the direct twisting machine. Anti-stacking angle 1 and anti-stacking angle 2 are typically two angle values set during winding stages or under different process requirements. |
| R 9 and R 10 | Anti-stacking length refers to the distance moved by the yarn guide during one reciprocating motion cycle. Anti-stacking length 1 and anti-stacking length 2 are two length values set during winding stages or under different process requirements. |
Source: Fu Caizhi. The table is generated from relevant setting parameters of direct twisting machines obtained from practical experiments.
Table 2
Production process parameter combination.
| No. | R 1/dtex | R 2/rpm | R 3/T/m | R 4/% | R 5/cN | R 6/cN | R 7/° | R 8/° | R 9/mm | R 10/mm |
|---|---|---|---|---|---|---|---|---|---|---|
| #1 | 1,000 | 9,500 | 443 | 300 | 7 | 400 | 17 | 19 | 23 | 7 |
| #2 | 1,300 | 9,200 | 380 | 220 | 8.2 | 600 | 17 | 19 | 23 | 7 |
| #3 | 1,300 | 9,200 | 380 | 250 | 8.2 | 450 | 17 | 19 | 23 | 7 |
| #4 | 1,300 | 9,200 | 280 | 220 | 8.2 | 600 | 17 | 19 | 23 | 7 |
| #5 | 1,500 | 9,000 | 365 | 220 | 9.1 | 700 | 17 | 19 | 23 | 7 |
| #6 | 2,000 | 8,800 | 323 | 220 | 11.2 | 1100 | 17 | 19 | 23 | 7 |
Source: Fu Caizhi. The table is generated from relevant setting parameters of direct twisting machines obtained from practical experiments.
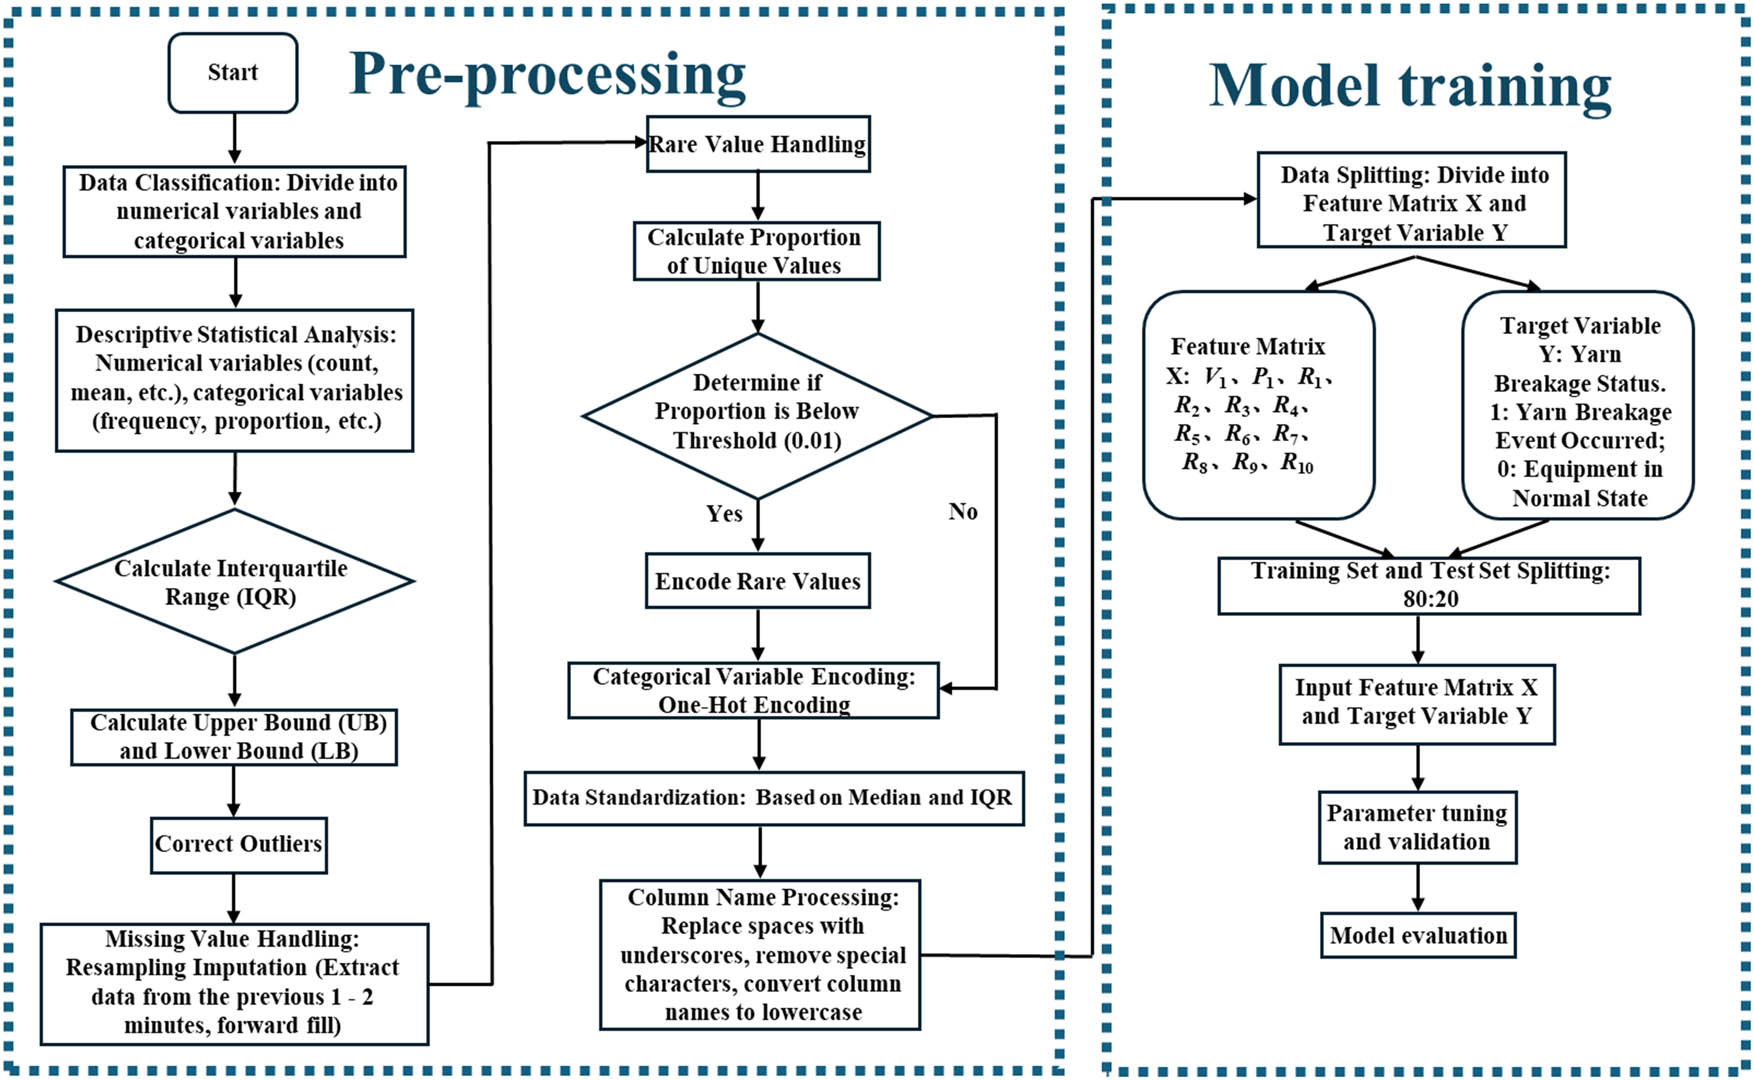
Figure 2
Complete flow chart of data processing and model training.
Source: The figure is constructed based on the sequence of data processing, and it is provided by the author Fu Caizhi.
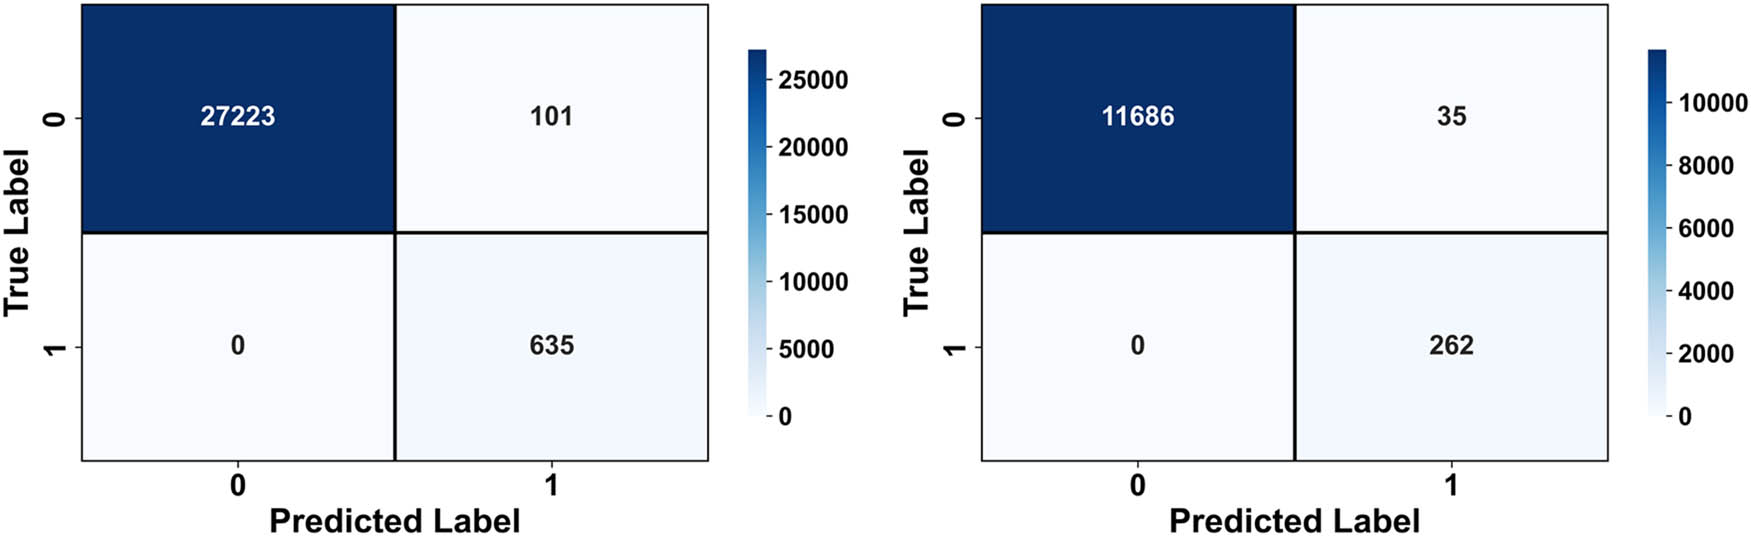
Figure 3
Training set confusion matrix and test set confusion matrix.
Source: The figure is generated from the results of data processing and provided by the author Fu Caizhi.
Table 3
Initial validation of the model.
| Model | Best parameters | Accuracy | Precision | Recall | F1-Score | ROC-AUC |
|---|---|---|---|---|---|---|
| Training set | None | 0.996 | 0.863 | 1 | 0.926 | 1 |
| Test set | None | 0.997 | 0.882 | 1 | 0.937 | 1 |
Source: Fu Caizhi. The table is generated from relevant setting parameters of direct twisting machines obtained from practical experiments.
Table 4
Relevant indicators after model cross-validation.
| Best parameters | Accuracy | Precision | Recall | F1-Score | ROC-AUC | |
|---|---|---|---|---|---|---|
| RF cross validation | None | 0.996 | 0.852 | 1 | 0.926 | 1 |
| Standard deviation | — | 0.001 | 0.015 | 0 | 0.009 | 0 |
Source: Fu Caizhi. The table is generated from relevant setting parameters of direct twisting machines obtained from practical experiments.
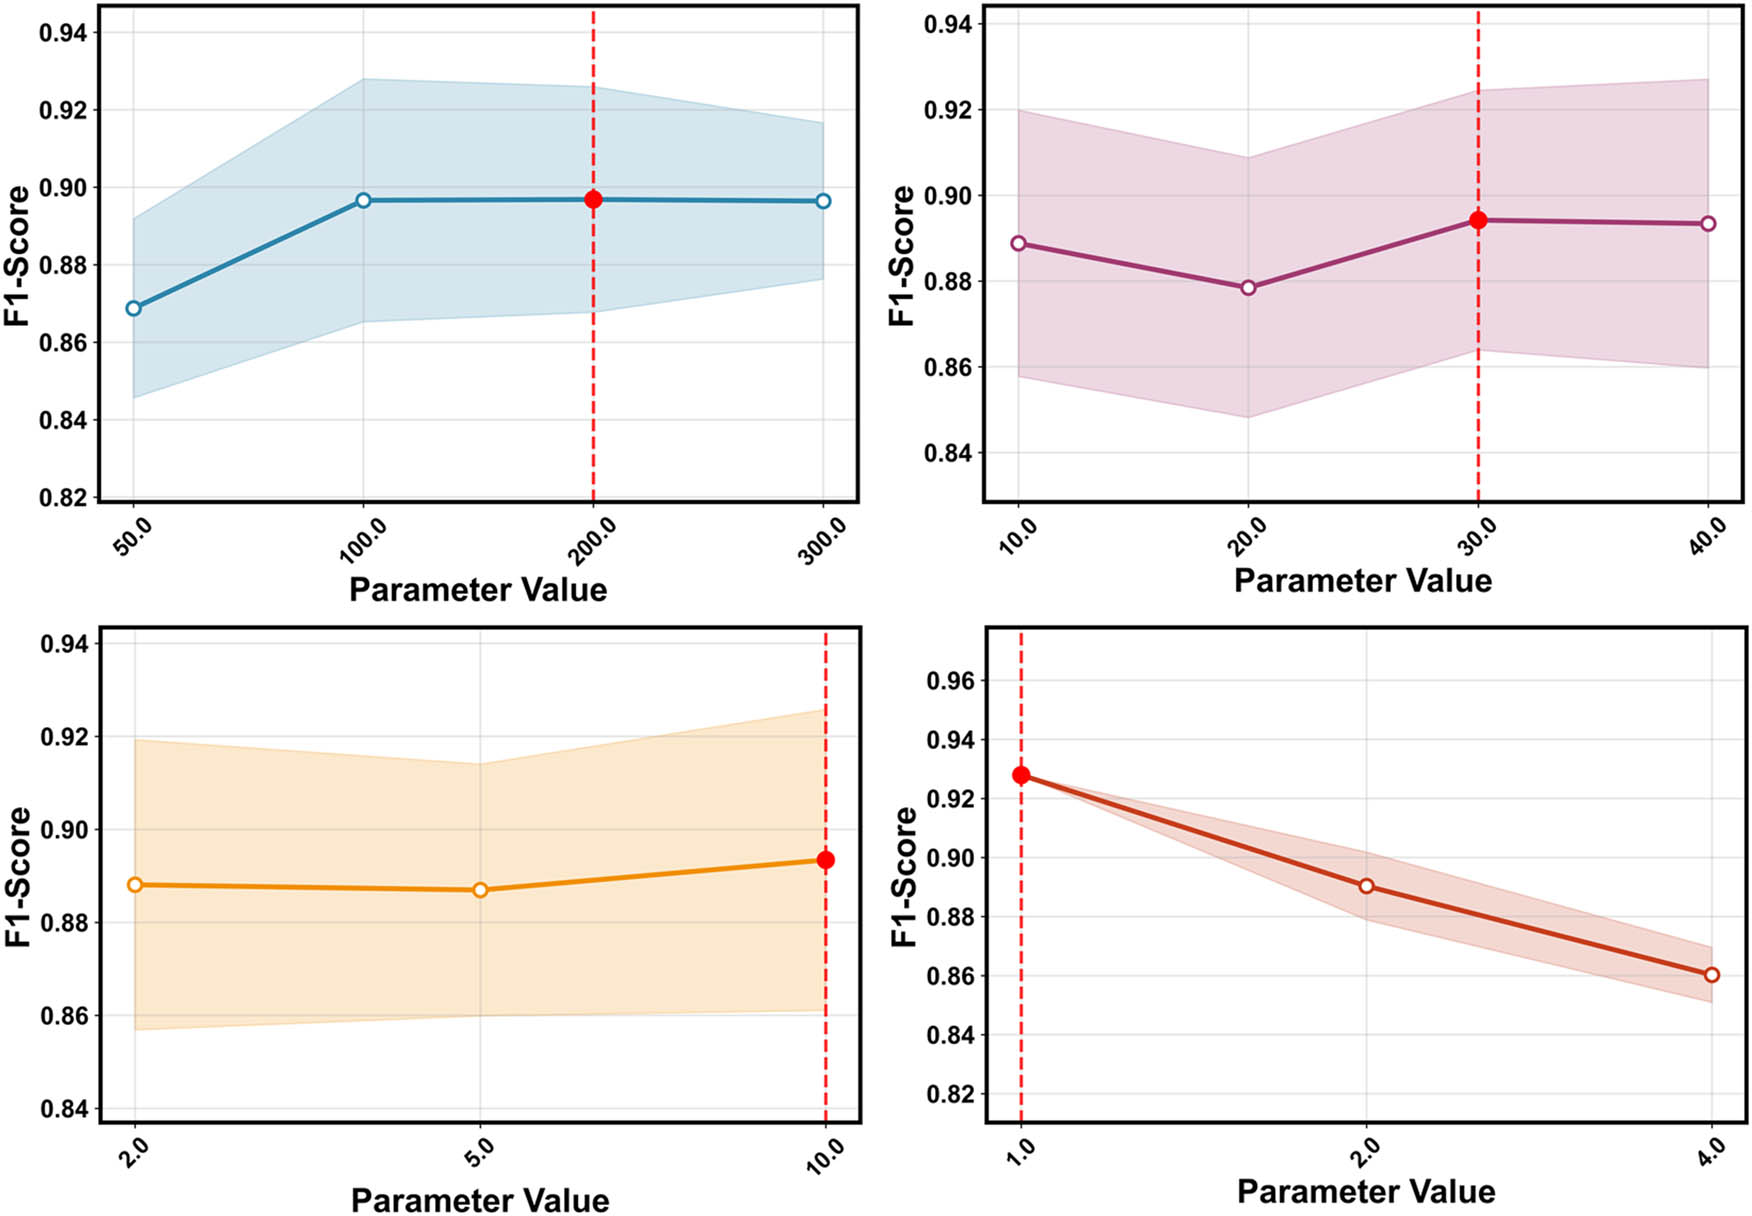
Figure 4
Number of decision trees (n_estimators), maximum depth (max_depth), minimum number of samples required for leaf nodes (min_samples_leaf), minimum number of samples required for internal node splitting influence of different values on model F1-score (from left to right, top to bottom).
Source: The figure is generated from the results of data processing and provided by the author Fu Caizhi.
Table 5
Training results of model after parameter optimization.
| Model | Best parameters | Accuracy | Precision | Recall | F1-Score | ROC-AUC |
|---|---|---|---|---|---|---|
| Training set | {“n_estimators”: 200} | 0.997 | 0.874 | 0.994 | 0.930 | 1 |
| {“max_depth”: 10} | ||||||
| {“min_samples_leaf”: 1} | ||||||
| {“min_samples_splits”: 5} | ||||||
| “class_weight”: {0: 0.51, 1: 22.01} | ||||||
| Test set | {“n_estimators”: 200} | 0.997 | 0.884 | 0.992 | 0.935 | 1 |
| {“max_depth”: 10} | ||||||
| {“min_samples_leaf”: 1} | ||||||
| {“min_samples_splits”: 5} | ||||||
| “class_weight”: {0: 0.51, 1: 22.01} |
Source: The table is generated from the results of data processing and provided by the author Fu Caizhi.
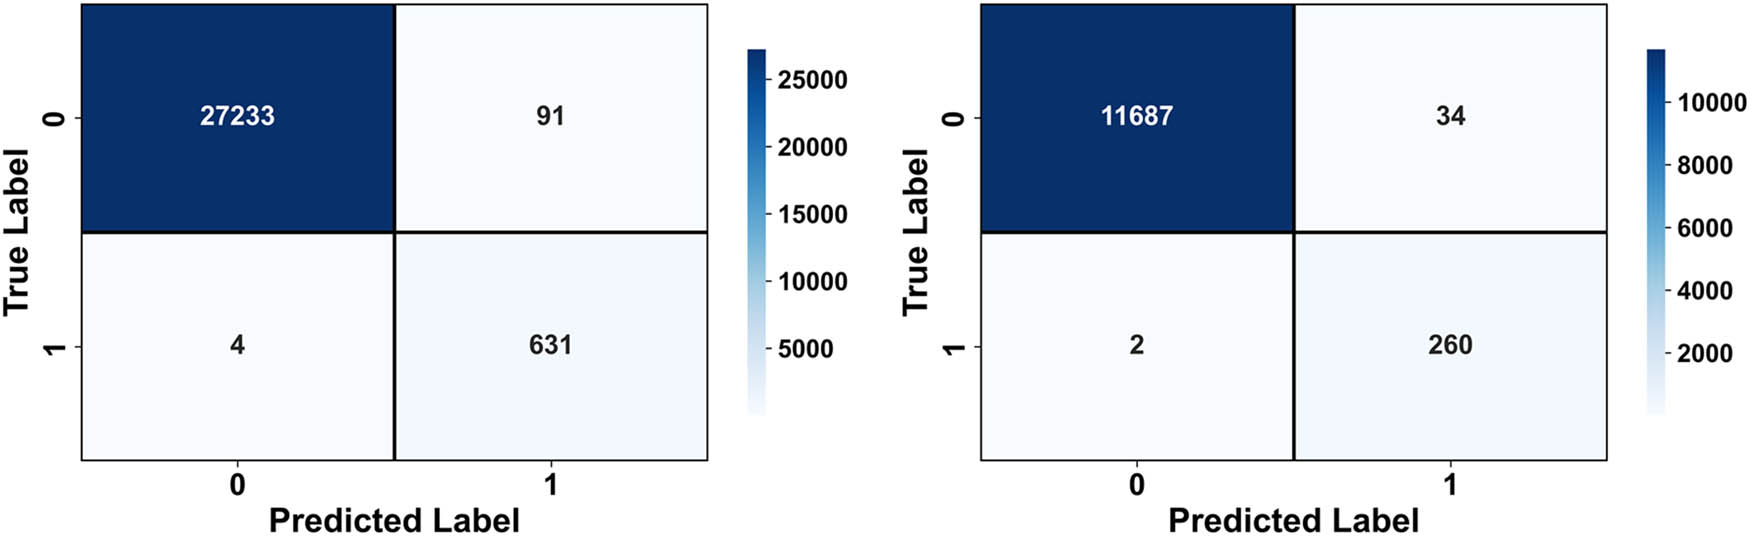
Figure 5
Training set confusion matrix and test set confusion matrix after parameter optimization.
Source: The figure is generated from the results of data processing and provided by the author Fu Caizhi.
Table 6
Predicted vs true values.
| First five rows | Last five rows | ||||||
|---|---|---|---|---|---|---|---|
| Id | Predicted value | True value | Probability | Id | Predicted value | True value | Probability |
| 10250 | 1 | 0 | 0.694 | 32891 | 0.000 | 0.000 | 0.000 |
| 13055 | 1 | 0 | 0.694 | 6258 | 0.000 | 0.000 | 0.000 |
| 29097 | 1 | 1 | 0.985 | 21967 | 0.000 | 0.000 | 0.000 |
| 36502 | 1 | 1 | 1.000 | 32884 | 0.000 | 0.000 | 0.000 |
| 15668 | 1 | 0 | 0.544 | 217 | 0.000 | 0.000 | 0.000 |
Source: The table is generated from the results of data processing and provided by the author Fu Caizhi.
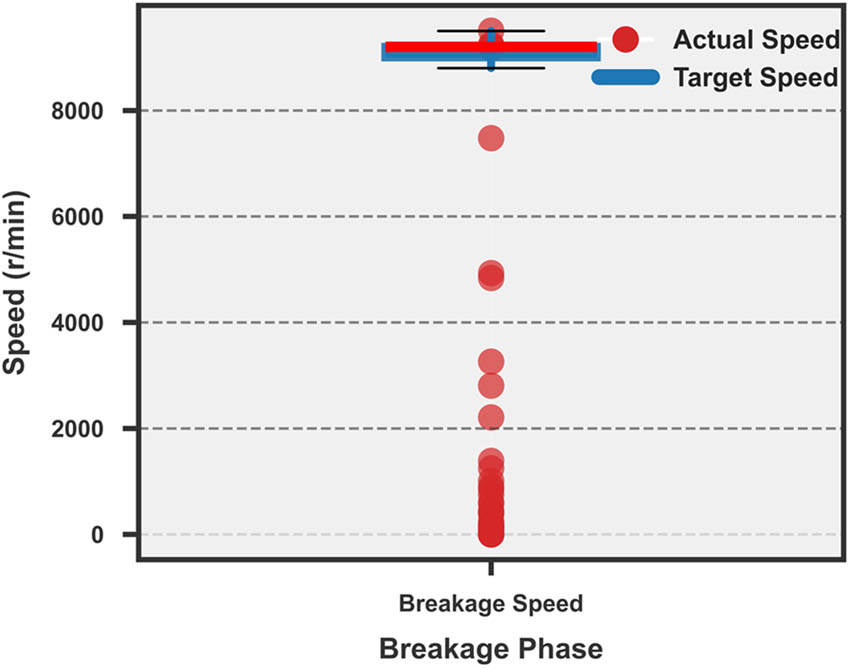
Figure 6
Spindle speed distribution diagram when yarn breaks.
Source: The figure is generated from the results of data processing and provided by the author Fu Caizhi.
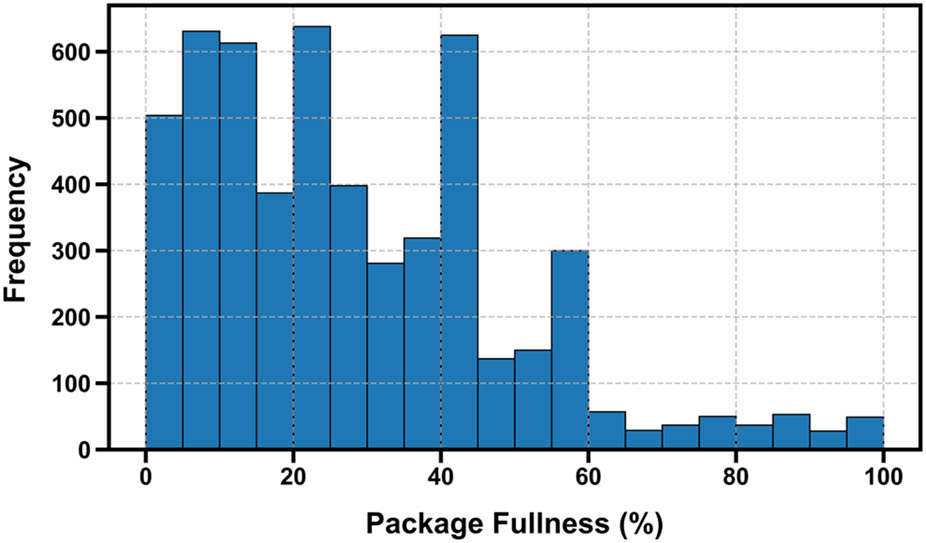
Figure 7
Percentage distribution diagram of winding when yarn breaks.
Source: The figure is generated from the results of data processing and provided by the author Fu Caizhi.
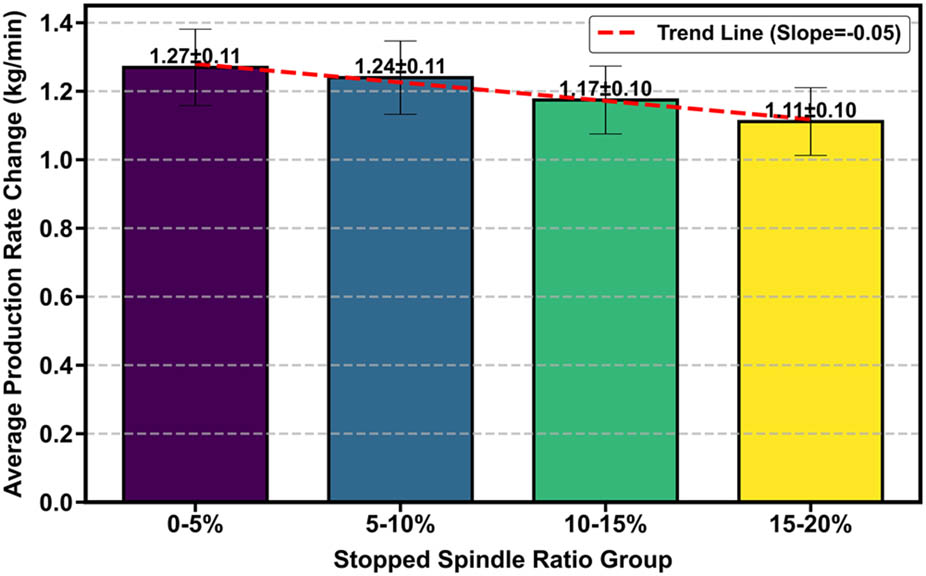
Figure 8
Influence of spindle stoppage on yield per minute.
Source: The figure is generated from the results of data processing and provided by the author Fu Caizhi.
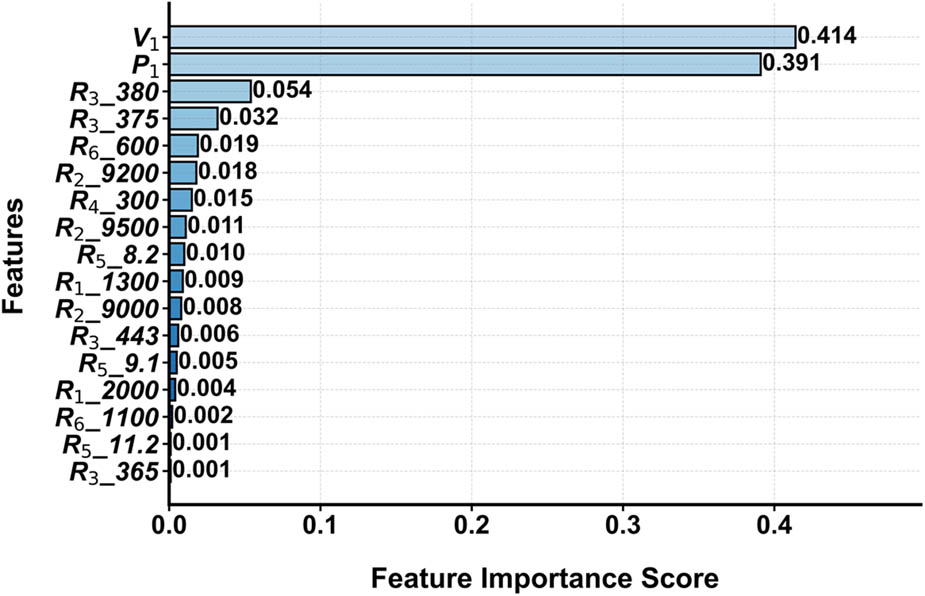
Figure 9
Feature importance ranking.
Source: The figure is generated from the results of data processing and provided by the author Fu Caizhi.
Table 7
Analysis of speed standard deviation before and after yarn breakage (six typical equipment)
| Device | Median velocity/rpm | Standard deviation of speed | IQR (Q 1–Q 3)/rpm | Standard deviation range/rpm |
|---|---|---|---|---|
| D16-L1 | 8803.00 | 73.06 | 8799.00∼8803.00 | 8795.88 ∼ 8810.12 |
| D23-R1 | 8803.00 | 11.18 | 8799.00∼8803.00 | 8795.88 ∼ 8810.12 |
| D24-L1 | 9503.00 | 7.88 | 9499.00∼9503.00 | 9495.33 ∼ 9510.67 |
| D48-L1 | 9003.00 | 110.96 | 8999.00∼9003.00 | 8995.73 ∼ 9010.27 |
| D71-R1 | 9200.00 | 142.31 | 9200.00∼9203.00 | 9192.57 ∼ 9207.43 |
| D72-L1 | 9200.00 | 27.78 | 9200.00∼9203.00 | 9192.57 ∼ 9207.43 |
Source: The table is generated from the results of data processing and provided by the author Fu Caizhi.
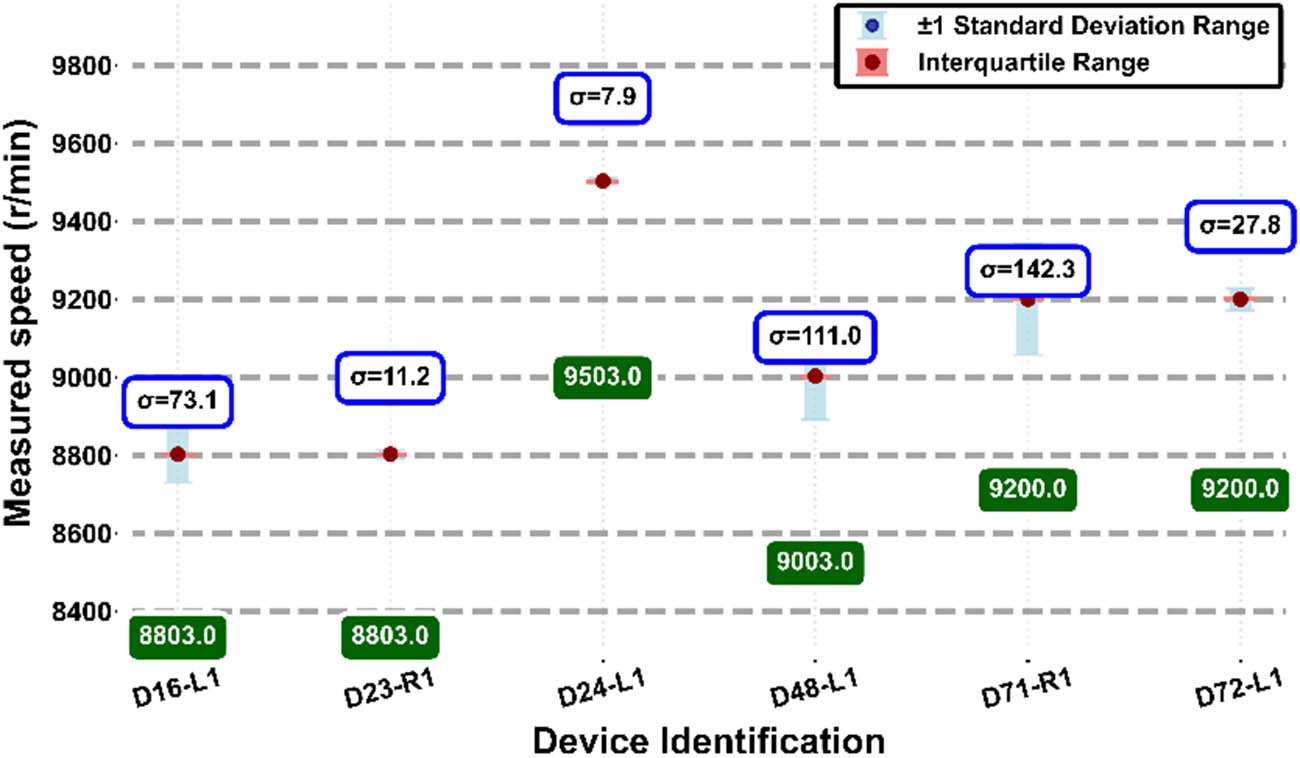
Figure 10
Comparison of actual speed to target speed (top six devices).
Source: The figure is generated from the results of data processing and provided by the author Fu Caizhi.
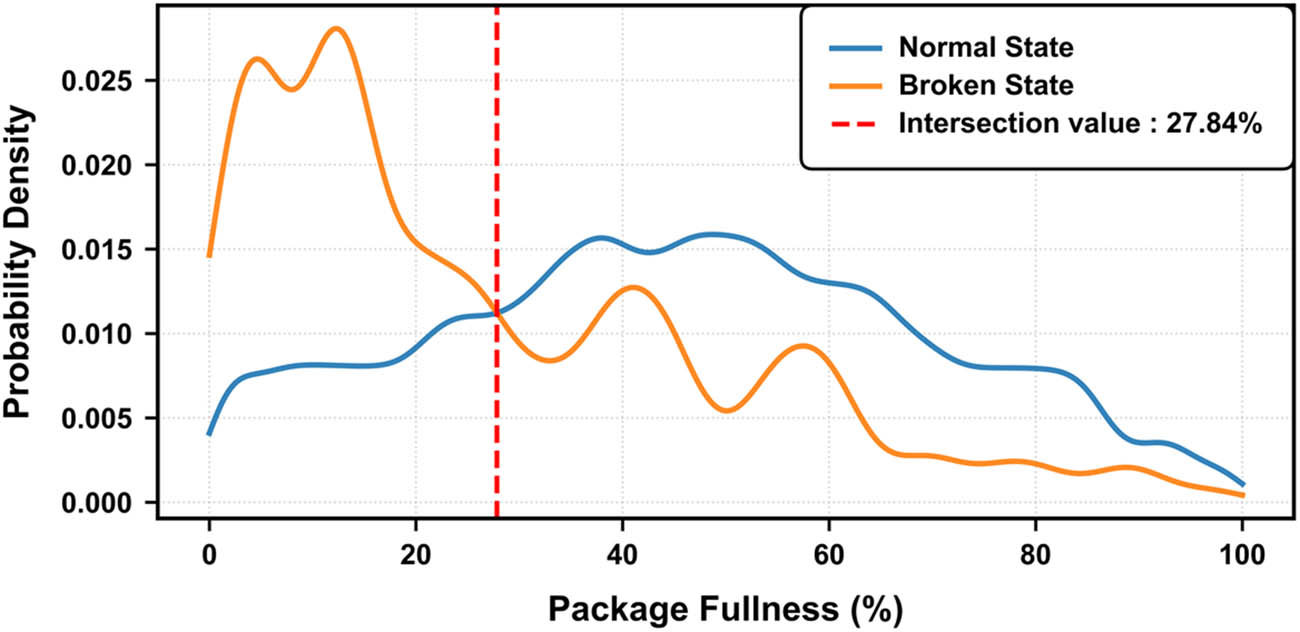
Figure 11
Analysis of winding percentage between normal state and broken yarn state (top six devices).
Source: The figure is generated from the results of data processing and provided by the author Fu Caizhi.
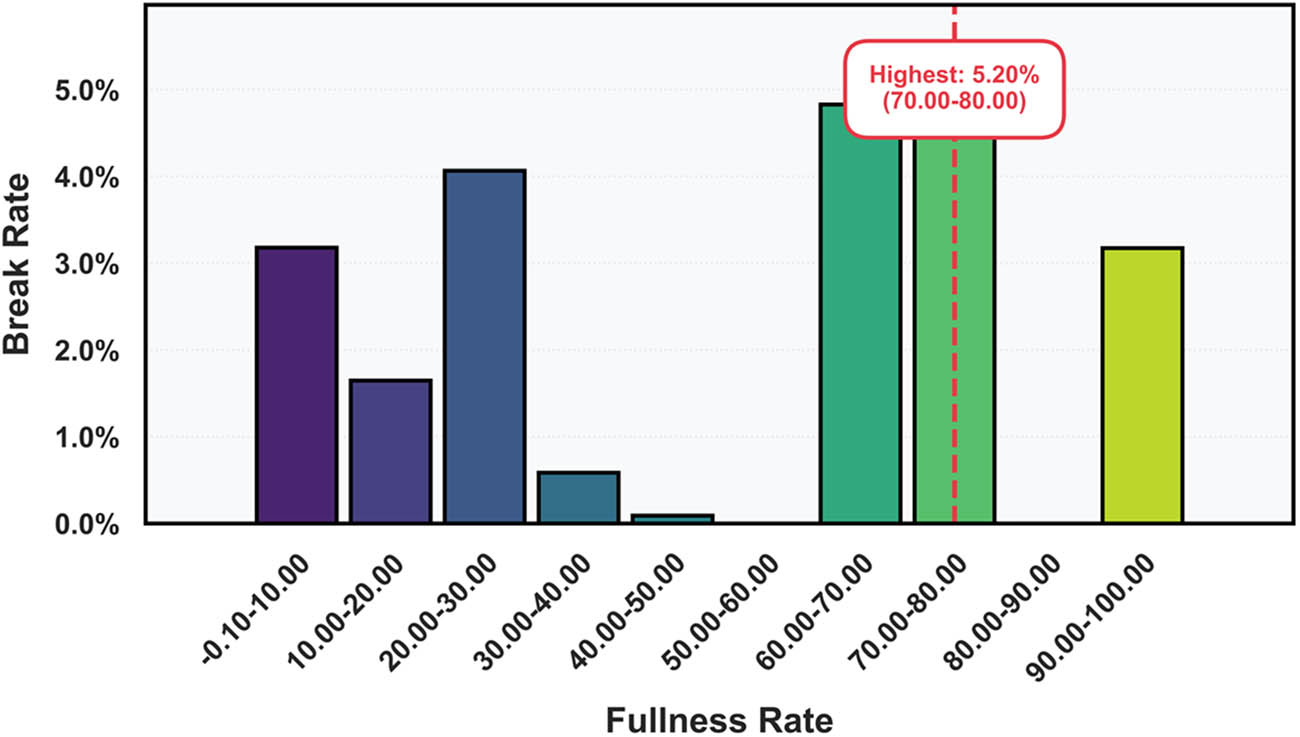
Figure 12
Effect of winding percentage on yarn break rate (all devices).
Source: The figure is generated from the results of data processing and provided by the author Fu Caizhi.
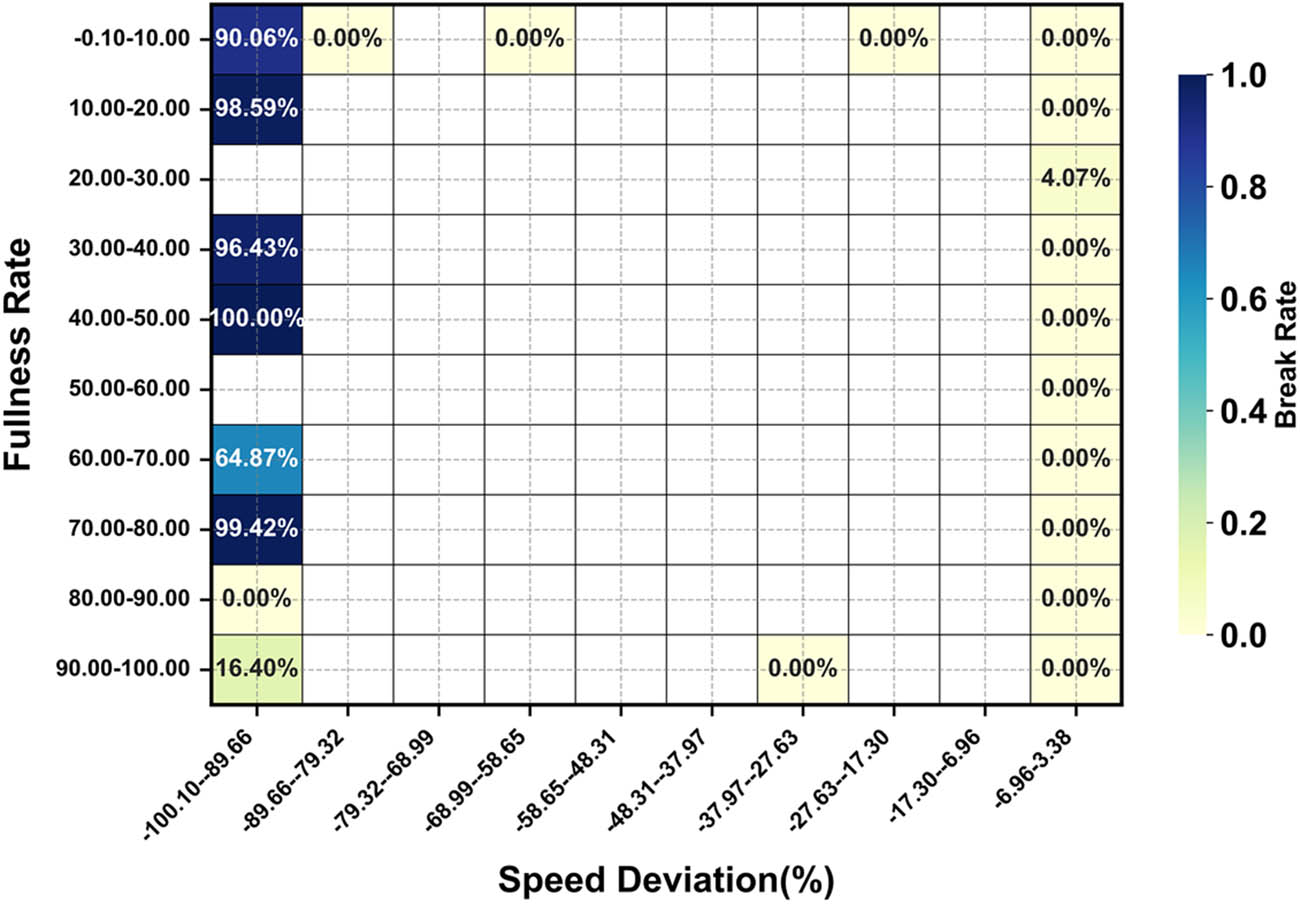
Figure 13
Interaction effect of fullness × speed deviation (%) on yarn break rate.
Source: The figure is generated from the results of data processing and provided by the author Fu Caizhi.
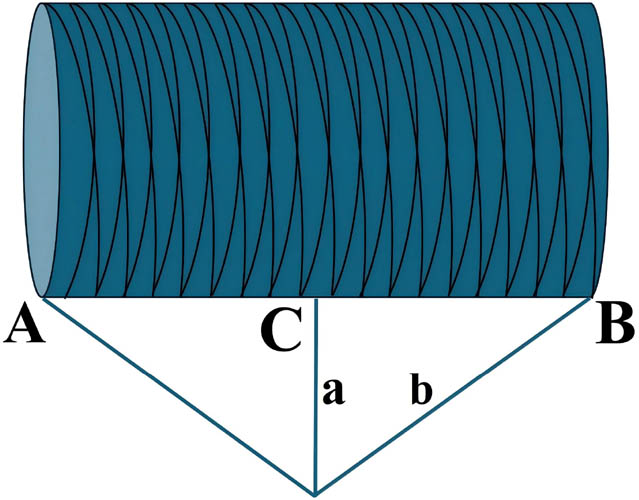
Figure 14
Motion of curling mechanism.
Source: The figure data originate from the angle settings adopted during yarn package winding, and the figure are provided by the author Fu Caizhi.