
1. Introduction
The direct cabling machine primarily performs the twisting function in the production process of tire cord or industrial yarn. Yarn breakage during twisting not only causes structural defects in the tire cord, such as uneven twist and knots, thereby affecting the service life of end products like tires and conveyor belts, but also leads to a series of issues including raw material waste, frequent machine stoppages, and increased energy consumption. Studying yarn breakage patterns can optimize production parameters, reduce unplanned downtime, and lower production costs. However, existing literature on direct cabling machines mostly focuses on other metrics, such as the development of breakage and tension detection devices [1], analysis of balloon morphology and yarn tension [2, 3, 4], upper yarn exploration [5, 6], twisting methods [7], motor heat treatment [8], mechanical device studies [9], causes of yarn defects, or energy consumption analysis [10, 11, 12]. There is relatively little systematic research on yarn breakage in direct cabling machines dedicated to tire cord fabric under industrial environments, and a dedicated analytical framework and optimization strategy for breakage control in industrial yarns has not yet been established. Traditional direct cabling machines have significant drawbacks in handling yarn breakage, relying heavily on manual intervention. Manual monitoring is not only inefficient but also struggles to achieve real-time and accurate detection of breakage, leading to substantial production of defective products and wasted time costs.
Integrating textile scenarios with machine learning algorithms can further uncover complex patterns within data. Existing research has demonstrably optimized textile processes and enhanced material properties [13, 14, 15, 16, 17]. Yangyun et al. utilized support vector egression and radial basis function neural networks, integrated with gradient boosting decision trees, for quantitative analysis of yarn defects [18]. Chien-Chun Ku et al. employed a UNISON framework integrating fuzzy decision trees to optimize dyeing machine scheduling, reducing makespan and water consumption [19]. He Zhenglei et al. developed a multi-criteria decision support system that combines DRL with RF, integrated with the AHP, to optimize the manufacturing process of textile chemicals, significantly improving decision-making efficiency [20]. Based on the above, this study, under the premise of default factory process parameter settings, shifts the focus from further fine-tuning of macro-parameters to an in-depth analysis of other potential influencing factors. It explores the correlation between these factors and the yarn breakage rate in an industrial environment and establishes a key factor weight model. By collecting and analyzing production data, data characteristics from high breakage frequency periods are extracted to accurately identify breakage causes, forming the basis for proposing targeted process optimization strategies.
The remaining structure of this study is arranged as follows: Section 2 elaborates on the definition of relevant variables in the direct cabling machine twisting process and their combinatorial design, and details the modeling process and evaluation metrics of the RF classification model for the yarn breakage problem. Section 3 first provides a preliminary evaluation of the model, then further enhances model performance through parameter optimization and cross-validation. Simultaneously, it compares feature extraction results with model analysis results, conducts an in-depth analysis of the two main influencing factors for yarn breakage, and proposes corresponding control ranges. Section 4 summarizes the main findings of this study and outlines future research directions.
2. Data and Methods
2.1. Variable Definition and Process Combination
During the twisting process of the direct cabling machine, as shown in Figure 1, the outer yarn is unwound from the package bobbin and passes through the yarn storage disk, twisting disk, and rotating spindle, eventually forming a yarn balloon configuration via the yarn equalizing device. Simultaneously, the inner yarn is unwound from its package bobbin and adjusted to the predetermined tension by the inner yarn tension device. Subsequently, the outer and inner yarns converge within the yarn equalizing device, forming a yarn with specific twist characteristics. The twisted yarn then enters the overfeed device for speed adjustment to achieve stable running conditions, and is finally wound into a package by the take-up assembly.
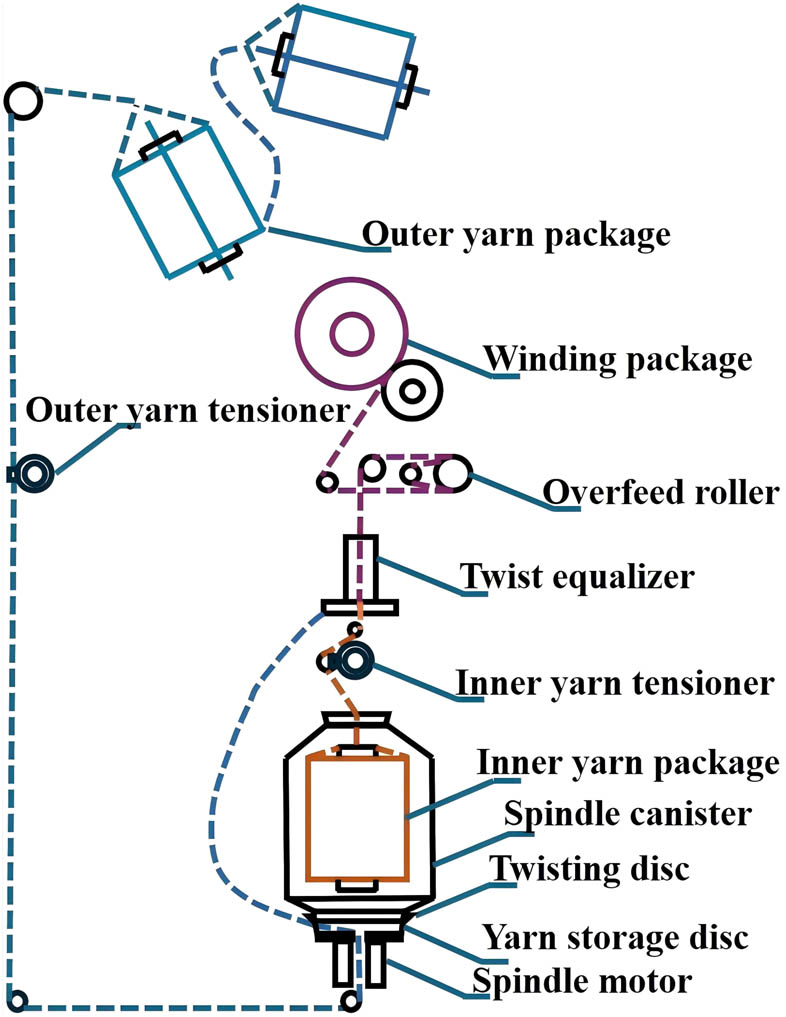
Figure 1
Schematic diagram of the twisting process.
Source: Fu Caizhi. The diagram is derived from the actual experimental direct twisting machines. References are made to Patents CN201110155789, CN202210228767, and CN202310542838.
2.2. Variable Definition and Process Combination
The key production parameters of the aforementioned twisting process primarily include: actual spindle operating speed (V 1), package build percentage (P 1), yarn specification (R 1), set spindle speed (R 2), twist level (R 3), overfeed ratio (R 4), inner yarn tension (R 5), outer yarn tension (R 6), anti-patterning angle 1 (R 7), anti-patterning angle 2 (R 8), anti-patterning length 1 (R 9), and anti-patterning length 2 (R 10). Table 1 provides the corresponding parameter descriptions.
Table 1
Definition of production variables of straight twisting machine.
| Manufacturing parameter | Parameter interpretation |
|---|---|
| V 1 | Represents the actual operating speed of the spindle during production, measured in revolutions per minute (rpm). |
| P 1 | Represents the ratio of the actual amount of yarn wound during the winding process to the maximum capacity of the package. |
| R 1 | Represents the type of yarn being processed. |
| R 2 | Represents the set rotational speed of the spindle, typically measured in revolutions per minute (rpm). |
| R 3 | Represents the number of twists per unit length of yarn, typically measured in twists per meter (T/m). |
| R 4 | Represents the ratio of the yarn feeding speed by the overfeed roller to the winding speed. An overfeed ratio greater than 1 indicates that the feeding speed is higher than the winding speed, resulting in a relaxed state of the yarn during winding; an overfeed ratio less than 1 indicates that the feeding speed is lower than the winding speed, causing the yarn to be stretched. |
| R 5 and R 6 | Inner yarn tension refers to the pulling force experienced by the yarn inside the direct twisting machine during processing, while outer yarn tension refers to the pulling force on the external yarn. Tension is typically measured in Newtons (N). |
| R 7 and R 8 | Anti-stacking angle refers to the angle between the movement trajectory of the yarn guide and the axis of the yarn package during the winding process in the direct twisting machine. Anti-stacking angle 1 and anti-stacking angle 2 are typically two angle values set during winding stages or under different process requirements. |
| R 9 and R 10 | Anti-stacking length refers to the distance moved by the yarn guide during one reciprocating motion cycle. Anti-stacking length 1 and anti-stacking length 2 are two length values set during winding stages or under different process requirements. |
Source: Fu Caizhi. The table is generated from relevant setting parameters of direct twisting machines obtained from practical experiments.
To systematically analyze the yarn breakage phenomenon in polyester filaments, in this study, based on the twisting process parameters and actual production conditions, four polyester filaments with linear densities of 1,000, 1,300, 1,500, and 2,000 dtex were selected. The direct cabling machine model used was K3501B. The parameters for anti-patterning angle 1, anti-patterning angle 2, anti-patterning length 1, and anti-patterning length 2 were set to single fixed values. The input variables and their values were determined based on the factory’s routine production and process control practices. Yarn type and linear density were specified by production orders, while the set spindle speed, twist level, overfeed ratio, and inner and outer yarn tensions were configured according to the established production recipes for different yarn specifications. These coordinated settings were developed through long-term production practice to balance product quality, equipment capability, and production efficiency. Accordingly, six process parameter combinations were adopted, as shown in Table 2, and production was conducted sequentially according to the factory order schedule. Process parameters and yarn breakage records were collected through real-time sensors and the motor control system. Approximately 40,000 samples were obtained from specific spindle positions during a 12-h production shift for subsequent analysis and evaluation.
Table 2
Production process parameter combination.
| No. | R 1/dtex | R 2/rpm | R 3/T/m | R 4/% | R 5/cN | R 6/cN | R 7/° | R 8/° | R 9/mm | R 10/mm |
|---|---|---|---|---|---|---|---|---|---|---|
| #1 | 1,000 | 9,500 | 443 | 300 | 7 | 400 | 17 | 19 | 23 | 7 |
| #2 | 1,300 | 9,200 | 380 | 220 | 8.2 | 600 | 17 | 19 | 23 | 7 |
| #3 | 1,300 | 9,200 | 380 | 250 | 8.2 | 450 | 17 | 19 | 23 | 7 |
| #4 | 1,300 | 9,200 | 280 | 220 | 8.2 | 600 | 17 | 19 | 23 | 7 |
| #5 | 1,500 | 9,000 | 365 | 220 | 9.1 | 700 | 17 | 19 | 23 | 7 |
| #6 | 2,000 | 8,800 | 323 | 220 | 11.2 | 1100 | 17 | 19 | 23 | 7 |
Source: Fu Caizhi. The table is generated from relevant setting parameters of direct twisting machines obtained from practical experiments.
2.3. Data Processing and Model Training
When analyzing the relationship between production parameters and yarn breakage, the data include numerical, categorical, and mixed-type variables, which are often presented as combinations of production parameters, making it difficult to clearly distinguish the influence of each parameter on yarn breakage. Therefore, before model training, this study systematically preprocessed the data, with the main steps as follows:
(1) Data classification and descriptive statistics: The variables in the dataset were divided into numerical variables (V 1, P 1) and categorical variables (R 1, R 2, R 3, R 4, R 5, R 6, R 7, R 8, R 9, R 10). For numerical variables, descriptive statistical analysis was performed, including count, mean value, standard deviation, minimum, maximum, and specified quantiles. For categorical variables, frequency and proportion analysis were conducted to count the occurrence frequency and proportion of each category [21, 22, 23]. For example, the frequency and proportion of (R 1) being 1,000 dtex in the entire dataset were calculated.
(2) Outlier handling: Outliers were identified using the quantile method to calculate upper and lower limits. Specifically, the interquartile range (IQR) for each column was calculated as the difference between the third quartile and the first quartile (Q 3–Q 1), where Q 1 represents the value below which 25% of the data points lie, and Q 3 represents the value below which 75% of the data points lie. The upper limit was set as the third quartile plus 1.5 times the IQR, and the lower limit was set as the first quartile minus 1.5 times the IQR. Values exceeding these limits were adjusted to the upper or lower limit values.
where Q 3 represents the third quartile, Q 1 represents the first quartile, UB represents the upper limit, and LB represents the lower limit. Outlier handling primarily focuses on the numerical variables V 1 and P 1.
(3) Missing value handling: For time-related missing values, data within the range of 1–2 min before the corresponding timestamp of the missing data point is extracted, and resampling is performed. The missing values are then filled using the forward fill method. For numerical variables (V 1, P 1), data from 1 to 2 min before the missing values are extracted, and interpolation is performed based on the time interval to generate new data points, which are used to fill the missing values. For categorical variables (R 1, R 2, R 3, R 4, R 5, R 6, R 7, R 8, R 9, R 10), since their values are typically preset, specific parameters remain unchanged in the short term, the previous valid value was directly used for filling.
(4) Rare value handling: The proportion of each unique value in the categorical variables was calculated, and a rare value threshold of 0.01 was set to identify rare values. Unique values with proportions below the threshold were stored and encoded to reduce their impact on the model. Rare value handling mainly targeted categorical variables (R 1, R 2, R 3, R 4, R 5, R 6, R 7, R 8, R 9, R 10). Through data analysis, it was found that although specific values of certain categorical variables, such as “380 T/m” in R 3 and “220%” in R 4, occupy a relatively small proportion in the entire dataset, their proportions do not fall below the set threshold of 0.01. Therefore, in the current dataset, no categorical variables are identified as rare values.
(5) Categorical variable encoding: One-hot encoding was used to convert categorical variables into numerical data. For example, the categorical variables [“A,” “B,” “C”] were encoded as [1, 0, 0], [0, 1, 0], and [0, 0, 1], respectively, to avoid misinterpretation caused by numerical magnitude. The final encoding format was presented as “parameter variable_set value,” such as R 1_1000.
(6) Data standardization: All numerical variables (V 1 , P 1) were standardized based on the median and IQR to mitigate the impact of outliers. The standardization formula is as follows:
(7) Column name normalization: Standardization was performed on column names by replacing spaces with underscores, using regular expressions to remove special characters except letters, numbers, and underscores, and converting all column names to lowercase to ensure their standardization and consistency.
After completing data preprocessing, standardization, and encoding, model training and performance evaluation were conducted. The main steps include:
(1) Target variable (Y) extraction: Based on the operational status of 100 spindles (D1–D100) on the equipment, the yarn breakage status is identified and labeled. According to the spindle status definitions, the status value “3” explicitly denotes yarn breakage, whereas other status values, including 0: spindle halt, 1: initiation, 2: full package, 5: overheating, 6: speed loss, 7: yarn slippage, and 11: abnormality, are categorized as non-yarn breakage statuses. Consequently, the yarn breakage status corresponding to the status value of 3 is encoded as 1, while all other statuses are uniformly encoded as 0, thereby constructing a binary classification target variable.
(2) Feature and target variable division: Redundant columns in the dataset were removed, and the preprocessed data were divided into the feature matrix (X) and the target variable (Y). The feature matrix (X) includes V1, P 1, R 1, R 2, R 3, R 4, R 5, R 6, R 7, R 8, R 9, R 10. The target variable (Y) represents the yarn status of the spindle position.
(3) Division of training set and test set: In the dataset partitioning process, as the six specific process combinations were recorded sequentially according to production order, time-based data splitting methods struggle to adequately capture the overall distribution characteristics of the data. To ensure that the model comprehensively learns the data characteristics under different process combinations, this study adopts a stratified random sampling strategy, dividing the overall dataset into training and test sets in a 80:20 ratio. The specific implementation was accomplished by calling the “train_test_split” function, where the feature matrix X and target variable Y were partitioned into the training set (X_train, Y_train) and the test set (X_test, Y_test). The parameter “test_size” was set to 0.2, indicating the test set accounts for 20% of the dataset, while the random seed (“random_state”) was fixed at 17 to ensure the reproducibility of the splitting process and consistency of the results.
(4) Model selection: The RF classification model was employed to analyze the yarn breakage issue in direct cabling corder. RF is a nonlinear model based on ensemble learning, composed of multiple decision trees. By combining multiple weak learners, it enhances prediction accuracy and stability. It adopts a voting mechanism for decision-making, where each decision tree independently predicts the sample, and the final classification result is determined by majority voting. By adjusting the depth and number of decision trees, the model can fully exploit data information while avoiding overfitting. Additionally, RF can leverage feature importance assessment to precisely identify key production parameters significantly influencing yarn breakage.
(5) Parameter tuning and validation: The RF model’s parameters – number of decision trees (n_estimators), maximum depth (max_depth), minimum samples required at a leaf node (min_samples_leaf), and minimum samples required to split an internal node (min_samples_split) – were optimized through equipment-based fivefold cross-validation. Simultaneously, class weights were applied to balance yarn breakage and non-breakage samples, thereby enhancing model performance and accuracy. The final optimized parameters were determined as: maximum tree depth of 10, number of trees set to 200, minimum samples per leaf node as 1, minimum samples required for node splitting as 5, with a class weight ratio of 0.51:22.01 between normal events and yarn breakage events.
(6) Model performance evaluation: A fivefold cross-validation method was adopted to evaluate the model s performance. Evaluation metrics included Accuracy, Precision, Recall, F1-Score, Receiver Operating Characteristic–Area Under the Curve (ROC-AUC), and model execution time. Here, the ROC curve refers to the Receiver Operating Characteristic curve. The corresponding formulas are as follows:
Accuracy measures the overall correctness of the model’s predictions. Precision focuses on the accuracy of the model’s predictions for the positive class. Recall represents the proportion of samples correctly identified as a certain class out of the actual samples of that class, and is used to measure the model’s coverage capability in identifying yarn breakage situations. The F1-Score is the harmonic mean of Precision and Recall, comprehensively evaluating the model’s balanced performance across different classes. The ROC curve is plotted with the false positive rate on the x-axis and the true positive rate on the y-axis, connecting points corresponding to different thresholds. The ROC-AUC is the area under the ROC curve, which comprehensively reflects the model’s overall ability to distinguish between positive and negative samples. The complete flow of data processing and model training described above is shown in Figure 2.
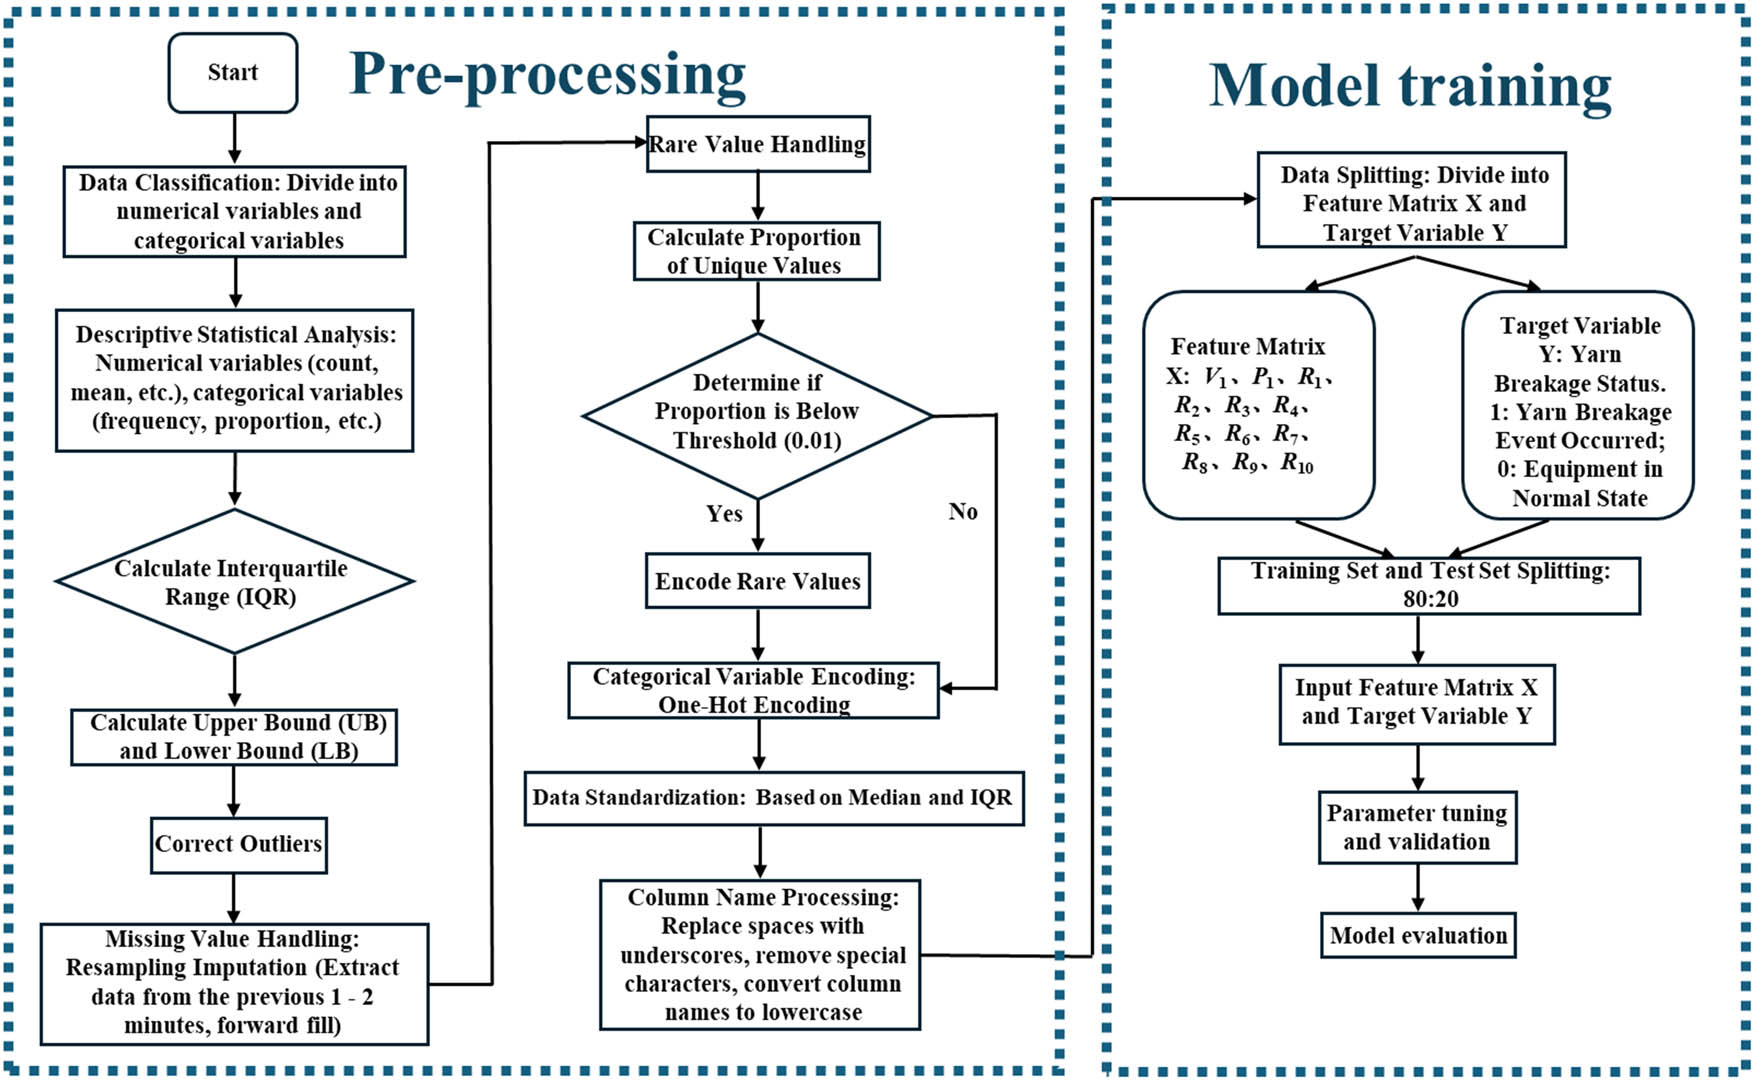
Figure 2
Complete flow chart of data processing and model training.
Source: The figure is constructed based on the sequence of data processing, and it is provided by the author Fu Caizhi.
3. Results and Discussion
3.1. Preliminary Model Evaluation
In the preliminary model evaluation, the training set contained 635 yarn breakage events, accounting for 2.23% of the set; the test set contained 262 breakage events, accounting for 2.19%. The prediction proportions of each category in the confusion matrix for the training set are shown in Figure 3, and the performance evaluation results are presented in Table 3. Quantitative evaluation metrics show that the test set achieved an Accuracy of 0.997, Precision of 0.882, Recall of 1, F1-Score of 0.937, and an ROC-AUC value of 1, indicating high accuracy and reliability of the model. The RF model, by virtue of its ability to effectively handle high-dimensional feature data and reduce overfitting risk through its ensemble learning mechanism, demonstrated preliminary capabilities in discerning and interpreting data feature relationships during the initial fitting operation on the target dataset. This further validates the applicability and effectiveness of the RF model for this task.
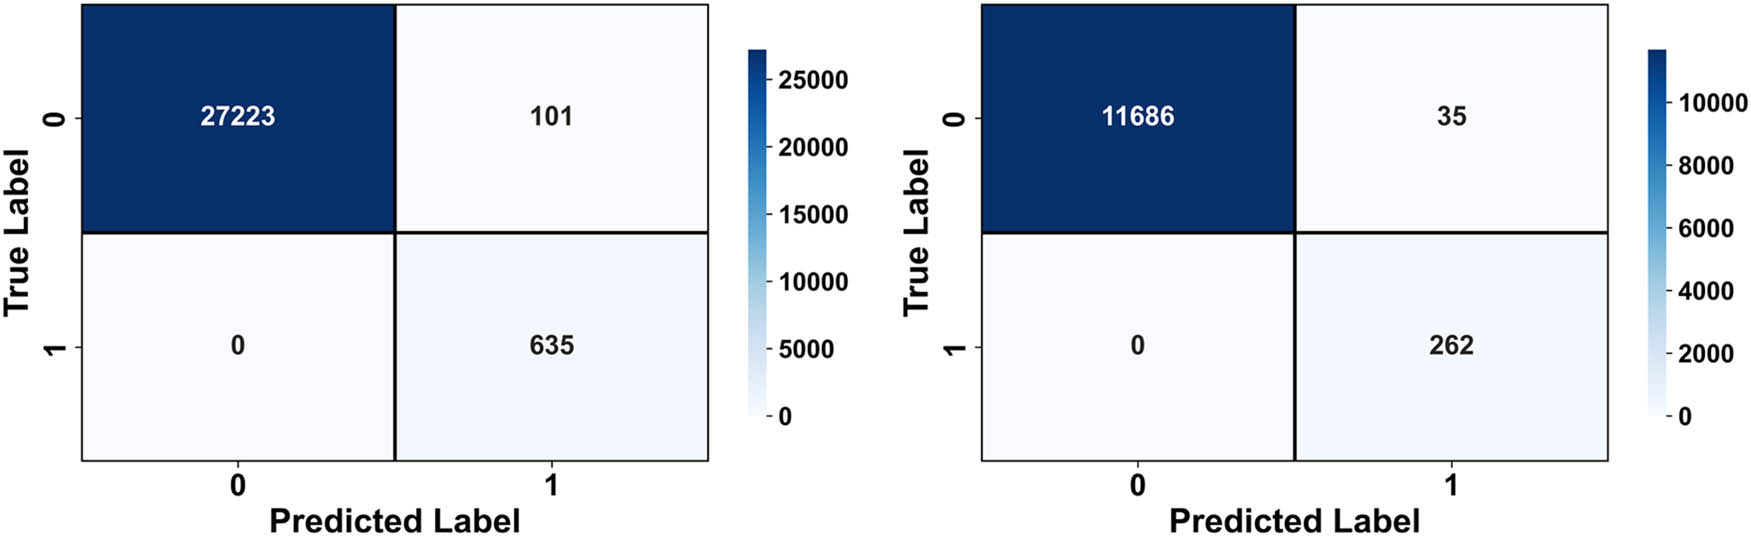
Figure 3
Training set confusion matrix and test set confusion matrix.
Source: The figure is generated from the results of data processing and provided by the author Fu Caizhi.
3.2. Cross-validation and Hyperparameter Optimization
Cross-validation was performed on the training set to ensure model robustness while preventing overfitting. The cross-validation process partitioned the training set into fivefold [23], iteratively using fourfold for training and onefold for validation. The model performance metrics and their standard deviation intervals obtained through cross-validation are presented in Table 4.
Table 4
Relevant indicators after model cross-validation.
| Best parameters | Accuracy | Precision | Recall | F1-Score | ROC-AUC | |
|---|---|---|---|---|---|---|
| RF cross validation | None | 0.996 | 0.852 | 1 | 0.926 | 1 |
| Standard deviation | — | 0.001 | 0.015 | 0 | 0.009 | 0 |
Source: Fu Caizhi. The table is generated from relevant setting parameters of direct twisting machines obtained from practical experiments.
Based on the cross-validation results, hyperparameter tuning was performed on the RF model. A hyperparameter grid was established with the following values: number of decision trees (n_estimators) set to [50, 100, 200, 300], maximum depth (max_depth) set to [10, 20, 30, 40], minimum samples required at a leaf node (min_samples_leaf) set to [1, 2, 4], and minimum samples required to split an internal node (min_samples_split) set to [2, 5, 10]. By iterating through all combinations in the hyperparameter grid and employing fivefold cross-validation [24], class weights (class_weight = “balanced”) were applied to balance the yarn breakage and non-breakage samples. Subsequently, the parameter values were determined based on the influence trends of different parameter settings on the model’s F1-Score, with the impact results shown in Figure 4. The final selected parameters were: maximum tree depth of 10, number of trees set to 200, minimum samples per leaf node as 1, and minimum samples required for node splitting as 5. The performance evaluation metrics of the optimized model are presented in Table 5, and the corresponding confusion matrix is shown in Figure 5.
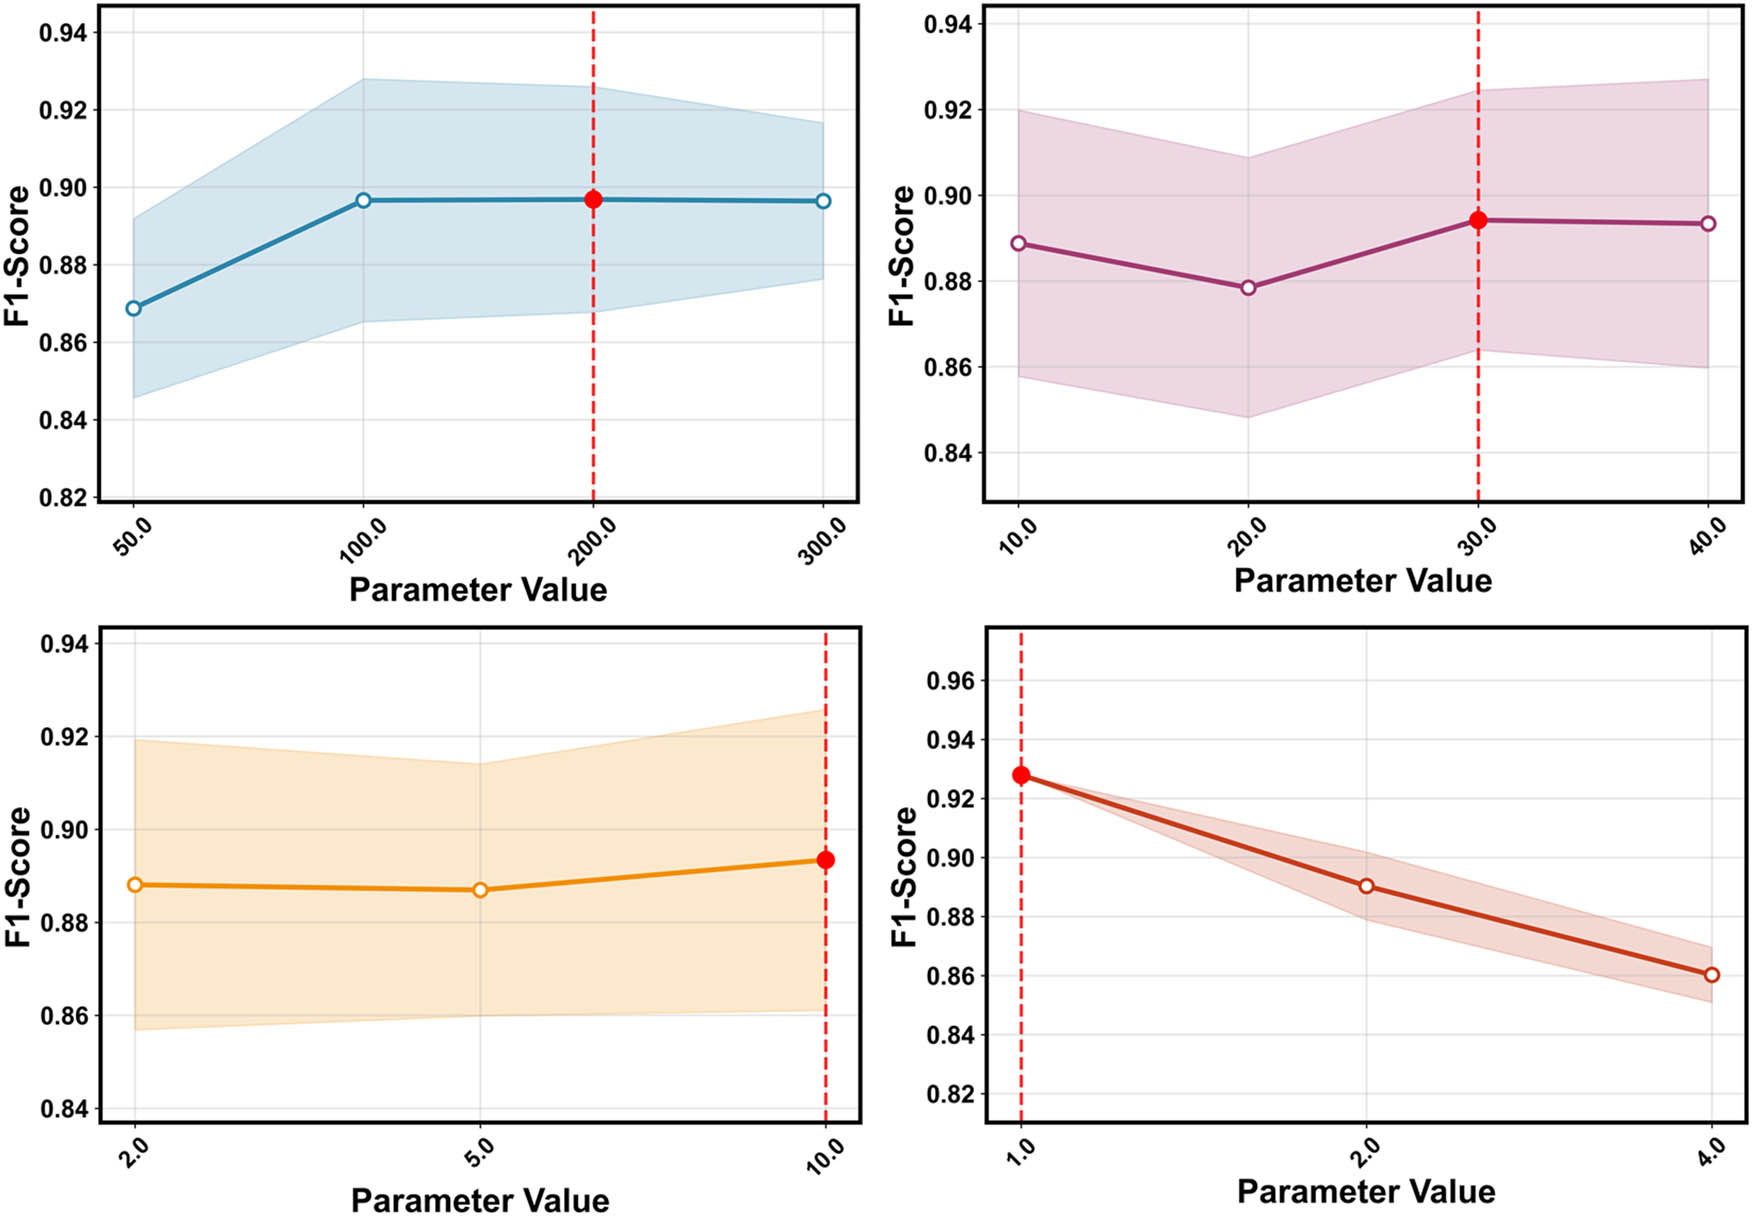
Figure 4
Number of decision trees (n_estimators), maximum depth (max_depth), minimum number of samples required for leaf nodes (min_samples_leaf), minimum number of samples required for internal node splitting influence of different values on model F1-score (from left to right, top to bottom).
Source: The figure is generated from the results of data processing and provided by the author Fu Caizhi.
Table 5
Training results of model after parameter optimization.
| Model | Best parameters | Accuracy | Precision | Recall | F1-Score | ROC-AUC |
|---|---|---|---|---|---|---|
| Training set | {“n_estimators”: 200} | 0.997 | 0.874 | 0.994 | 0.930 | 1 |
| {“max_depth”: 10} | ||||||
| {“min_samples_leaf”: 1} | ||||||
| {“min_samples_splits”: 5} | ||||||
| “class_weight”: {0: 0.51, 1: 22.01} | ||||||
| Test set | {“n_estimators”: 200} | 0.997 | 0.884 | 0.992 | 0.935 | 1 |
| {“max_depth”: 10} | ||||||
| {“min_samples_leaf”: 1} | ||||||
| {“min_samples_splits”: 5} | ||||||
| “class_weight”: {0: 0.51, 1: 22.01} |
Source: The table is generated from the results of data processing and provided by the author Fu Caizhi.
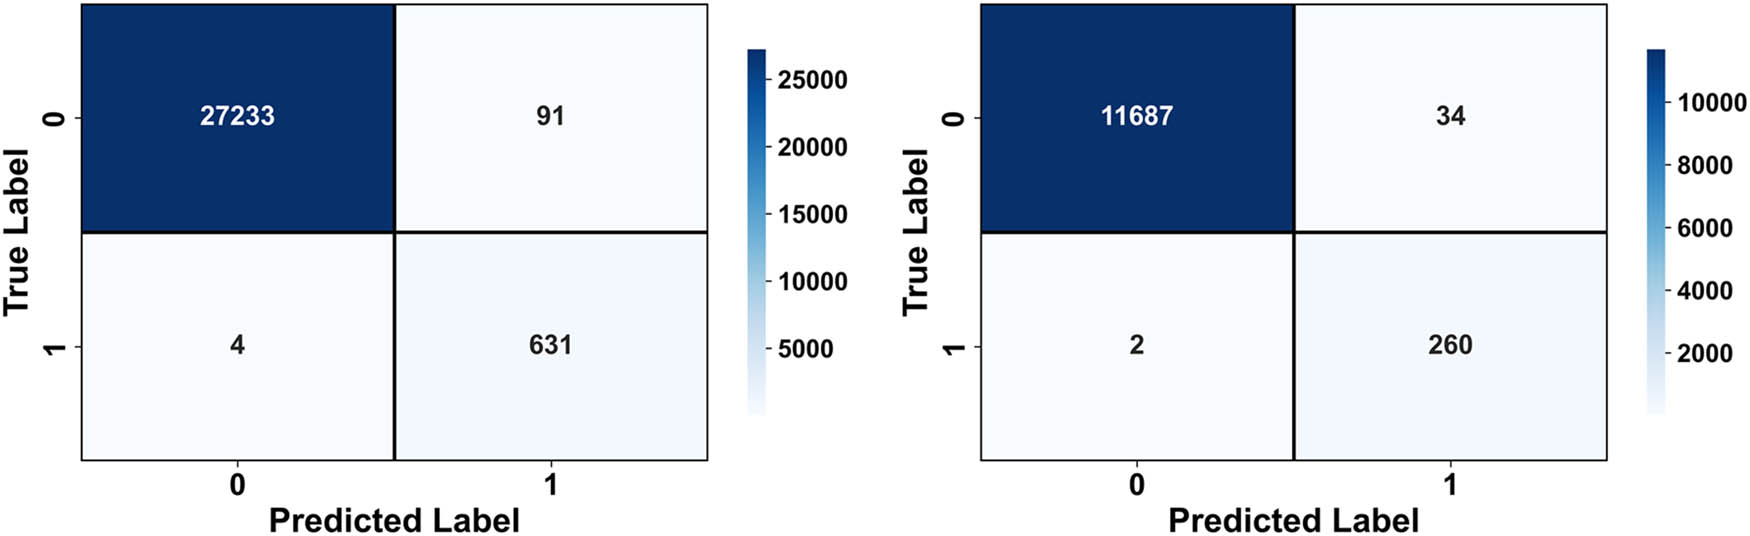
Figure 5
Training set confusion matrix and test set confusion matrix after parameter optimization.
Source: The figure is generated from the results of data processing and provided by the author Fu Caizhi.
After deploying the trained model for predictions on both the training and test sets, the confusion matrix is shown in Figure 5, with corresponding results summarized in Table 5. Under the combined effect of sample balancing and parameter optimization, the model’s ability to identify true negatives and false positives slightly improved, leading to a certain trade-off change between the Recall and Precision metrics. Specifically, the Recall value decreased by 0.006 compared to the pre-optimization state, indicating a slight reduction in the model’s coverage capability for positive class samples, i.e., yarn breakage occurrences. In the direct cabling machine production context, where yarn breakage is a key factor affecting product quality and production efficiency, this decrease in Recall may imply that some actual breakage events failed to be effectively identified, thereby increasing the risk of missed detections.
Concurrently, the Precision value increased by 0.004, reflecting enhanced accuracy when the model classifies samples as positive, meaning reduced false alarms in breakage identification. In practical production, improved Precision significantly lowers the false positive rate, reducing instances where normal operation is mistakenly identified as breakage. This helps avoid unnecessary machine stoppages for inspection and manual intervention. This not only contributes to maintaining a continuous and stable production rhythm but also directly reduces operational costs, including decreased equipment idling losses, conserved human resources, and optimized maintenance resource allocation. Furthermore, a high-Precision model enhances the overall reliability of the production system, supports data-driven decision-making, lays the foundation for long-term process optimization and intelligent upgrades, and ultimately achieves dual improvement in efficiency and cost-effectiveness.
This phenomenon likely stems from the enhanced learning of positive class sample features through the sample balancing operation and the adjustment of the positive class discrimination threshold during parameter tuning. Overall, the model’s performance exhibits a typical Precision-Recall trade-off. Additionally, the model’s execution time was significantly reduced, indicating substantially improved efficiency, demonstrating that the optimized model maintains high comprehensive performance while possessing better engineering applicability. In industrial applications, a comprehensive assessment of the model’s detection capability and misjudgment risk, combined with specific production requirements and cost-benefit analysis, is necessary to formulate reasonable deployment strategies.
3.3. Prediction Results Analysis
By comparing the discrepancies between predicted values and actual values, the first five sampled data points before yarn breakage and the first five normal operation data points were extracted, with a detailed comparison presented in Table 6 (where target Y = 0 indicates other operational states). The prediction results show a high degree of consistency with the actual values. Within the allowable range of practical error, the prediction results can be considered accurate and consistent with the true values.
Table 6
Predicted vs true values.
| First five rows | Last five rows | ||||||
|---|---|---|---|---|---|---|---|
| Id | Predicted value | True value | Probability | Id | Predicted value | True value | Probability |
| 10250 | 1 | 0 | 0.694 | 32891 | 0.000 | 0.000 | 0.000 |
| 13055 | 1 | 0 | 0.694 | 6258 | 0.000 | 0.000 | 0.000 |
| 29097 | 1 | 1 | 0.985 | 21967 | 0.000 | 0.000 | 0.000 |
| 36502 | 1 | 1 | 1.000 | 32884 | 0.000 | 0.000 | 0.000 |
| 15668 | 1 | 0 | 0.544 | 217 | 0.000 | 0.000 | 0.000 |
Source: The table is generated from the results of data processing and provided by the author Fu Caizhi.
3.4. Feature Extraction and Machine Learning Model Results
During the feature extraction phase, based on the logical principles of the twisting process in direct cabling corder, variables strongly correlated with yarn breakage were selected, and data columns with no significant association with yarn breakage were removed. Data before and after yarn breakage were extracted for analysis and exploration. It was observed that the actual speed of the spindle and the percentage distribution of yarn winding exhibited distinct patterns in box plots and histograms: as shown in Figures 6 and 7; when yarn breakage occurs in the direct cabling corder, the deviation between the actual spindle speed and the set spindle speed is significant, and the percentage distribution of yarn winding is mostly below 30%.
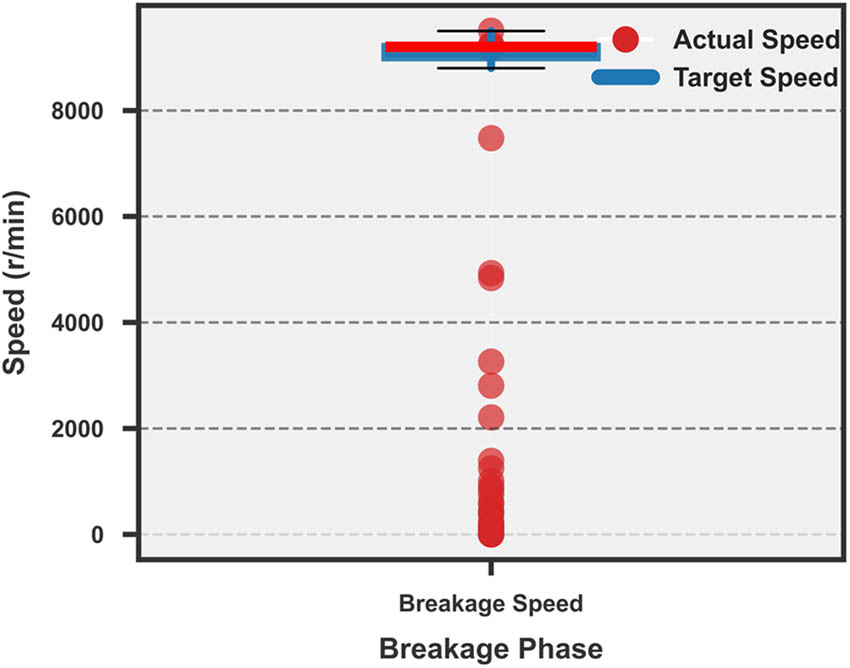
Figure 6
Spindle speed distribution diagram when yarn breaks.
Source: The figure is generated from the results of data processing and provided by the author Fu Caizhi.
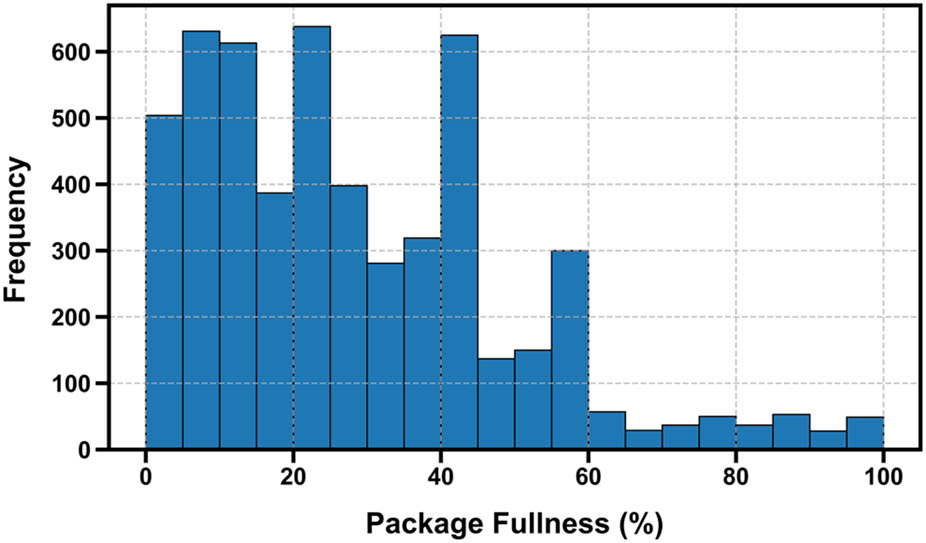
Figure 7
Percentage distribution diagram of winding when yarn breaks.
Source: The figure is generated from the results of data processing and provided by the author Fu Caizhi.
The proportion of stopped spindles also has a significant impact on the production rate per minute of the equipment. Statistical analysis of the data from equipment D16-L1, which experienced a high number of yarn breakages, revealed that in the absence of any spindle reaching 100% winding, the average production rate gradually decreased from 1.27 kg/min to 1.11 kg/min as the proportion of stopped spindles increased. This indicates that the stopped spindle state has a significant negative impact on production. Figure 8 clearly illustrates the relationship between the stopped spindle state and the production rate change.
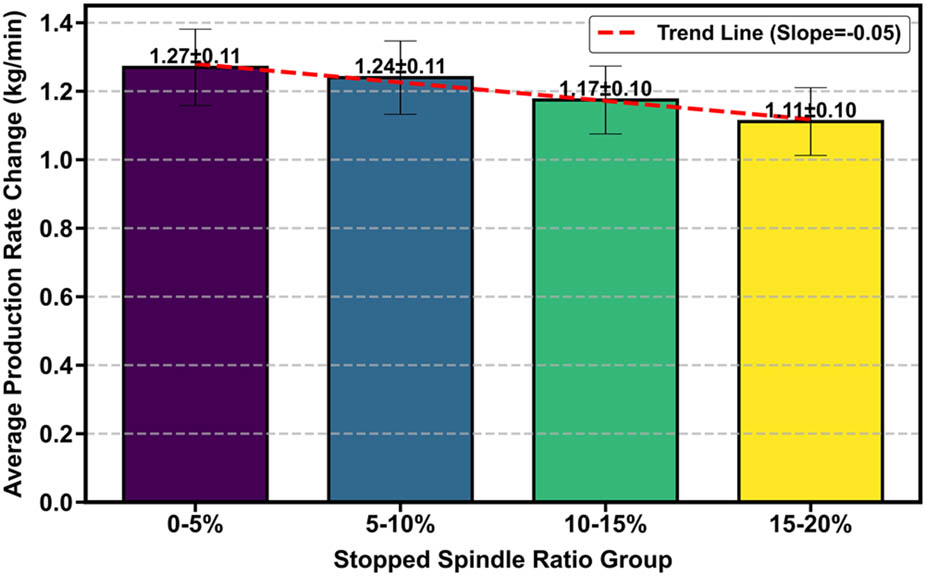
Figure 8
Influence of spindle stoppage on yield per minute.
Source: The figure is generated from the results of data processing and provided by the author Fu Caizhi.
Based on the model learning analysis results, the factors influencing yarn breakage and their corresponding importance coefficients are as follows: actual spindle speed (V 1) with a coefficient of 0.414; winding percentage (P 1) with a coefficient of 0.391; twist level of 380 T/m (R 3_380) with a coefficient of 0.0054; twist level of 375 T/m (R 3_375) with a coefficient of 0.032; outer yarn tension of 600 cN (R 6_380) with a coefficient of 0.019; set spindle speed of 9,200 rpm (R 2_9200) with a coefficient of 0.018; overfeed ratio of 300% (R 4_300) with a coefficient of 0.015; set spindle speed of 9,500 rpm (R 2_9500) with a coefficient of 0.011; inner yarn tension of 8.2 cN (R 5_8.2) with a coefficient of 0.010; yarn type of 1,300 dtex (R 1_1300) with a coefficient of 0.009; set spindle speed of 9,000 rpm (R 2_9000) with a coefficient of 0.008; twist level of 443 T/m (R 3_443) with a coefficient of 0.006; inner yarn tension of 9.1 cN (R 5_9.1) with a coefficient of 0.005; yarn type of 2,000 dtex (R 1_2000) with a coefficient of 0.004; outer yarn tension of 1,100 cN (R 6_380) with a coefficient of 0.002; inner yarn tension of 11.2 cN (R 5_11.2) with a coefficient of 0.001; twist level of 365 T/m (R 3_365) with a coefficient of 0.001. The ranking of feature importance is shown in Figure 9. Based on the model analysis results under fixed parameter combination experimental conditions, the actual operating speed (V 1) and package build state (P 1) were identified as the key dominant factors influencing yarn breakage. Although yarn tension is theoretically considered an important parameter affecting breakage in textile theory, its importance coefficient in this model was relatively low, as indicated by R6_600 at 0.019. This phenomenon may stem from the following reasons: First, due to the categorical encoding method adopted, the model could only evaluate the independent impact of specific tension levels, such as 600 cN, on yarn breakage, without capturing the overall effect of the tension parameter across its entire variation range. Second, in the actual factory production environment, yarn tension is typically stringently controlled within specified process windows, resulting in relatively limited variability. This made it difficult to demonstrate significance during the evaluation of fixed parameter combinations. In contrast, parameters such as spindle speed and winding degree exhibit greater fluctuations during the production process, and their variations directly affect the yarn’s stress state, thus demonstrating higher feature importance in the model.
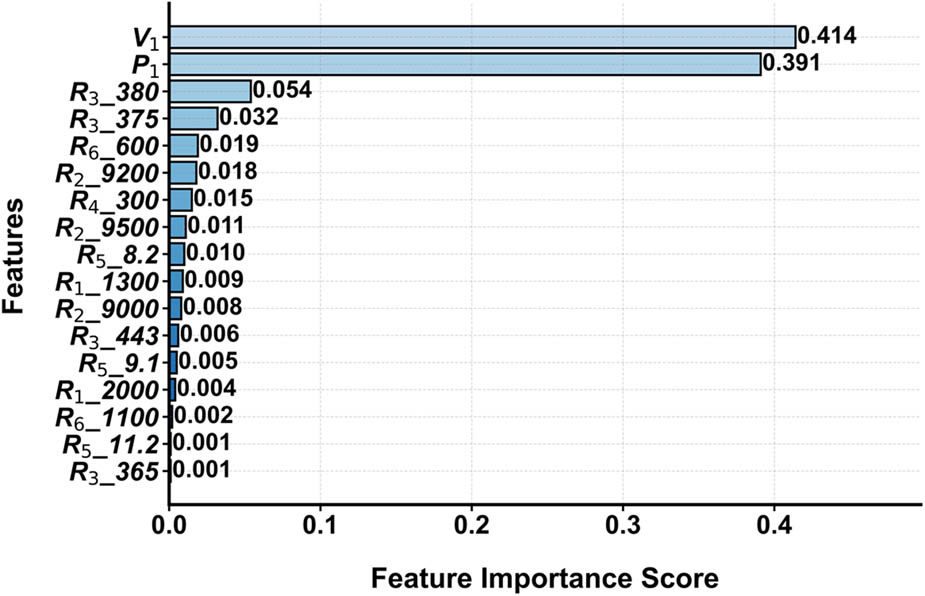
Figure 9
Feature importance ranking.
Source: The figure is generated from the results of data processing and provided by the author Fu Caizhi.
This finding indicates that under existing process conditions, optimizing the control of actual operating speed and package build quality represents the primary direction for reducing yarn breakage risk. The influence of yarn tension may have been effectively controlled through process specifications, resulting in its relative importance being statistically insignificant. Comparing the feature extraction results with the feature importance analysis from the RF model validates that actual operating speed and package build are the main contributing factors for yarn breakage, demonstrating consistent analytical conclusions.
3.5. Analysis of Dynamic Speed and Single-Spindle Full Package Rate
Based on the trained data model, the primary factors identified as influencing yarn breakage are the deviation between the actual spindle operating speed and the set speed, as well as the package build percentage. Consequently, further data analysis was conducted on the deviation of the actual spindle operating speed and the package build percentage.
Typical breakage-prone spindle positions were selected from the top six equipment units with the highest number of breakages for standard deviation analysis of their actual operating speeds, as shown in Table 7. Taking equipment D16-L1 as an example, the median speed before breakage was 8803.00 rpm with a standard deviation of 73.06, and the actual speed range was 8729.94–8876.06 rpm. It is recommended to control the safe operating range between the first and third quartiles of the normal operating speed, specifically 8799.00–8803.00 rpm, as illustrated in Figure 10. In the figure, the blue range represents the actual speed fluctuation, while the red range indicates the recommended conservative safe interval. The analysis reveals that some equipment units exhibit significantly larger standard deviations in breakage-related speeds, indicating that speed deviation from the set value is a primary cause of breakage. However, equipment D24-L1 showed a standard deviation of only 7.88, suggesting that its breakage causes may be unrelated to speed deviation and require further analysis based on actual conditions. The relative deviation is calculated as the ratio of the range width to the median value, where the range width is the absolute value of the IQR (IQR = Q 3 – Q 1). Calculation results show that the current average relative deviation of the IQR is approximately 0.04%. In industrial manufacturing practice, a tolerance of ±2σ is commonly adopted to accommodate normal process variation. Therefore, the recommended feasible tolerance for the relative deviation is ±0.08% (i.e., 2 × 0.04%), taking the average relative deviation (0.04%) as an estimate of the process standard deviation (σ). This tolerance represents a practical and operational range that is consistent with the variation typically observed in production.
Table 7
Analysis of speed standard deviation before and after yarn breakage (six typical equipment)
| Device | Median velocity/rpm | Standard deviation of speed | IQR (Q 1–Q 3)/rpm | Standard deviation range/rpm |
|---|---|---|---|---|
| D16-L1 | 8803.00 | 73.06 | 8799.00∼8803.00 | 8795.88 ∼ 8810.12 |
| D23-R1 | 8803.00 | 11.18 | 8799.00∼8803.00 | 8795.88 ∼ 8810.12 |
| D24-L1 | 9503.00 | 7.88 | 9499.00∼9503.00 | 9495.33 ∼ 9510.67 |
| D48-L1 | 9003.00 | 110.96 | 8999.00∼9003.00 | 8995.73 ∼ 9010.27 |
| D71-R1 | 9200.00 | 142.31 | 9200.00∼9203.00 | 9192.57 ∼ 9207.43 |
| D72-L1 | 9200.00 | 27.78 | 9200.00∼9203.00 | 9192.57 ∼ 9207.43 |
Source: The table is generated from the results of data processing and provided by the author Fu Caizhi.
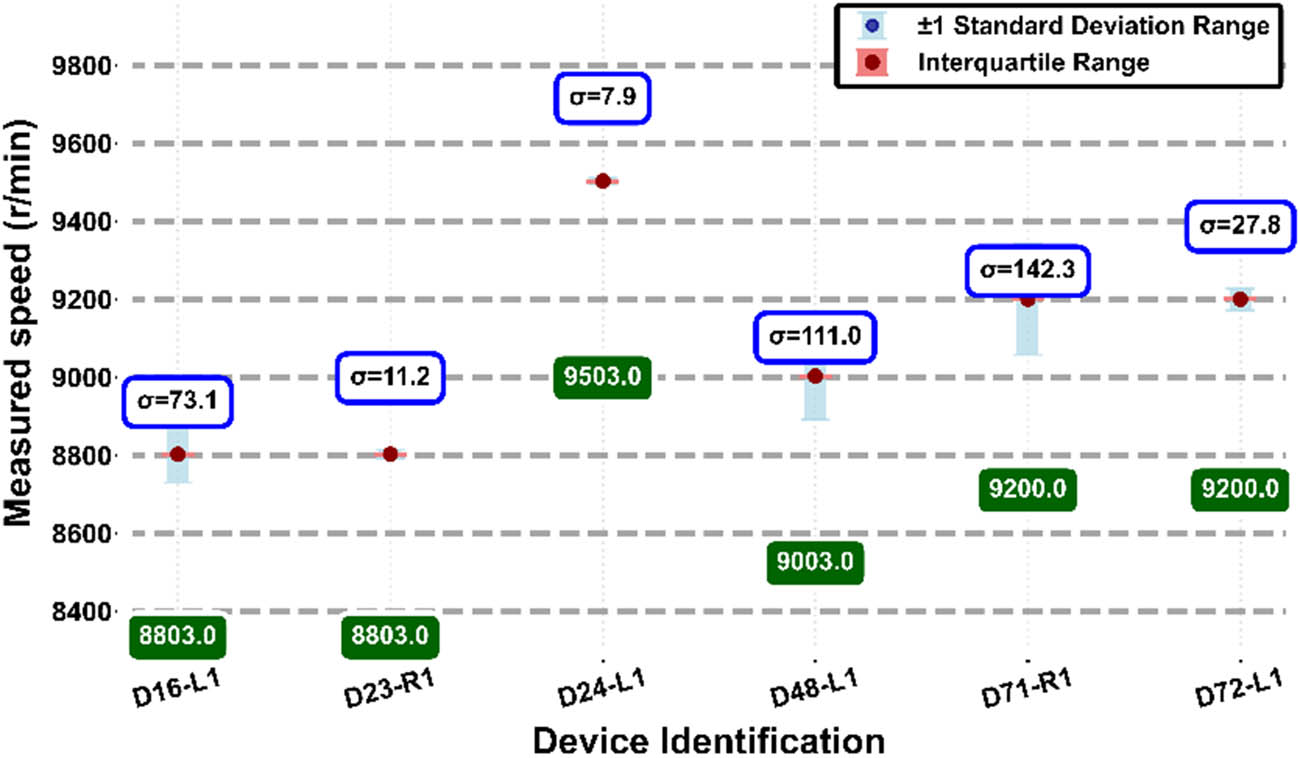
Figure 10
Comparison of actual speed to target speed (top six devices).
Source: The figure is generated from the results of data processing and provided by the author Fu Caizhi.
Analysis of the winding distribution of the spindles from the top six equipment revealed that when the winding percentage is between 0 and 27.84%, the probability density curve of the normal state is lower than that of the yarn breakage state, as shown in Figure 11, indicating a clear critical threshold phenomenon.
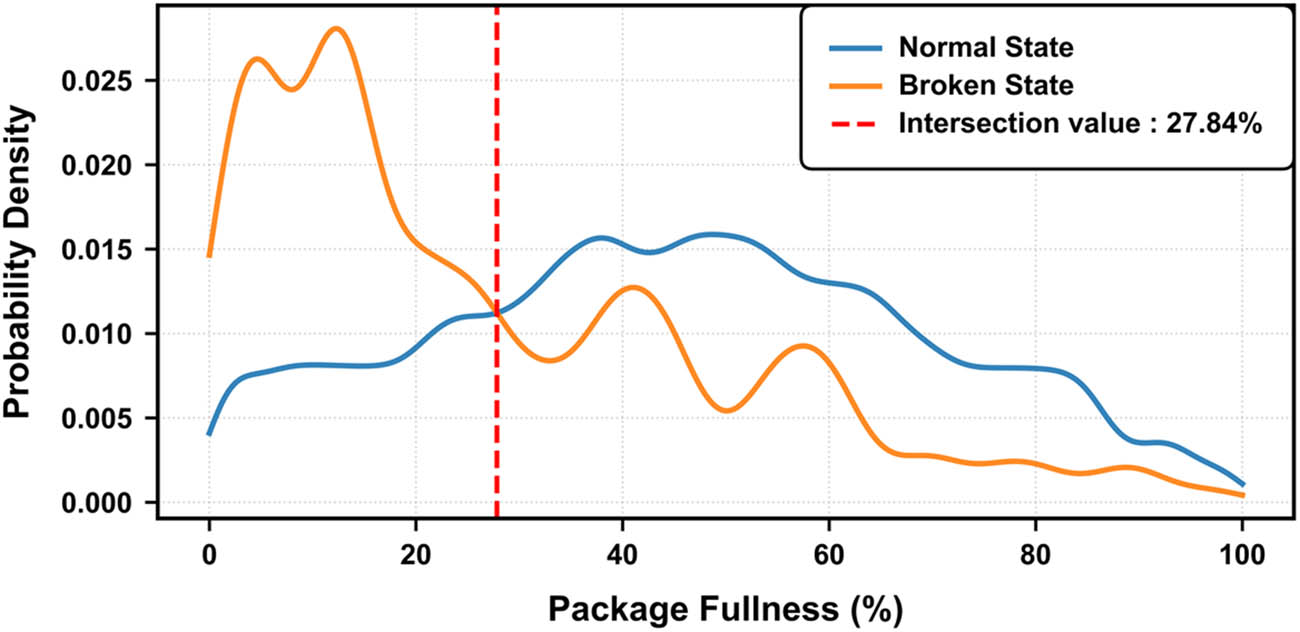
Figure 11
Analysis of winding percentage between normal state and broken yarn state (top six devices).
Source: The figure is generated from the results of data processing and provided by the author Fu Caizhi.
An analysis was conducted solely on the top six pieces of equipment with the highest number of yarn breakages, which covers a relatively limited data range. These equipment may have some special conditions and cannot represent the overall situation of all equipment. By incorporating a global analysis, the results show that when the speed is within the safe range, the yarn breakage rate remains high when the winding percentage is in either the lower or higher intervals, as shown in Figure 12. This finding slightly differs from the yarn breakage impact observed in the analysis of the top six equipment, suggesting that the influence pattern of winding percentage on the yarn breakage rate may exhibit some variability across different equipment groups or production scenarios. The impact of speed deviation rate on the yarn breakage rate remains consistent with the analysis results of the top six equipment.
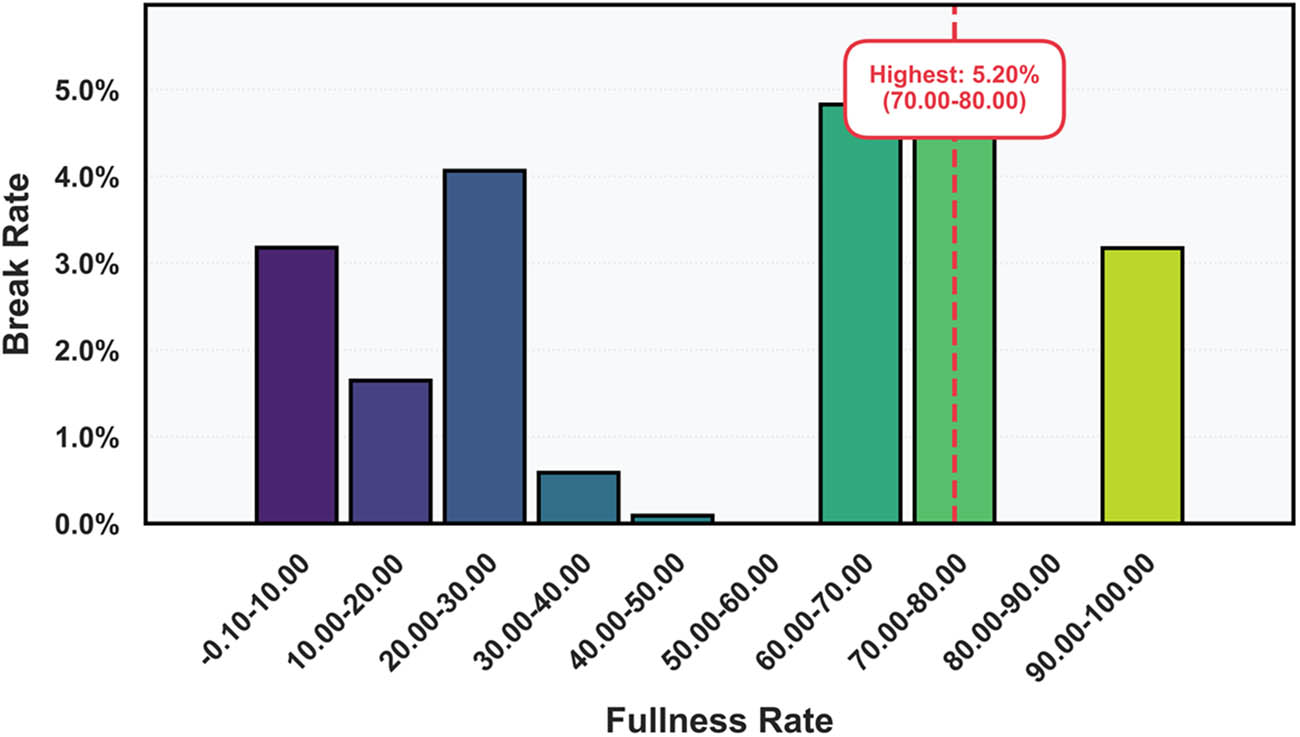
Figure 12
Effect of winding percentage on yarn break rate (all devices).
Source: The figure is generated from the results of data processing and provided by the author Fu Caizhi.
Analysis of the interaction between winding percentage and actual spindle speed revealed that when the speed deviation rate is between 3.38 and 6.96% and the spindle winding is between 20 and 30%, the risk of yarn breakage significantly increases, as shown in Figure 13. This interval fully reflects the significant impact of the synergistic effect of speed and winding percentage on yarn continuity under specific production conditions, highlighting the complex interaction between these two factors. It is particularly noteworthy that when the speed deviation from the set speed reaches 89.6–100%, the speed is nearly zero, and the equipment is essentially in a yarn breakage state, which represents a special fault condition and is therefore not considered in the routine analysis of this study. Comparing this result with the data from the top six equipment, it is found that the influence patterns of winding percentage and speed deviation rate on yarn breakage are consistent.
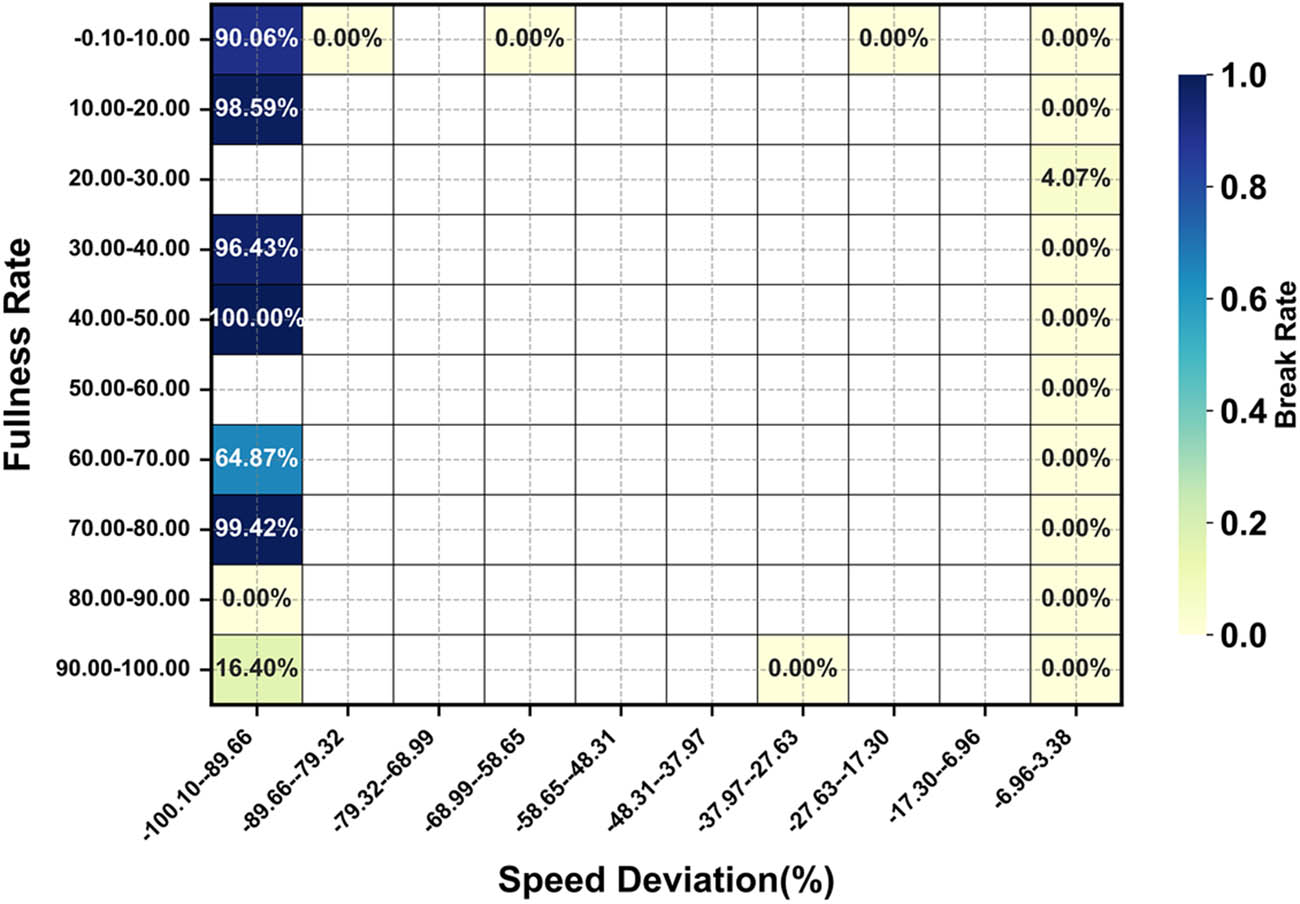
Figure 13
Interaction effect of fullness × speed deviation (%) on yarn break rate.
Source: The figure is generated from the results of data processing and provided by the author Fu Caizhi.
Speed deviation causes the instantaneous stress of the yarn to exceed the limit, leading to yarn breakage. This phenomenon may also be related to the mismatch between the internal stress relaxation time of the yarn and the external traction speed, which aligns with the dynamic response characteristics of viscoelastic materials [25]. The influence of winding percentage on yarn breakage may be associated with the anti-stacking angle in the production of polyester tire cord. To ensure that the twisted yarn forms a regular cylindrical winding during the winding process, achieving good shaping and avoiding edge collapse, the anti-stacking angle is typically set to (20 ± 1°). Under these process conditions, the yarn exhibits a specific motion pattern, starting from point A, moving to point B, and then returning to point A, repeating this cycle. The periodic motion pattern of the yarn is detailed in Figure 14. The anti-stacking angles in this study’s data are 17° and 19°, which may lead to a higher likelihood of yarn breakage at low winding percentage. It is recommended to arrange professional workers for real-time inspection when the spindle winding is below 30%. Adjustments or corrections should be made to the anti-stacking angle or the cord guiding device in order to promptly identify and address potential yarn breakage risks.
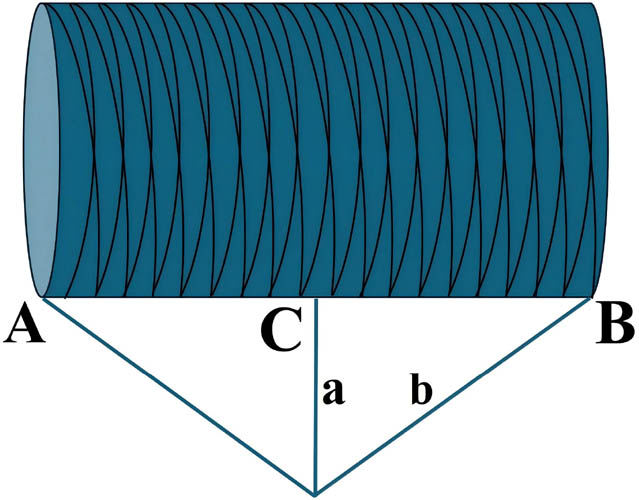
Figure 14
Motion of curling mechanism.
Source: The figure data originate from the angle settings adopted during yarn package winding, and the figure are provided by the author Fu Caizhi.
4. Conclusion
This study systematically evaluated the causes of yarn breakage in direct cabling machines using the RF algorithm, based on engineering expertise and actual factory production environments, exploring the correlation mechanisms between process parameters and breakage phenomena. The research innovatively introduced data-driven analysis methods into the traditional textile process optimization field, providing a new technical approach for breakage fault diagnosis.
The study employed the RF algorithm to assess the importance of factors causing yarn breakage in direct cabling machines under real factory conditions. Results demonstrate varying influences of different production parameters on breakage occurrence. Among the top three most important parameters, package build percentage (%) and actual operating speed (rpm) play dominant roles in breakage issues, collectively contributing 80.5%. Although twist level (380 T/m) ranks third, its importance is significantly lower at only 5.4%. The other parameter, such as yarn variety, set spindle speed, twist, overfeed ratio, inner yarn tension, outer yarn tension, etc., have little influence on yarn breakage and are all less than or equal to 5.4%, potentially representing secondary adjustment parameters in the production line. During cross-validation evaluation, the model demonstrated excellent performance with minimal prediction deviation and strong classification capability. After parameter optimization, the model’s performance became more robust, achieving an F1-score of 0.935 and an ROC-AUC value of 1, strongly validating the model’s effectiveness and reliability. The RF model shows significant advantages in capturing nonlinear complex data relationships and diagnosing breakage issues in direct cabling machines within practical scenarios, providing valuable reference for developing other intelligent diagnostic systems.
Based on the previous analysis of factors influencing yarn breakage, targeted countermeasures can be proposed focusing on two key aspects: speed regulation and package management. Regarding speed control research, given the use of new equipment in the experiment, mechanical component failure factors could be temporarily disregarded. In 2016, the K3501B [11] employed an intelligent control system for inner and outer yarn tension in related research. However, this system experienced stalling issues in actual factory applications, indicating that further research is needed for tension control in direct cabling machines. Simultaneously, the speed control system of direct cabling machines might have certain defects, where the controller may fail to precisely adjust motor speed according to actual working conditions, leading to speed instability. Consider introducing more advanced control strategies to precisely regulate the guide roller pressure, ensuring the spindle speed remains within statistically controlled limits, thereby significantly reducing breakage risk. In package management, the current solution involves arranging specialized workers for real-time inspection when the package build falls below 30%. Through on-site observation and evaluation, workers can promptly identify simple issues in the winding process, such as adjusting the anti-patterning angle or calibrating the tire cord guide device. However, further research is needed regarding the influence of package shape and tire cord winding path on breakage issues.
This study focused on model construction, performance verification, and process optimization. Given the complexity of actual industrial scenarios, it did not involve practical equipment debugging or in-depth investigation of different temperature and humidity conditions. Future research directions include conducting small-scale pilot verification. This stage will further test the model’s generalization capability and practicality in real application scenarios, enabling targeted optimization and adjustments through collected and analyzed actual data from the pilot process to ensure stable and efficient operation in practical production environments. Concurrently, in-depth investigation of process-related factors such as spindle speed stability and package build stability will be pursued to achieve further refined process optimization.
Author contributions
Xu Weiqiang was responsible for the acquisition of the experimental equipment and provided financial support for the study. Fu Caizhi conducted the collection and preprocessing of the experimental data, developed the analytical model, and performed a comprehensive analysis of the causes of yarn breakage in Direct Twisting Machines. Dong Yuxuan assisted with data processing, statistical analysis, and the interpretation of the experimental results. All authors reviewed the manuscript, approved the final version, and agreed to be accountable for all aspects of the work.
Conflict of interest statement
The authors declare no conflict of interest.