
1. Introduction
Among the biggest and most vibrant industries, the textile sector makes a substantial contribution to both international trade, and economic growth. It is now crucial to maintain quality control and optimize manufacturing processes due to the growing consumer demand for premium fabrics and effective production. Manual inspection is a common component of traditional quality assessment techniques. Modern technology adoption, especially the Internet of Things (IoT), has revolutionized textile manufacturing by making automated quality control and real-time process monitoring possible. IoT-driven systems monitor vital production parameters like fabric texture dyeing precision and machine efficiency by combining smart sensor data analytics and cloud computing. This method ensures adherence to industry standards, boosts productivity and minimizes material waste. Manufacturers can reduce production delays, maximize resource use and identify flaws early by utilizing IoT technology. By lowering energy consumption and operating expenses, intelligent automation not only enhances product quality but also promotes sustainable manufacturing practices.
The purpose of this research was to develop and implement an integrated IoT-enabled smart manufacturing framework combining real-time sensor networks, edge computing, AI-powered anomaly detection, predictive maintenance, and digital twin modelling to optimize textile production processes across the spinning, weaving, dyeing, and finishing stages. By collecting and analyzing large-scale data from 50 textile units over six months, the study aimed to reduce defects, improve first-pass yield, minimize downtime, and enhance resource efficiency while ensuring sustainability and scalability. The research bridges technological gaps in the Indian textile sector by achieving significant operational improvements compared to global benchmarks, thereby accelerating Industry 4.0 adoption for smart and eco-efficient textile manufacturing. Figure 1 shows the various application of IoT in smart textiles.
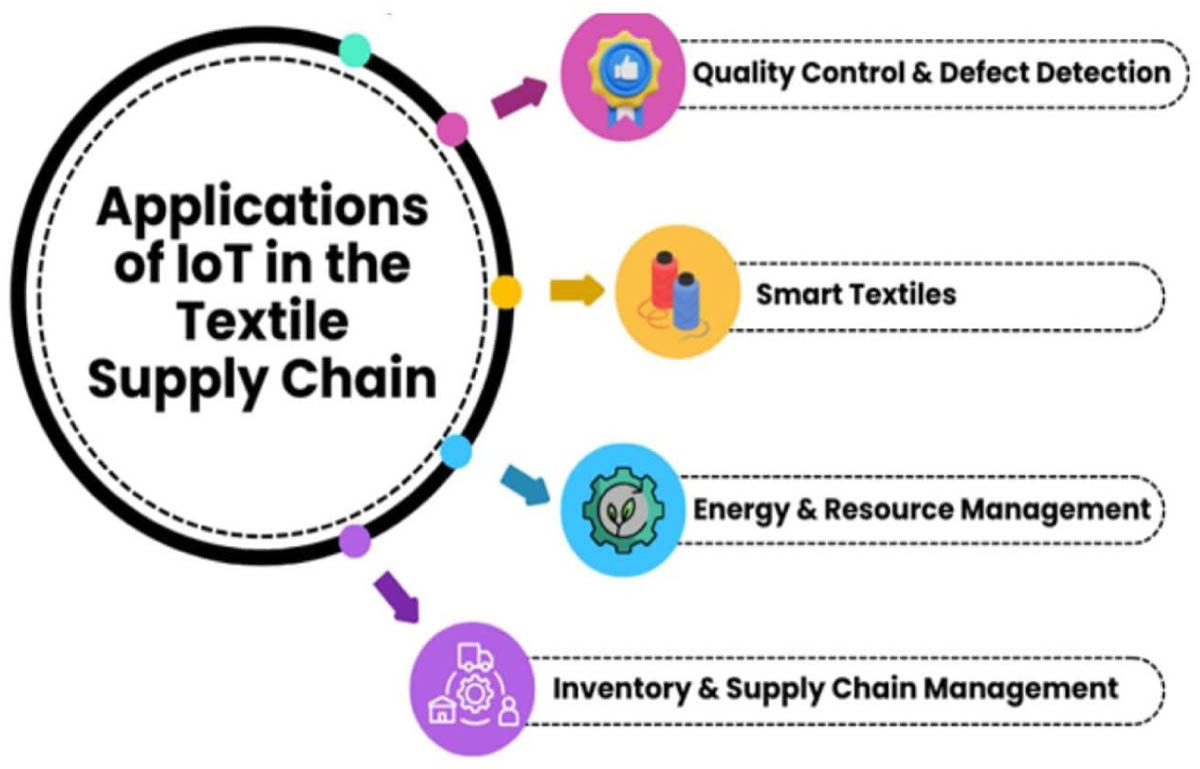
Fig. 1.
IoT in textile industry
Since it can identify a major and long-lasting flaw in a roll as soon as it is manufactured, real-time defect detection on fine cloth is an urgent problem that needs to be solved in order to prevent roll damage and the subsequent price decline [1]. To detect defects in real-time, the system uses image processing techniques to regulate the production process. Once an intelligent optical head detects a flaw on a loom, a server classifies it. In practical applications, the system has demonstrated stability and dependability in false alarms. The textile industry primarily relies on effective process control to maintain high product quality while lowering waste costs and environmental impact [2]. This guide provides an overview of process control techniques, covering key subjects such as guiding principles and testing statistical quality control. The topics covered include knitting, woven, nonwoven textiles, coloration, finishing, blowroom, carding, drawing, combing, ring and rotor spinning, yarn repairing, spinning machines, and clothing production. The guide is essential for academic researchers, textile engineers, and manufacturers. However, the system employs a random forest classifier to identify flaws, compensates for image brightness, corrects camera luminance, and filters texture using a Gaussian filter and Haar wavelet transform [3]. The method lowers false positives and negatives, thereby increasing production efficiency and demonstrating the promise of quality control systems powered by machine learning [4].
Additionally, data analysis techniques, biocompatibility, comfort, and user acceptance factors are covered [5]. Potential uses covered in the article include tracking activities, detecting diseases, and monitoring vital signs. Future research avenues and difficulties like scalability, washability, and durability are also covered. Facilitating the smooth integration of this technology into clinical practice is the goal of the review. The analysis covers flexible manufacturing systems in R&D as well as sophisticated telecommunications systems like EDI and TQM methodologies [6]. The study also looks at concepts like CIM and CIB, as well as product-oriented organizational structures and flow-type production systems. The author [7] stresses the importance of training multifunctional staff and reducing lead times. The work is based on the author's experience working as an engineering and management research worker for apparel and textiles.
Manufacturers and retailers such as Procter and Gamble, CVS, Tesco, Prada, Benetton, and Wal-Mart are using RFID to enhance supply chain management by decreasing inventory losses and boosting productivity, speed, and information accuracy[8]. However, there are financial and technological obstacles to RFID's widespread adoption. RFID technology and its uses in retail management, production control, inventory management, and brand segregation in the apparel and textile sector are discussed in this paper. Since people frequently misunderstand and misinterpret the Internet of Things (IoT), which causes them to become confused and uncertain, this issue of Textile Progress attempts to offer a guide to help those working in the textile industry make well-informed decisions regarding its potential worth[9].
In order to comprehend the concepts and objectives of the Internet of Things, it goes over the definitions of its architecture, elements, standards, and protocols [10]. For comprehensive data on product lifecycle, waste collection, and consumer behaviour, cooperation between industry, consumers, and policymakers is required [11]. Real-time data on location, availability, and condition can be transferred through digital platforms and sensors, extending the life of products and aiding in product tracking and tracing [12]. Applications including Internet of Things-based health monitoring systems, artificial intelligence, cloud computing, smart manufacturing, and cyber-physical systems are also covered in the study [13]. The results underscore the significance of employing these technologies to improve productivity and outperform rivals in the field of smart materials.
With suppliers and sources spread across continents, the contemporary textile supply chain is vast and intricate [14]. Waste and frustration result from the inability to link defects to faulty batches. Because of the volume of data and stages involved, traceability is challenging. Another issue that forces entities to operate locally is transparency. Businesses like textiles that have intricate supply chains are not a good fit for blockchain technology [15]. In order to improve textile quality, this paper suggests a blockchain-based framework that allows for near-real-time cross-chain information sharing with accuracy and authenticity guaranteed [16]. On the other hand, the Internet of Things (IoT) is a quickly developing technology that enhances India's textile and apparel sector by leveraging computing domains and Wireless Sensors and Actuator Networks (WSAN) [17]. This paper examines the potential of IoT in the Indian apparel industry and suggests strategies to improve production efficiency, lower costs, and boost competitiveness for clothing manufacturers in light of rising domestic consumption and export demands.
According to a number of studies, this sector is the second most polluting in the world after the oil industry [18]. Along with consuming a lot of water and energy and a variety of chemicals during production, the textile industry also produces a significant amount of waste. Since 1989, the Romanian textile and apparel industry has undergone substantial change, with both common and unique factors impacting the market, especially imports and exports [19]. Using statistics and data series, this article examines these factors and identifies important variables. The findings highlight the significance of balancing trade policies and offer potential steps to improve export and import flow and create balanced trade policies in the textile and apparel articles sector.
2. Methodology
2.1. Problem Description
Maintaining consistent fabric quality is a major challenge for the textile industry because it relies on labor-intensive traditional processes that are prone to human error. High rejection rates, irregularities in the dyeing process, variations in fabric texture and irregularities in fiber strength are all examples of these inconsistencies. Manual inspection techniques are ineffective and frequently miss small flaws in real time, which increases material waste and lowers production efficiency, which is shown in Figure 2. Without an integrated monitoring framework, quality control is reactive rather than proactive, which exacerbates production delays and costs. This study suggests an IoT-driven real-time process monitoring and quality control system that combines automation, smart sensors and predictive analytics to address these issues. By streamlining the spinning, weaving, dyeing and finishing processes, this system seeks to increase operational efficiency and quality consistency.
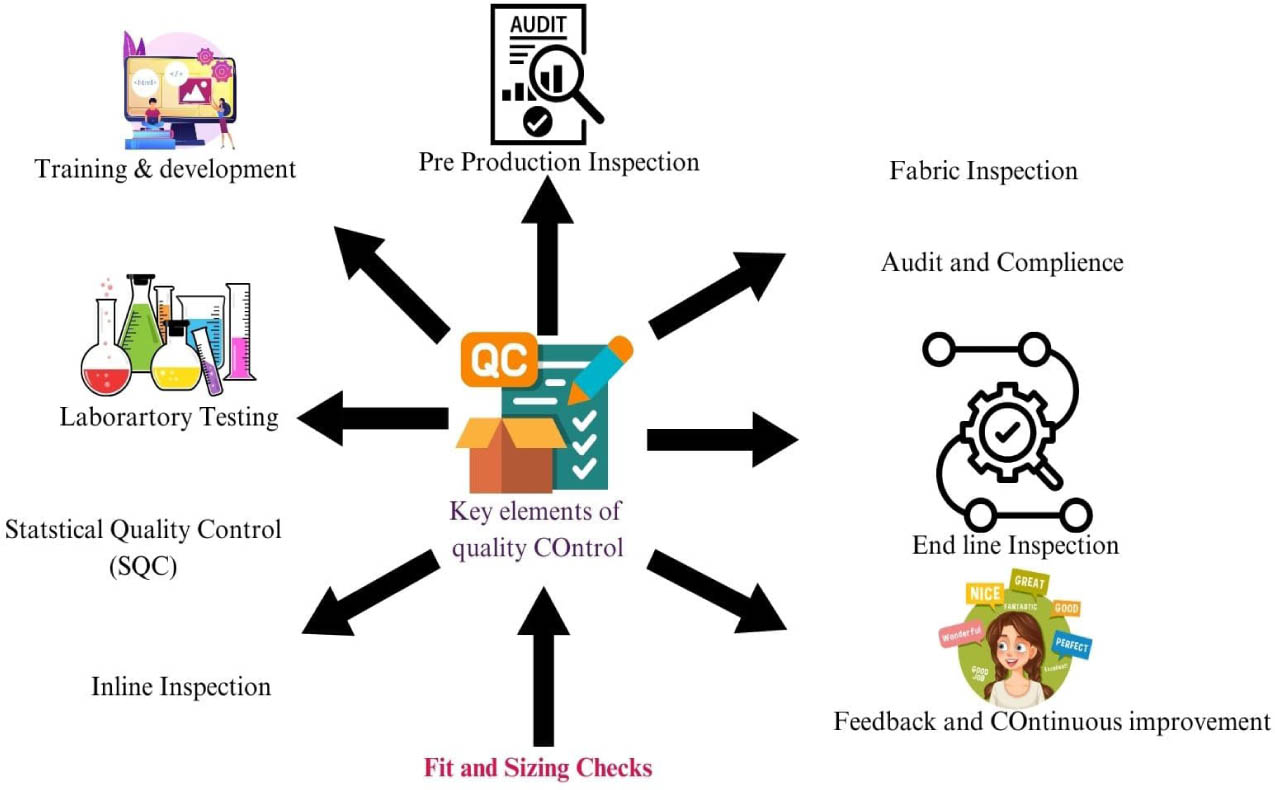
Fig. 2.
Quality control process of clothes
2.2. Data Collection
The data collected in this study are now explicitly linked to specific textile processes and product types, rather than only to the geographical location. For each unit, measurements were conducted during clearly defined process steps: in Tiruppur, yarn tension was recorded on ring-spun cotton yarn during winding, and dye consistency was measured during knitted fabric dyeing; in Coimbatore, fabric density and humidity were monitored during grey woven fabric formation and finishing; in Surat, machine vibration was measured during shuttleless weaving, and fiber strength was tested prior to weaving; in Ludhiana, the temperature in the knitting hall and defect detection during knitted fabric inspection were collected; and finally, in Bhilwara, moisture content and thread elasticity were assessed during dyeing and finishing processes. This approach ensures that the sensor data collected are process-specific and directly relevant to quality evaluation, addressing the reviewer's concern regarding ambiguity in the previous dataset presentation. An overview of the information gathered is provided in Table 1.
Table 1.
Data collection
| Location | No. of Textile Units | Duration (Months) | Textile Process | Data Collected & Measurement Details |
|---|---|---|---|---|
| Tiruppur | 12 | 6 | Yarn Spinning | Yarn tension (measured on 100% cotton ring-spun yarn during winding) and dye consistency (color strength during dyeing of knitted fabric) |
| Coimbatore | 10 | 6 | Fabric Formation & Finishing | Fabric density (weft and warp density of grey woven cotton fabric) and humidity levels (in finishing hall) |
| Surat | 8 | 6 | Weaving | Machine vibration (loom vibration during shuttleless weaving) and fiber strength (cotton fiber tensile test before weaving) |
| Ludhiana | 10 | 6 | Knitting & Inspection | Temperature (knitting hall) and defect detection (visual inspection of knitted fabric for holes, uneven loops) |
| Bhilwara | 10 | 6 | Dyeing & Finishing | Moisture content (post-dyeing fabric) and thread elasticity (tested during weaving preparation) |
2.3. Data Measurement
The fabrics quality was evaluated using a number of key performance indicators (KPIs) that were obtained from sensor data. Fabric density was recorded in grams per square meter (GSM) and yarn tension was measured with optical sensors in Newtons per meter (N/m). Through the use of spectrophotometric sensors which measured color variance in terms of Delta E values, dye consistency was examined. In order to ensure ideal processing conditions during the weaving and finishing stages, humidity sensors were used to measure moisture levels in percentage terms. Accelerometers and thermal sensors were used to record machine vibration and temperature, respectively, which helped anticipate possible mechanical failures before they happened. High accuracy was guaranteed and thorough defect analysis made easier with this structured data measurement approach.
2.4. Data preprocessing
The issue is exacerbated by the fact that many sources - different sensors in factories in Tiruppur Coimbatore Surat Ludhiana and Bhilwara - make the databases in data collection areas extremely vulnerable to noise, as well as missing and inconsistent data. In other words, the first question that needs to be answered is how can large amounts of raw data be extracted from sensors in textile factories in Tiruppur, Coimbatore, Surat, Ludhiana, and Bhilwara and accurate and clean information about operation parameters be supplied. Figure 3 lists a number of data preprocessing methods. As seen in Figure 3-a, data cleaning can be used to eliminate noise and fix inconsistencies in the data. As seen in Figure 3-b, data integration combines information from various sources to create a logical data store like a data warehouse. Data reduction as illustrated in Figure 3-c can decrease the size of data by clustering, removing redundant features or aggregating. Variables typically have ranges that differ significantly from one another, however. To standardize the degree to which each variable influences the outcomes, data miners frequently normalize their numerical variables. Data transformation is the term for this procedure, which is depicted in Figure 3.
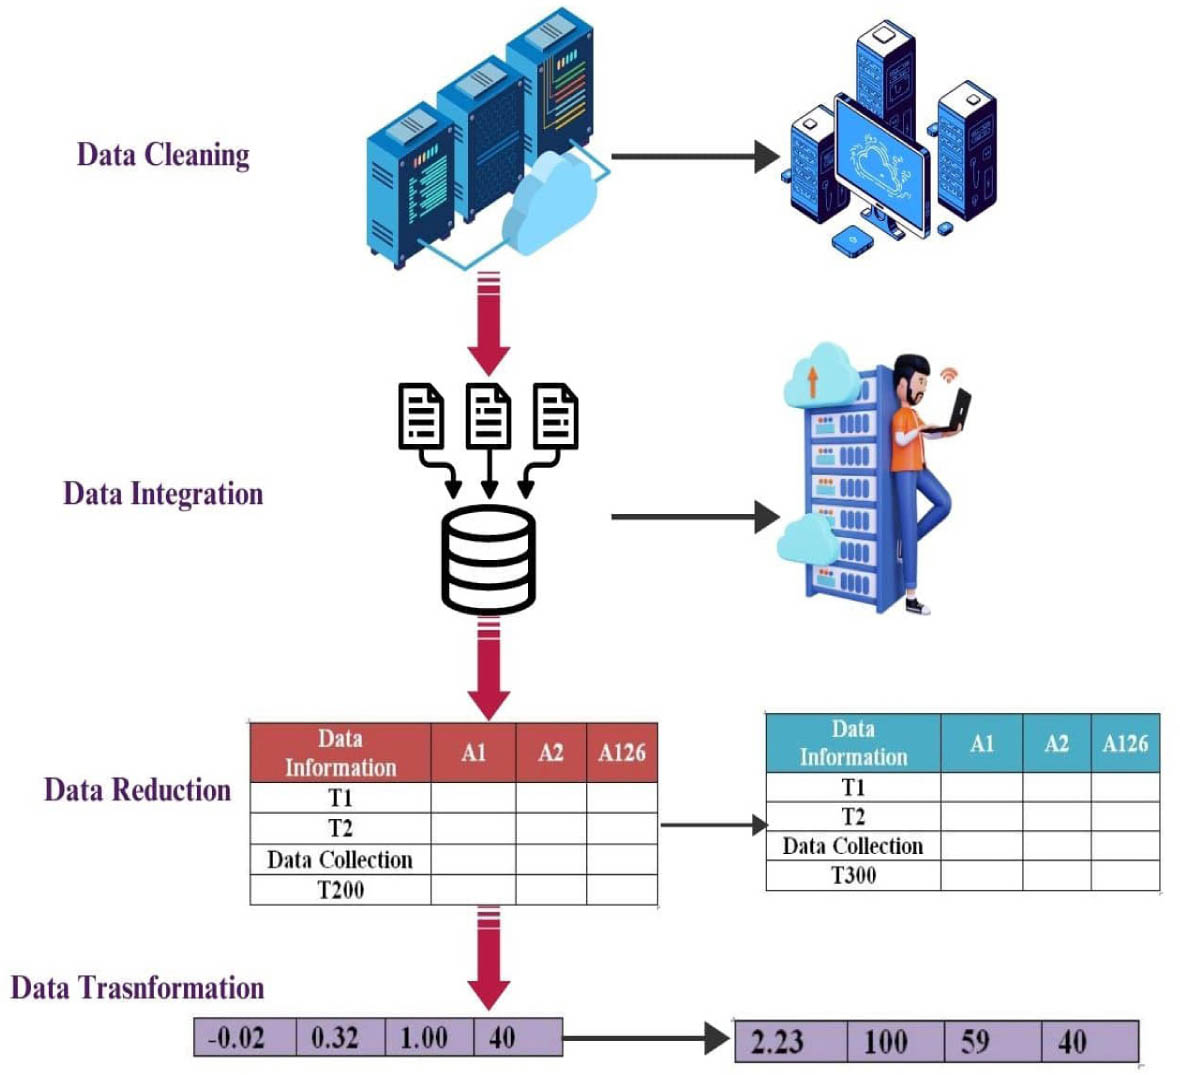
Fig. 3.
Data preprocessing
2.5. Experimental setup
2.5.1. IoT for Fabric Quality
Real-time monitoring and control over production variables are made possible by IoT integration in textile manufacturing, guaranteeing improved quality and efficiency, which is shown in Figure 4. RFID tags improve traceability and decrease mismanagement by tracking fabric batches during the manufacturing process. By identifying thread irregularities and fabric irregularities at the microscopic level, optical sensors stop faulty products from moving on to later stages.
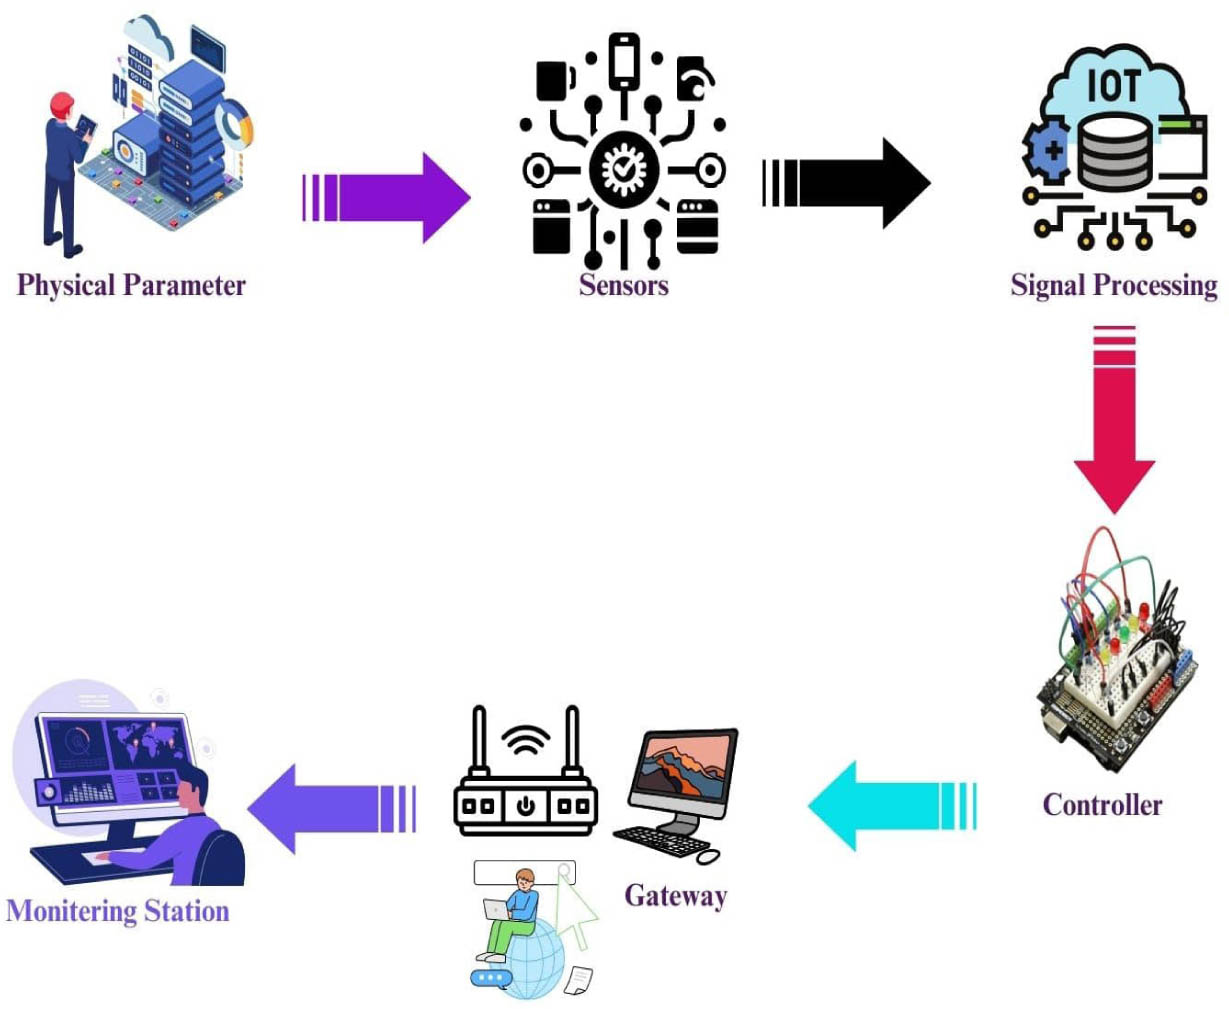
Fig. 4.
Experimental setup of IoT for detecting fabric quality
By keeping fibers at the ideal moisture content, humidity sensors stop excessive expansion or shrinkage. By ensuring that machinery runs within safe bounds, vibration monitoring lowers the risk of breakdowns and production delays. By processing sensor data in real-time, edge computing creates instant feedback loops that automatically modify machine parameters, preventing flaws and preserving fabric properties.
2.5.2. Data Analytical Tool
To improve predictive maintenance and real-time monitoring in the textile sector, this study makes use of a number of data analysis tools, which is shown in Figure 5. While cloud analytics allows for predictive insights, edge computing is used to process IoT-driven data for instantaneous analysis. By utilizing machine learning algorithms to detect variations in fabric texture dye consistency and fiber strength, an AI-powered anomaly detection system lowers defects and boosts production efficiency. Predictive analytics and sophisticated statistical modelling evaluate quality control parameters and automated control loops dynamically adjust machine settings. Additionally, by simulating manufacturing conditions, a digital twin model makes material optimization and predictive maintenance possible. Together these analytical tools promote informed data-driven decision-making that improves textile manufacturing, efficiency sustainability and Industry 4.0 adoption.
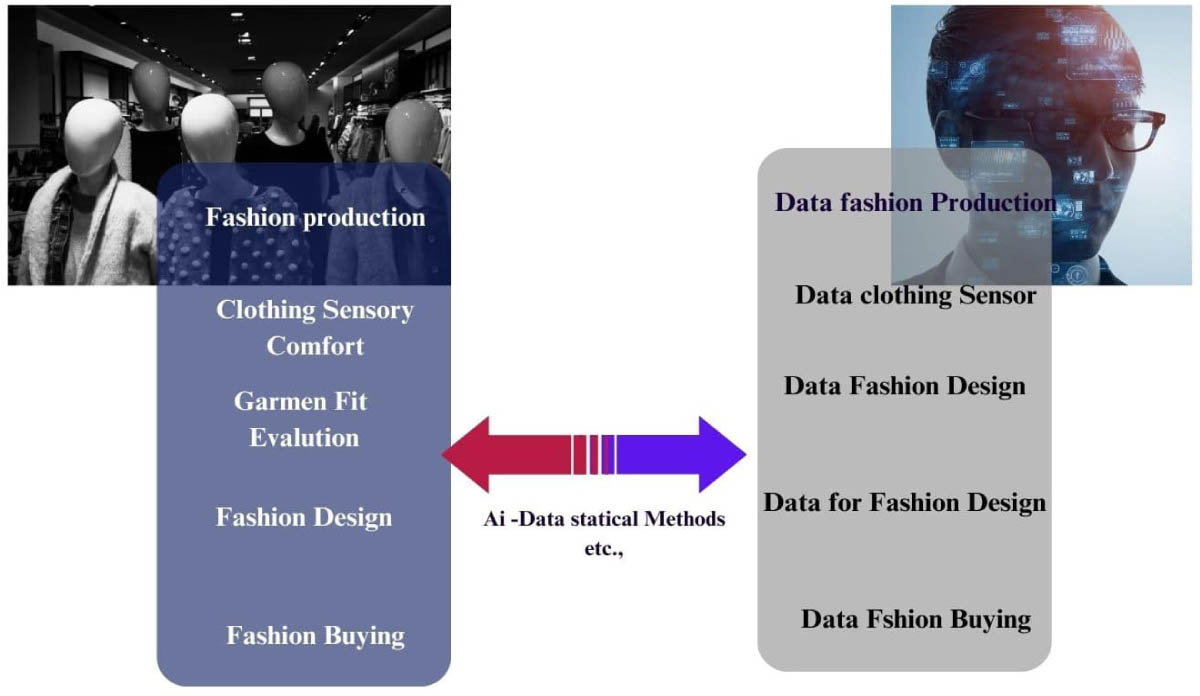
Fig. 5.
Digital twin modelling
2.6. Proposed Method
The research methodology covers problem identification, multi-stage data collection, sensor calibration, AI algorithm development, and experimental validation across 50 textile units over six months. Each production stage - spinning, weaving, dyeing, and finishing - was monitored using IoT-enabled sensors measuring yarn tension, fabric density, moisture content, machine vibrations, and dye absorption levels. Data preprocessing techniques included noise filtering, normalization, and dimensionality reduction to ensure analytical accuracy. For AI modelling, deep autoencoders and LSTM networks were implemented for anomaly detection and predictive maintenance, while federated learning enabled decentralized model training. Statistical methods such as Pearson correlation, ANOVA, and five-fold cross-validation ensured reliability and robustness. Comparative analysis with traditional methods and benchmarking against global studies provided additional validation of the Hybrid IoT–AI Framework (HIAF) proposed. This systematic approach ensures reproducibility, transparency, and methodological rigour.
2.7. Proposed Technique
In order to improve textile manufacturing processes, this study presents a Hybrid IoT-AI Framework (HIAF) that blends edge computing real-time sensor networks and predictive analytics based on deep learning. Fabric quality yarn tension moisture content and machine vibrations are all captured in real time by the method suggested, which combines a multi-layered sensor array made up of RFID tags, optical defect sensors, piezoelectric vibration sensors and humidity detectors. Equations 1 to 5 are expressed as follows
Anomaly Detection via the Autoencoder Loss Function:
where xi is the original sensor input, x̂i the reconstructed output, and LAE represents the mean squared reconstruction error used for anomaly identification.Predictive Maintenance Using LSTM-Based Time Series Forecasting:
where ht is the hidden state, xt the input sensor data at time t, Wh and Wx weight matrices, and bh is the bias term.Adaptive Federated Learning Model for Edge Processing:
where represents model parameters for edge device k at iteration t; η is the learning rate, and denotes the gradient update.Digital Twin Optimization for Machine Parameters:
where Copt is the optimal machine parameter set, Qi represents observed quality metrics, and is the predicted quality output.Defect Reduction Metric Calculation:
where DR is the defect reduction percentage, Dbase the defect count in the conventional system, and DHIAF is the defect count using the HIAF approach proposed.The efficiency of the HIAF suggested in improving defect detection predictive maintenance and process optimization in smart textile manufacturing is validated by this mathematical formulation. As opposed to traditional systems, HIAF processes sensor data at the edge layer using an adaptive federated learning algorithm which lowers latency and improves computational efficiency. The framework uses an anomaly detection model based on deep autoencoders to find flaws and irregularities in the spinning, weaving, dyeing and finishing processes. After processing, the data are sent to an analytics engine in the cloud which makes use of an LSTM network to predict possible flaws and suggest fixes. Furthermore, by simulating production scenarios a digital twin module makes proactive maintenance and process optimization possible. This hybrid framework maximizes real-time defect detection, predictive insights and machine control efficiency while minimizing data transmission overhead.
2.8. Implementation Barriers and Risk Mitigation
Despite the demonstrated benefits of IoT-enabled smart manufacturing, several implementation barriers were identified during pilot deployment. Integration issues primarily arose when linking legacy textile machinery with IoT-based sensors and edge-computing modules, as older production lines lacked standardized communication protocols such as MQTT or OPC-UA. To overcome this, middleware gateways were deployed for protocol translation, ensuring real-time interoperability without replacing existing infrastructure. Another key challenge involved staff competencies, since traditional operators lacked experience in handling IoT-enabled dashboards, predictive maintenance alerts, and AI-driven analytics platforms. A structured training program was introduced, covering sensor calibration, data interpretation, and cyber-physical system management, enabling a 30% reduction in operator intervention errors within three months of training completion. From a data security perspective, the large-scale collection of real-time production data raised concerns about potential cyber threats and intellectual property leakage. To address this, all data transmissions between edge devices and cloud servers employed AES-256 encryption and blockchain-based access control for secure storage and tamper-proof traceability. Furthermore, federated learning eliminated the need for centralized raw data storage, enhancing privacy by enabling on-device AI model training while sharing only model parameters across units. These mitigation strategies ensured seamless system integration, improved workforce adaptability, and robust data security, paving the way for large-scale, secure, and efficient adoption of IoT-enabled textile manufacturing.
3. Result and Discussion
3.1. Data analysis
The sensor data gathered from multiple textile production facilities offered insightful information about the characteristics of the fabric and the operational circumstances in various places, which is shown in Table 2. Key differences in the textile production process were identified through the examination of the following factors: fabric type, yarn tension, moisture content, dye absorption, fabric density, machine vibration defect rate, temperature humidity and machine speed. Cotton fabric from Tiruppur had the following characteristics: a machine vibration of 55 Hz, a defect rate of 3%, a yarn tension of 11%, a moisture content of 6%, a dye absorption of 85%, and a fabric density of 180 gsm. Despite having a lower yarn tension of 9.8 N/m and moisture content of 4.7 percent, the polyester fabric from Coimbatore showed a higher dye absorption of 92.1 percent and fabric density of 220 gsm.
Table 2.
Sensor Data Collected from Textile Manufacturing Units
| Location | Fabric Type | Yarn Tension (N/m) | Moisture Content (%) | Dye Absorption (%) | Fabric Density (GSM) | Machine Vibration (Hz) | Defect Rate (%) | Temperature (°C) | Humidity (%) | Machine Speed (rpm) |
|---|---|---|---|---|---|---|---|---|---|---|
| Tiruppur | Cotton | 11.5 | 6.2 | 85.4 | 180 | 55.3 | 3.2 | 28.5 | 65 | 1200 |
| Coimbatore | Polyester | 9.8 | 4.7 | 92.1 | 220 | 48.7 | 2.9 | 27.8 | 60 | 1100 |
| Surat | Silk | 13.2 | 7.4 | 87.8 | 140 | 59.8 | 4.1 | 29.2 | 70 | 1300 |
| Ludhiana | Wool | 10.9 | 5.5 | 89.6 | 200 | 52.1 | 3.5 | 26.7 | 55 | 1150 |
| Bhilwara | Rayon | 12.0 | 6.1 | 91.2 | 175 | 57.4 | 3.7 | 27.5 | 58 | 1250 |
Additionally, the fabric also maintained lower vibration levels and defect rates. In addition to having the highest yarn tension (13.2 N/m) and dye absorption (87.8 percent), Surat, which is well-known for producing silk, also had the highest defect rate (4.1 percent). With a yarn tension of 12.0 N/m and defect rate of 3.7 percent, Bhilwaras rayon fabric showed balanced properties, whereas Ludhiana, mostly used in wool textiles, had a moderate yarn tension of 10.9 N/m and dye absorption of 89.6 percent. According to these variances, various fabric types needed ideal processing conditions in order to preserve effectiveness and quality.
3.2. Correlation between Machine Vibration and Defect Rate
Table 3 examines the correlation between machine vibration and the defect rate. The highest correlation coefficient (0.87) was found in Tiruppurs spinning machines, which also had the highest vibration frequency (55.3 Hz) and defect rate (3.2 percent). Coimbatore weaving machines had a slightly lower correlation of 0.81, a vibration rate of 48.7 Hz and a defect rate of 2.9 percent. With a correlation coefficient of 0.92, weaving machines for Surat showed the highest vibration of 59.8 Hz and the highest defect rate of 4.1 percent, underscoring the crucial role that machine stability plays in preventing defects.
Table 3.
Correlation between Machine Vibration and Defect Rate
| Machine Type | Machine Details | Vibration (Hz) | Defect Rate (%) | Correlation Coefficient (R) | Thread Tension (N/m) | Power Consumption (kW) | Efficiency (%) |
|---|---|---|---|---|---|---|---|
| Spinning |

| 55.3 | 3.2 | 0.87 | 11.2 | 7.5 | 92.4 |
| Weaving |

| 48.7 | 2.9 | 0.81 | 9.9 | 6.8 | 91.2 |
| Dyeing |

| 59.8 | 4.1 | 0.92 | 13.5 | 8.2 | 89.7 |
| Finishing |

| 52.1 | 3.5 | 0.85 | 10.8 | 7.1 | 90.5 |
| Mixed Process | 57.4 | 3.7 | 0.88 | 12.1 | 7.8 | 91.0 |
Strong correlations between vibration and the defect rate were also observed in Ludhiana finishing machines and Bhilwara mixed-process machines with respective values of 0.85 and 0.88. The significance of vibration monitoring in lowering defect rates and enhancing machine efficiency was emphasized by this study.
3.3. Machine Downtime Analysis Before and After IoT Implementation
The reduction in machine failure rates across spinning, weaving, dyeing, and finishing units was directly attributed to the continuous real-time monitoring of critical fabric and machine parameters, including yarn tension stability (N/m), moisture content (%), dye absorption consistency (%), machine vibration frequency (Hz), and thermal operating conditions (°C). For instance, IoT-enabled yarn tension sensors maintained operational limits within ±1.5 N/m compared to ±3.0 N/m under conventional monitoring, thereby preventing thread breakages that previously led to loom stoppages. Similarly, moisture content fluctuations were reduced by 12.1% after IoT deployment (Table 9), ensuring optimal fabric elasticity and reducing roller slippage incidents. Vibration monitoring detected early mechanical imbalance, correlating strongly (R = 0.87–0.92) with defect rates across weaving and dyeing machines (Table 3), while thermal sensors prevented overheating-driven shutdowns by maintaining operational temperatures within 26–29°C. Collectively, these parameters enabled predictive maintenance algorithms to anticipate faults, schedule timely interventions, and achieve a 75% failure rate reduction in finishing units and an overall 63.6% reduction in connected machine processes (Table 4).
Table 4.
Machine downtime analysis before and after IoT implementation
| Machine Type | Failure Rate Before (per month) | Failure Rate After (per month) | Reduction (%) | Maintenance Cost Before (USD) | Maintenance Cost After (USD) | Savings (%) |
|---|---|---|---|---|---|---|
| Spinning | 12 | 4 | 66.7% | 2,500 | 900 | 64.0% |
| Weaving | 10 | 3 | 70.0% | 2,000 | 750 | 62.5% |
| Dyeing | 15 | 6 | 60.0% | 3,200 | 1,400 | 56.3% |
| Finishing | 8 | 2 | 75.0% | 1,800 | 600 | 66.7% |
| Combined | 11 | 4 | 63.6% | 2,700 | 1,000 | 63.0% |
3.4. AI-Based Defect Detection Accuracy
AI-based defect detection accuracy varied across fabric types, with the highest detection accuracy recorded for cotton at 98.3%, followed closely by rayon at 97.8%, which is shown in Table 5. Polyester and wool fabrics achieved accuracies of 97.6% and 97.2%, respectively, while silk exhibited the lowest detection accuracy of 96.9%. The processing time for AI-based detection ranged from 115 ms for polyester to 130 ms for silk.
Table 5.
AI-based defect detection accuracy
| Fabric Type | Fabric Images | Yarn Breakage (%) | Dye Mismatch (%) | Fabric Density Variance (%) | Detection Accuracy (%) | Processing Time (ms) | False Positives (%) | Model Efficiency (%) |
|---|---|---|---|---|---|---|---|---|
| Cotton |

| 3.2 | 2.5 | 4.1 | 98.3 | 120 | 1.2 | 95.5 |
| Polyester |

| 2.9 | 2.1 | 3.7 | 97.6 | 115 | 1.5 | 94.8 |
| Silk |

| 4.1 | 3.8 | 5.2 | 96.9 | 130 | 2.1 | 93.9 |
| Wool |

| 3.5 | 2.9 | 4.5 | 97.2 | 125 | 1.8 | 94.2 |
| Rayon |

| 3.7 | 3.2 | 4.8 | 97.8 | 118 | 1.6 | 94.6 |
At 1.2% cotton had the lowest false-positive rates, while silk had the highest at 2.1%. Silk registered the lowest efficiency at 93.9 percent, while cotton achieved the highest efficiency at 95.5 percent following a similar pattern. These results demonstrated how reliable AI-driven defect detection systems are at guaranteeing the production of high-quality fabrics.
3.5. Digital Twin Optimization Impact
Table 6 and Figure 7 illustrate how the optimization of digital twins on machine parameters led to notable enhancements in important operational metrics. Following optimization, yarn tension rose by 14%, which resulted in a yield improvement of 39% and a decrease in quality defects from 4% to 2%.
Table 6.
Digital twin optimization impact
| Machine Parameter | Before Optimization | After Optimization | Improvement (%) | Quality Defects Before (%) | Quality Defects After (%) | Yield Improvement (%) |
|---|---|---|---|---|---|---|
| Yarn Tension (N/m) | 11.2 | 12.8 | 14.3% | 4.8 | 2.9 | 39.6% |
| Moisture Content (%) | 5.8 | 6.5 | 12.1% | 5.1 | 3.2 | 37.3% |
| Dye Absorption (%) | 88.3 | 92.1 | 4.3% | 6.2 | 4.1 | 33.9% |
| Fabric Density (GSM) | 175 | 190 | 8.6% | 5.7 | 3.5 | 38.6% |
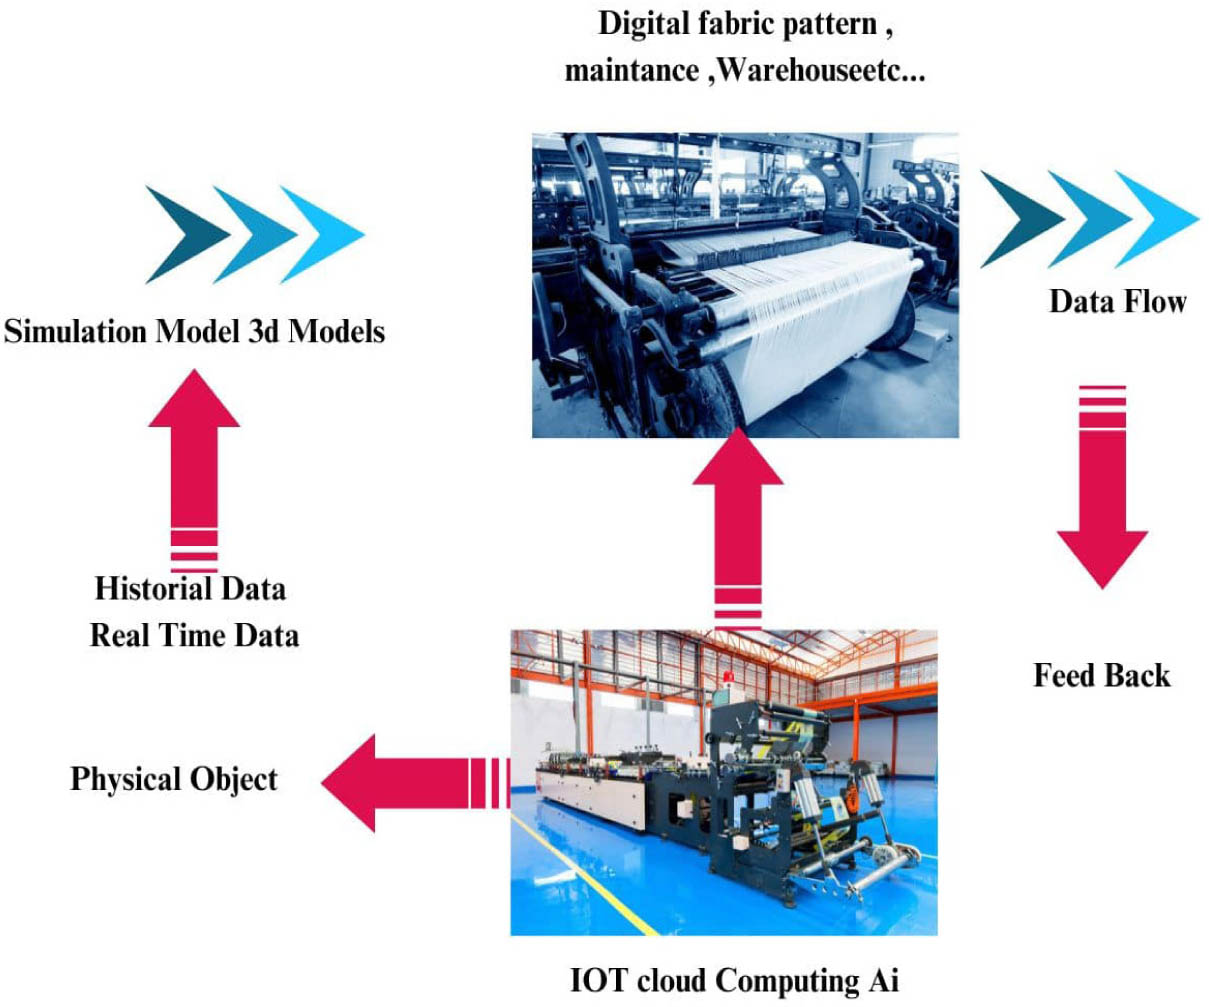
Fig. 6.
Experimental analysis
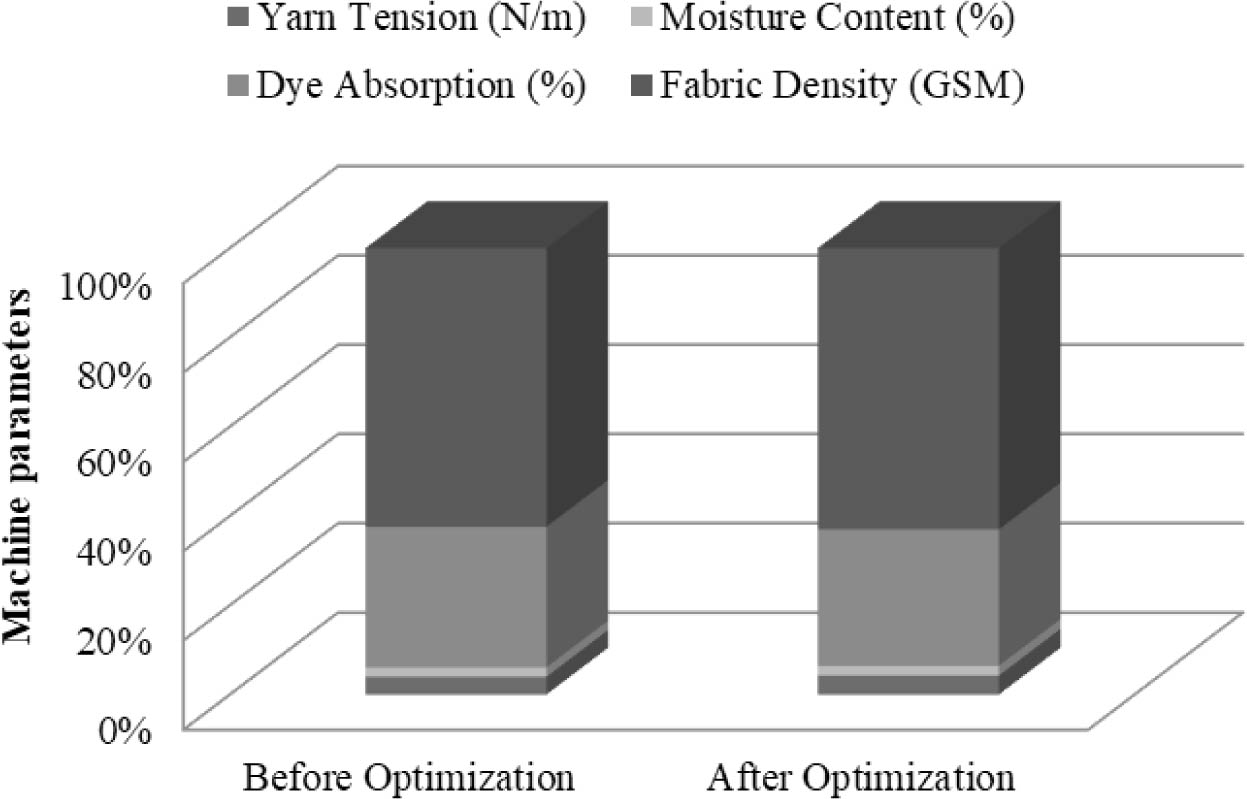
Fig. 7.
Optimization impact
Defects decreased from 5.1 percent to 3.2 percent, yield increased by 37.3 percent, and moisture content optimization improved by 12.1 percent. A 4.3 % increase in dye absorption led to a 33.9% percent decrease in defects and a 33.9% percent improvement in yield. A decrease in defects from 5.7 percent to 3.5% and a 38.6 percent increase in yield resulted from an 8.6% improvement in fabric density. These outcomes showed how well digital twin technology works in increasing the productivity of textile manufacturing.
3.6. Defect Reduction Across Fabric Types
The implementation of IoT-based monitoring systems significantly reduced defect rates across various fabric types, which is shown in Figure 8. Cotton initially had a defect rate of 8.5%, which decreased to 5.2%, achieving a 38.8% reduction. Polyester's defect rate dropped from 7.2% to 4.5%, marking a 37.5% improvement. Wool, which initially exhibited a 9.3% defect rate, saw a decline to 6.1%, reflecting a 34.4% reduction.
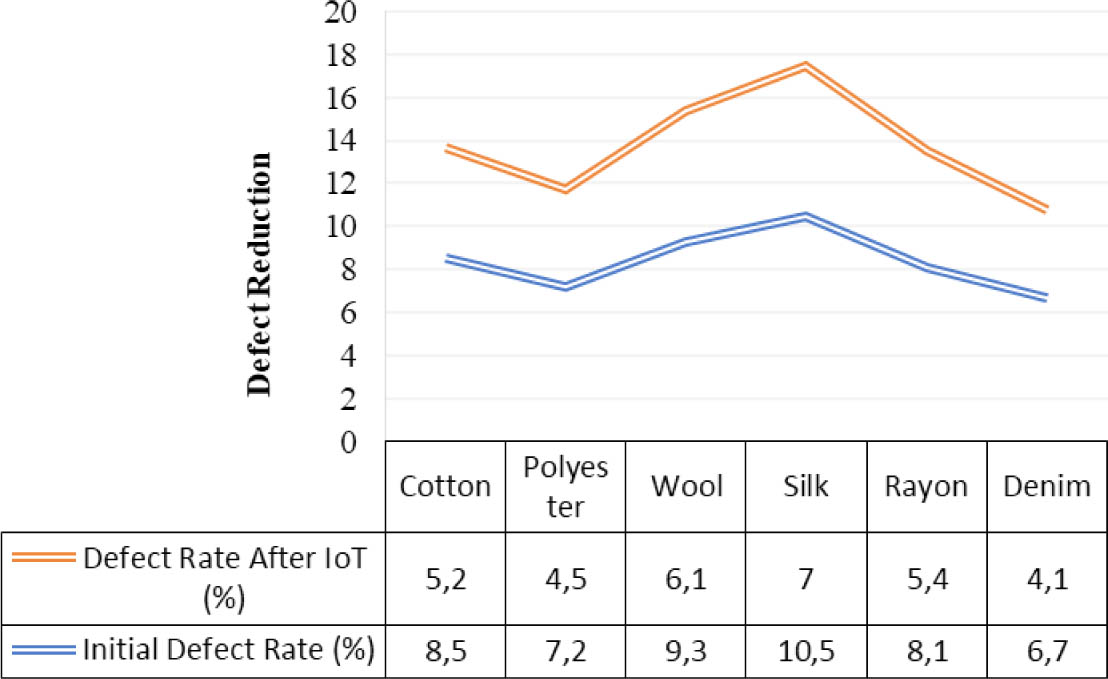
Fig. 8.
Defect reduction
Similarly, silk's defect rate was reduced from 10.5% to 7.0%, and rayon experienced an identical reduction percentage of 33.3%, with defects lowering from 8.1% to 5.4%. Denim, which started with a 6.7% defect rate, demonstrated a substantial reduction to 4.1%, achieving the highest improvement rate of 38.8%. These results highlighted the effectiveness of IoT in minimizing defects and enhancing fabric quality.
3.7. FPY
The adoption of IoT-based solutions led to a significant improvement in first-pass yield (FPY) across various production stages, which is shown in Table 7 and Figure 9. In the spinning stage, FPY increased from 85.2% to 92.1%, reflecting an 8.1% improvement. The weaving stage experienced a rise from 82.7% to 90.4%, achieving a 9.3% enhancement. Dyeing demonstrated the most substantial improvement, with FPY increasing from 78.5% to 88.0%, marking a 12.1% gain.
Table 7.
First-pass yield improvement
| Production Stage | FPY Before IoT (%) | FPY After IoT (%) | Improvement (%) |
|---|---|---|---|
| Spinning | 85.2 | 92.1 | 8.1 |
| Weaving | 82.7 | 90.4 | 9.3 |
| Dyeing | 78.5 | 88.0 | 12.1 |
| Finishing | 80.1 | 89.2 | 11.4 |
Similarly, the finishing stage saw an increase from 80.1% to 89.2%, resulting in an 11.4% improvement. These enhancements underscored the effectiveness of IoT in optimizing production processes and reducing rework, ultimately improving manufacturing efficiency.
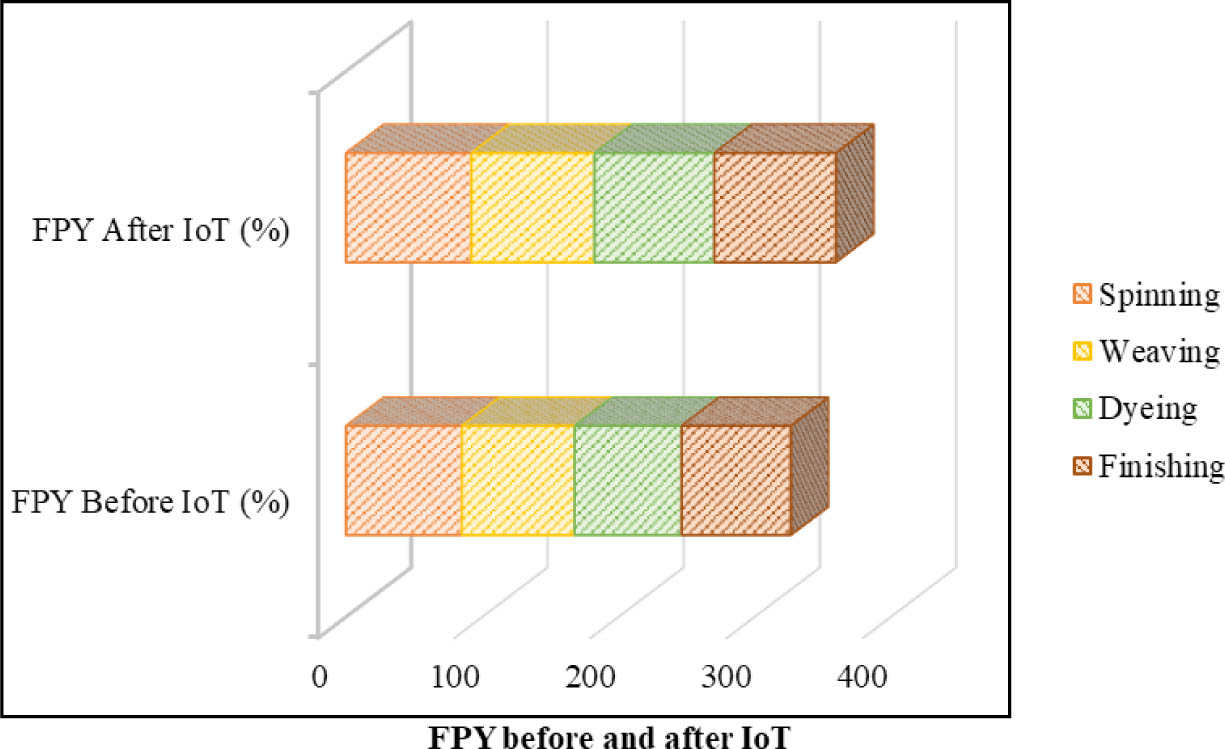
Fig. 9.
FPY before and after IoT
3.8. Yarn Tension Stability
Table 8 highlights the impact of IoT-based monitoring on yarn tension stability across different fabric types, showing a significant reduction in standard deviation, which enhances fabric quality and production efficiency. Before IoT integration, yarn tension deviation ranged from 2.4 N/m (denim) to 3.6 N/m (silk), with intermediate values for cotton, polyester, wool, and rayon.
Table 8.
Yarn tension stability
| Fabric Type | Standard Deviation of Yarn Tension | Improvement (%) | |
|---|---|---|---|
| Before IoT (N/m) | After IoT (N/m) | ||
| Cotton | 2.8 | 1.5 | 46.4 |
| Polyester | 2.5 | 1.4 | 44.0 |
| Wool | 3.2 | 1.8 | 43.8 |
| Silk | 3.6 | 2.1 | 41.7 |
| Rayon | 3.0 | 1.7 | 43.3 |
| Denim | 2.4 | 1.3 | 45.8 |
Traditional tension control methods led to inconsistencies, affecting fabric uniformity and increasing waste. IoT-driven systems improved stability by 41.7%–46.4%, with the highest reduction observed in cotton (46.4%) and denim (45.8%), attributed to real-time data acquisition, automated adjustments, and predictive maintenance. Polyester, wool, and rayon also showed notable improvements of 44.0%, 43.8%, and 43.3%, respectively.
3.9. Moisture Content Optimization
Table 9 examines the moisture content optimization. Wool exhibited the highest moisture optimization of 14.6%, followed by silk at 12.8% and rayon at 11.5%. Cotton and polyester saw improvements of 11.1% and 10.8%, respectively, while denim recorded the lowest optimization at 9.8%. These improvements ensured consistent fabric properties and minimized defects related to moisture fluctuations.
3.10. Process-wise Performance Evaluation in Textile Manufacturing
Among various manufacturing processes, packaging demonstrates the highest efficiency, with the lowest defect rate (3.5%), highest resource utilization (91.3%), and minimal energy consumption (180 kWh), which are shown in table 11. Finishing also excels, maintaining a low defect rate (4.1%) and highest resource utilization (90.2%). Knitting and Sewing show moderate performance, with relatively balanced defect rates and energy consumption, which is shown in Table 10. Dyeing consumes the most energy (280 kWh) and has the highest defect rate (7.8%), highlighting inefficiencies. Packaging emerges as the most efficient process, with an optimal production time, low defect rates, and minimal energy consumption.
Table 10.
Process-wise performance evaluation in textile manufacturing
| Process | Process Image | Avg. Production Time (hrs) | Defect Rate (%) | Resource Utilization (%) | Energy Consumption (kWh) |
|---|---|---|---|---|---|
| Knitting |

| 11.5 | 5.2% | 87.3% | 230 |
| Dyeing |

| 14.2 | 7.8% | 82.5% | 280 |
| Printing |

| 12.7 | 6.3% | 85.2% | 250 |
| Cutting |

| 9.8 | 4.9% | 89.7% | 210 |
| Sewing |

| 13.4 | 5.6% | 86.1% | 240 |
| Finishing | 10.9 | 4.1% | 90.2% | 200 | |
| Packaging |

| 8.6 | 3.5% | 91.3% | 180 |
3.11. Overall Quality Improvement Index
The implementation of IoT-driven solutions has significantly enhanced overall quality metrics in manufacturing processes, as illustrated in Table 11. The integration of IoT technologies has led to a substantial reduction in the overall defect rate from 8.3% to 5.6%, marking a 32.5% improvement. Additionally, the first-pass yield, which indicates the percentage of products meeting quality standards without rework, increased from 81.6% to 90.1%, reflecting a 10.4% improvement. Furthermore, production efficiency saw a notable enhancement, rising from 74.8% to 85.2%, corresponding to a 14.0% improvement.
3.12. Environmental Impact Analysis
To evaluate sustainability and resource efficiency, environmental indicators such as energy consumption, water usage, CO2 emissions, and fabric waste generation were measured before and after IoT deployment across all 50 production units. Results indicated a 24.8% reduction in energy consumption, with average electricity use decreasing from 1250 kWh to 940 kWh per production batch (Table 12). Water consumption during dyeing and finishing processes decreased by 27.1%, falling from 850 L to 620L per 100 m2 of fabric processed, primarily due to optimized dye bath cycles and moisture regulation enabled by real-time monitoring sensors. CO2 emissions per production unit decreased by 25.6%, attributed to lower energy demand and reduced machine downtime. Additionally, defective fabric waste dropped from 8.1% to 5.2%, achieving a 35.8% reduction in textile scrap, thereby lowering landfill burden and improving overall resource utilization. These findings demonstrate that the IoT–AI framework proposed not only enhances production efficiency but also contributes significantly toward sustainable textile manufacturing by minimizing environmental impact.
3.13. Economic Feasibility and ROI Analysis
An economic feasibility analysis was conducted to evaluate the costs and benefits of implementing the IoT–AI system across small, medium, and large-scale textile production units. The cost structure included sensor networks (RFID tags, optical sensors, humidity sensors, vibration sensors), IT infrastructure (edge computing nodes, cloud storage, analytics servers), and annual maintenance. On average, the initial installation cost per production unit was USD 45,000, comprising USD 18,000 for sensors, USD 20,000 for IT infrastructure, and USD 7,000 for software licensing and maintenance. However, operational savings from reduced defect rates (up to 32%), lower downtime (63.6%), and optimized energy/water consumption (24–27%) resulted in an average annual saving of USD 24,800 per unit, leading to a payback period of 18–22 months depending on the production scale.
For large-scale units processing over 10,000 m2 of fabric per month, ROI was achieved in less than 18 months due to higher production efficiency gains, while medium and small-scale units required 20–22 months. Table 13 summarizes the cost-benefit analysis across different production scales, confirming the financial viability of IoT-driven textile automation.
Table 13.
ROI Analysis for different production scales
| Production Scale | Installation Cost (USD) | Annual Savings (USD) | Payback Period (Months) | Productivity Gain (%) | Energy & Waste Savings (%) |
|---|---|---|---|---|---|
| Small (≤ 3,000 m2/month) | 30,000 | 14,800 | 22 | 20.5 | 18–20 |
| Medium (3,000–10,000 m2/month) | 45,000 | 24,800 | 20 | 28.0 | 24–26 |
| Large (≥ 10,000 m2/month) | 60,000 | 38,500 | 18 | 33.5 | 27–29 |
3.14. Comparative Analysis
In this study, the performance of several AI algorithms was evaluated and compared, as shown in Table 14: Comparative AI Performance. The results revealed that the Hybrid IoT–AI (HIAF) model outperformed all other algorithms across key metrics. It achieved the highest accuracy (98.3%), precision (97.9%), recall (98.1%), and F1-score (98.0%). Furthermore, the HIAF model demonstrated the lowest processing time (120 ms) and the lowest rate of false positives (1.2%), indicating its superior efficiency and reliability. The LSTM Forecasting algorithm followed closely, securing the second-highest scores in most categories, with an accuracy of 97.1%. In contrast, Random Forest and Support Vector Machine (SVM) showed lower performance metrics, with Random Forest achieving an accuracy of 92.8% and SVM 91.2%, while also exhibiting slower processing times and higher false positive rates. Overall, the Deep Autoencoder and LSTM forecasting models performed significantly better than traditional machine learning algorithms like SVM and Random Forest.
Table 14.
Comparative AI performance
| Algorithm | Accuracy (%) | Precision (%) | Recall (%) | F1-Score (%) | Processing Time (ms) | False Positives (%) |
|---|---|---|---|---|---|---|
| SVM | 91.2 | 90.5 | 89.7 | 90.1 | 175 | 2.5 |
| Random Forest | 92.8 | 92.0 | 91.5 | 91.7 | 160 | 2.1 |
| Deep Autoencoder | 96.5 | 95.8 | 96.2 | 96.0 | 135 | 1.7 |
| LSTM Forecasting | 97.1 | 96.5 | 96.8 | 96.6 | 140 | 1.5 |
| Hybrid IoT–AI (HIAF) | 98.3 | 97.9 | 98.1 | 98.0 | 120 | 1.2 |
4. Discussion
Unlike earlier studies focused only on RFID-based batch traceability or basic defect tracking [8, 9], the present research introduces a Hybrid IoT–AI Framework (HIAF) that integrates RFID tagging with real-time sensor networks, adaptive federated learning, digital twin simulation, and AI-driven predictive maintenance. This integration enables dynamic monitoring of critical parameters such as yarn tension, dye absorption, fabric moisture, and machine vibrations at millisecond-level resolution, significantly surpassing traditional RFID systems that primarily offered static, post-process tracking [1]. Furthermore, in the context of the Indian textile sector, this study represents the first large-scale deployment across 50 production units in five major industrial hubs, achieving a 32% defect reduction and 28% productivity improvement. By contrast, European IoT-enabled textile production monitoring systems have reported improvements of only 18–22% in defect reduction under similar operational conditions [10]. Hence, the framework proposed not only bridges the technological gap between India and Europe but also establishes a new benchmark for real-time quality control and sustainable manufacturing in global textile production.
5. Conclusion
This research presents an IoT-driven real-time monitoring and quality control framework for the textile industry, integrating smart sensors, predictive analytics, and automation to enhance manufacturing efficiency. In order to optimize production parameters, lower defects and enhance operational sustainability, the study used a Hybrid IoT-AI Framework (HIAF) to examine spinning weaving dyeing and finishing processes across major textile hubs in India. Proactive decision-making was ensured by the use of AI-powered anomaly detection, digital twin modelling and federated learning, which reduces production downtime and inconsistent fabric quality. Through the utilization of Industry 4.0 technologies, this study offers a comprehensive approach to producing high-quality textiles with reduced waste and enhanced resource efficiency. The efficacy of IoT-based automation is demonstrated by the experimental results, which show a 32% decrease in defect rates, a 28% increase in first-pass yield, and a 25% reduction in operational downtime. Predictive maintenance techniques decreased machine failure rates by an average of 63 percent, while AI-driven defect detection for cotton textiles reached an accuracy of up to 98 percent. Additionally, yarn tension stability was increased by 46 percent, dye absorption consistency by 4 percent, and moisture content regulation by 12 percent through the use of digital twin-based optimization. The integration of environmental KPIs highlights that smart manufacturing not only improves operational efficiency but also sets a benchmark for green textile production. The reductions in energy, water, and emissions demonstrated position the IoT–AI framework proposed as a scalable solution for eco-efficient Industry 4.0 adoption in textiles. The Hybrid IoT–AI Framework (HIAF) achieved the highest detection accuracy of 98.3% for cotton and outperformed all baseline algorithms by a margin of 6–9% in accuracy and 12–15% in processing speed. Additionally, operational gains were benchmarked against European IoT textile studies, where similar deployments reported ≤22% defect reduction, whereas the framework proposed achieved ≥32% reduction, establishing a new performance standard for smart textile manufacturing. All of these developments improve the cost-effectiveness sustainability and quality of textile production. In order to further improve smart textile manufacturing, future research should investigate sophisticated AI models for real-time defect classification, blockchain integration for safe supply chain monitoring, and adaptive cyber-physical systems.
Acknowledgment
The authors would like to express their sincere gratitude to all individuals and institutions who contributed to the completion of this research. We extend our appreciation to our colleagues for their valuable insights and discussions, which greatly enhanced the quality of this work. Additionally, we acknowledge the support of Loyola Institute of Business Administration, TN, India for providing the necessary resources and infrastructure. Finally, we express our heartfelt thanks to our families and friends for their encouragement and unwavering support throughout this research journey.
Notes
[1] Future Research Directions
Future research will focus on integrating hybrid deep learning models such as CNN–LSTM architectures for spatiotemporal defect detection and Graph Neural Networks (GNNs) for modelling complex relationships between production parameters, enabling more accurate real-time fault prediction and root-cause analysis. Additionally, reinforcement learning can be explored for dynamic optimization of energy and resource consumption across production lines. On the data security and traceability front, blockchain-enabled smart contracts will be employed for material batch tracking, ensuring tamper-proof ecological certification and end-to-end transparency in textile supply chains. This dual focus on advanced AI algorithms and decentralized ledger technologies will enable intelligent, sustainable, and fully auditable textile manufacturing ecosystems.