
Table 1.
Influence of the carbon source on the biomass and yeast Y. lipolytica IPS21 protein concentration. Values for single elements are not significantly different (P < 0.05) according to Tukey’s Kramer test for multiple comparison of the biomass or total protein marked with the same letter
| Carbon source | Biomass production, g g-1 of carbohydrate substrate | Total protein, μg mL-1 |
|---|---|---|
| Yeast extract | 0.385 ± 0.02d | 120 ± 5.20a |
| Glucose | 0.452 ± 0.11aa | 124 ± 4.73a |
| Glycerol | 0.465 ± 0.03aa | 120 ± 6.55a |
| Starch | 0.401 ± 0.02d | 114 ± 4.66a |
| Semolina wheat | 0.225 ± 0.09a | 111 ± 7.22a |
| Oat | 0.317 ± 0.12b | 109 ± 1.99a |
| Saccharose | 0.364 ± 0.09c | 130 ± 2.33a |
| Pectin | 0.299 ± 0.16b | 128 ± 2.98a |
| Straw | 0.364 ± 0.04c | 112 ± 7.66a |
| Saccharose + CTLS* | 0.354 ± 0.04c | 124 ± 8.13a |
| Starch + CTLS | 0.320 ± 0.08b | 120 ± 5.78a |
| CTLS | 0.204 ± 0.09a | 110 ± 2.59a |
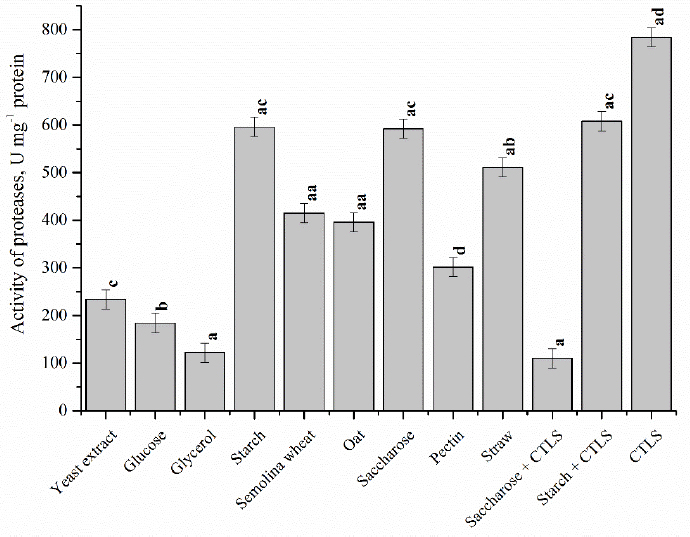
Fig. 1.
*CTLS - chrome-tanned leather shavings
Influence of the carbon source on the activity of the proteases of the yeast Y. lipolytica IPS21. Values for single elements are not significantly different (P < 0.05) according to Tukey’s Kramer test for multiple comparisons of supernatants marked with the same letter
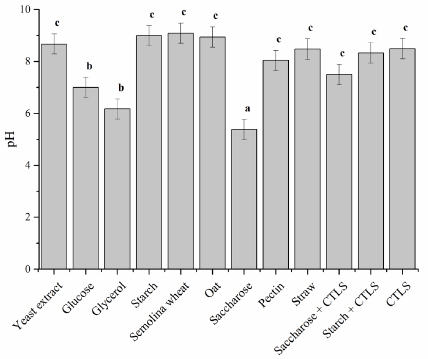
Fig. 2.
*CTLS -chrome-tanned leather shavings
Influence of the carbon source on the pH of the medium during the biological process with the yeast Y. lipolytica IPS21. Values for single elements are not significantly different (P < 0.05) according to Tukey’s Kramer test for multiple comparisons of the medium marked with the same letter
Table 2.
Composition of amino acids in the supernatant after 48 hours of biological treatment with Y. lipolytica IPS21
| Name of acid | Yeast extract medium with Yarrowia | CTLS medium with Yarrowia | Yeast extract medium without Yarrowia | CTLS medium without Yarrowia |
|---|---|---|---|---|
| g 100 g-1 of supernatant | ||||
| Aspartic acid | 0.03 | 0.22 | 0.07 | 0.13 |
| Threonine | <0.02 | 0.05 | 0.07 | 0.04 |
| Serine | <0.02 | 0.10 | <0.02 | 0.06 |
| Glutamic acid | 0.09 | 0.29 | 0.09 | 0.26 |
| Proline | <0.02 | 0.33 | 0.03 | 0.25 |
| Glycine | <0.02 | 0.55 | 0.02 | 0.37 |
| Alanine | <0.02 | 0.21 | 0.06 | 0.20 |
| Valine | <0.02 | 0.05 | 0.05 | 0.06 |
| Methionine | <0.02 | <0.02 | <0.02 | <0.02 |
| Isoleucine | <0.02 | 0.19 | 0.03 | 0.05 |
| Leucine | <0.02 | 0.08 | 0.06 | 0.08 |
| Tyrosine | <0.02 | 0.03 | 0.03 | 0.03 |
| Phenylalanine | <0.02 | 0.07 | 0.04 | 0.05 |
| Ornithine | <0.02 | <0.02 | <0.02 | <0.02 |
| Gamma-Aminobutyric acid | <0.02 | <0.02 | <0.02 | <0.02 |
| Lysine | <0.02 | 0.09 | 0.05 | 0.12 |
| Histidine | <0.02 | 0.03 | <0.04 | <0.02 |
| Arginine | <0.02 | 0.17 | 0.03 | 0.11 |
| Taurine, 2-aminoethanesulfonic acid | <0.02 | <0.02 | <0.02 | <0.02 |
| Hydroxyproline | <0.02 | 0.30 | <0.02 | 0.17 |
| Cysteine | <0.02 | <0.02 | <0.02 | <0.02 |
| Hydroxylysine | <0.02 | 0.04 | <0.02 | <0.02 |
| Sum of amino acid content (mean value) | 0.12 | 2.78 | 0.63 | 1.98 |
Table 3.
Influence of the amount of yeast extract in the medium with 0.6 g of CTLS on the biomass and protein concentration of the yeast Y. lipolytica IPS21. Values for single elements are not significantly different (P<0.05) according to Tukey’s Kramer test for multiple comparisons of biomass or the total protein marked with the same letter
| Carbon sources | Biomass production, g g-1 of carbohydrate substrate | Total protein, μg mL-1 |
|---|---|---|
| 0.6 g yeast extract | 0.205 ± 0.14a | 112.4 ± 6.55c |
| 0.4 g yeast extract | 0.375 ± 0.16c | 89.2 ± 4.22b |
| 0.2 g yeast extract | 0.316 ± 0.09b | 64.2 ± 4.33a |
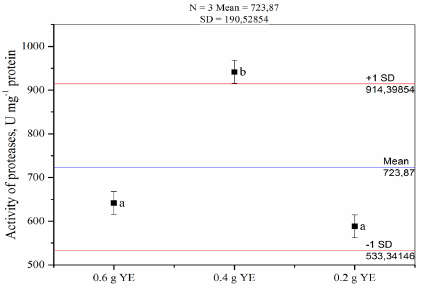
Fig. 3.
*YE – yeast extract
Influence of the amount of yeast extract in a medium with 0.6 g of CTLS on the activity of proteases of Y. lipolytica IPS21 yeast. Values for single elements are not significantly different (P < 0.05) according to Tukey’s Kramer test for multiple comparisons
Table 4.
Metal concentrations in selected samples of biomass with Y. lipolytica IPS21 yeast or a supernatant after the process of protease production in a medium with 0.6 g of CTLS and different amounts of yeast extract. Values for single elements are not significantly different (P<0.05) according to Tukey’s Kramer test for multiple comparisons of the biomass or supernatant marked with the same letter
| Metal Variant | Ca | Cr | Fe | K | Mg | Na | P | S |
|---|---|---|---|---|---|---|---|---|
| g kg-1 | ||||||||
| 0.2 g YE | 3.16 ± | 3.68 ± | 0.55 ± | 5.16 ± | 2.44 ± | 15.44 ± | 16.02 ± | 3.36 ± |
| biomass | 0.21a | 0.30a | 0.02a | 0.55a | 0.13a | 1.22a | 1.45a | 1.24a |
| 0.4 g YE | 1.92 ± | 3.33 ± | 0.51 ± | 4.06 ± | 2.12 ± | 9.81 ± | 19.89 ± | 5.15 ± |
| biomass | 0.11b | 0.22a | 0.02a | 0.45b | 0.18b | 1.18b | 2.66b | 0.12b |
| 0.2 g YE | 0.10 ± | 0.54 ± | 0.09 ± | 0.25 ± | 0.05 ± | 3.0 ± | 0.09 ± | 0.52 ± |
| supernatant | 0.01a | 0.01a | 0.01a | 0.08a | 0.32a | 0.54a | 0.02a | 0.13a |
| 0.4 YE | 0.10 ± | 0.53 ± | 0.10 ± | 0.26 ± | 0.06 ± | 3.3 ± | 0.08 ± | 0.57 ± |
| supernatant | 0.01a | 0.02a | 0.04a | 0.02a | 0.01a | 0.03a | 0.01a | 0.03a |