
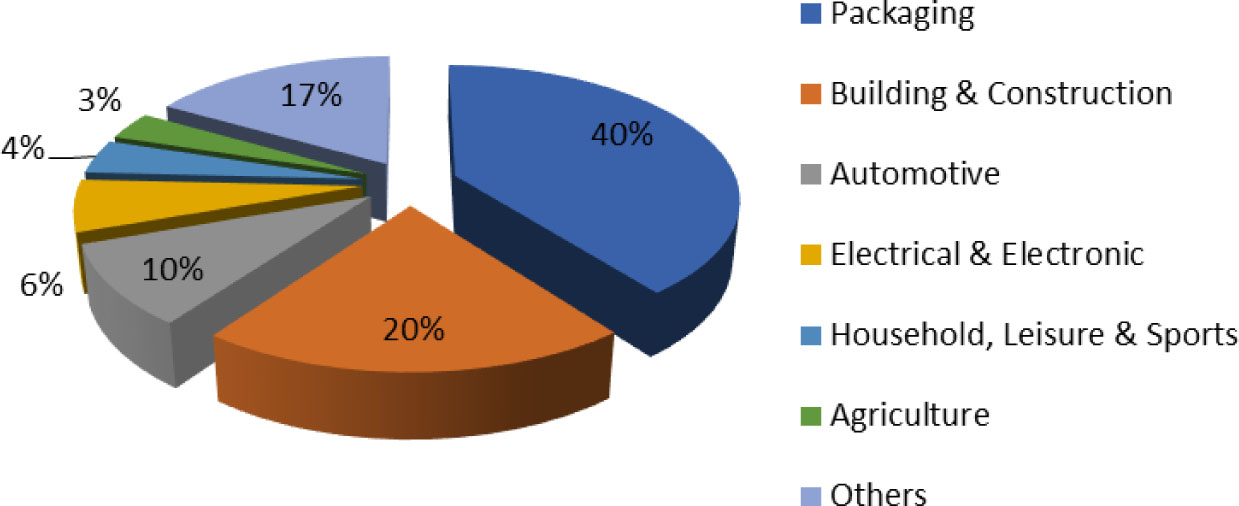
Fig. 1
Plastic demand by sector in 20192
Table 1
Most popular eco-labels12
| Symbol | Application |
|---|---|
| Packaging | |

| Green product according to European Directive 94/62 |

| Suitable for recycling |

| Keep clean |

| Suitable for re-use |

| Biodegradable packaging |
| Cosmetics and cleaning products | |

| Cosmetics, food, wool and cotton products from biological and dynamic crops |

| Laundry detergents, cleaning agents and cosmetics produced in a safe and ecological manner |

| Not tested on animals |

| Safe for ozone |
Table 2
Characteristics of tested products
| product | packaging material | marking |
|---|---|---|
| face cream | monomaterial: plastic | Loop leaf pictogram |
| body lotion | tube: monomaterial; plastic cork: monomaterial; plastic | Loop leaf pictogram |
| lip balm | momomaterial: paper | “Zero Waste”; “Cardboard Recycling”; Eco Friendly”; “Plastic Free” |
| shampoo bar | monomaterial: coated paper | “Handmade”; “Vegan lovers”; Save the Planet”; “Palm Oil Free”; “100% Biodegradable”; “Plastic free”; “100% Essential Oils”; “Certificated Oils” |
| cotton buds | multi-component: paper and plastic | “100% Biodegradable” |
Table 3
Correlation matrix for results obtained
| gender | age | city/country | tracking trends | „zero waste” policy | pay attention to labels | appearance of product | composition | pay more for ecological/natural product | biodegradability/compostability of product | reuseability | |
|---|---|---|---|---|---|---|---|---|---|---|---|
| gender | 0.18 | 0.11 | −0.46 | −0.34 | −0.26 | 0 | −0.40 | −0.43 | −0.37 | −0.30 | |
| age | 0.18 | 0.52 | 0.18 | 0.38 | 0.03 | 0.29 | 0.26 | 0.16 | 0.16 | −0.08 | |
| city/country | 0.11 | 0.05 | −0.28 | −0.13 | −0.21 | 0.17 | 0.12 | −0.11 | 0.18 | −0.18 | |
| tracking trends | −0.45 | 0.18 | 0.28 | 0.53 | 0.36 | 0.06 | 0.52 | 0.59 | 0.52 | 0.27 | |
| „zero waste” policy | −0.33 | 0.38 | −0.13 | 0.53 | 0.22 | 0.34 | 0.59 | 0.34 | 0.43 | 0.02 | |
| pay attention to labels | −0.26 | 0.03 | −021 | 0.36 | 0.22 | −0.30 | 0.22 | 0.40 | 0.44 | 0.42 | |
| appearance of product | 0.00 | 0.29 | 0.17 | 0.06 | 0.34 | −0.28 | 0.03 | −0.15 | 0.09 | −0.18 | |
| composition | −0.37 | 0.26 | 0.12 | 0.52 | 0.59 | 0.22 | 0.03 | 0.71 | 0.50 | −0.05 | |
| pay more for ecological/natural product | −0.43 | 0.16 | −0.11 | 0.59 | 0.34 | 0.40 | −0.10 | 0.71 | 0.37 | 0.14 | |
| biodegradability/compostability of product | −0.37 | 0.16 | 0.18 | 0.52 | 0.43 | 0.41 | 0.09 | 0.50 | 0.37 | 0.26 | |
| reuseability | −0.30 | −0.10 | −0.18 | 0.27 | 0.02 | 0.42 | −0.20 | −0.10 | 0.14 | 0.26 |

Fig. 2
Cluster analysis (the Ward's method)
Table 4
| variable | p-value |
|---|---|
| following eco-trends | 0.009 |
| composition of product | 0.035 |
| willingness to pay more for ecological/natural product | 0.016 |
| pay attention to biodegradability/compostability of product | 0.035 |
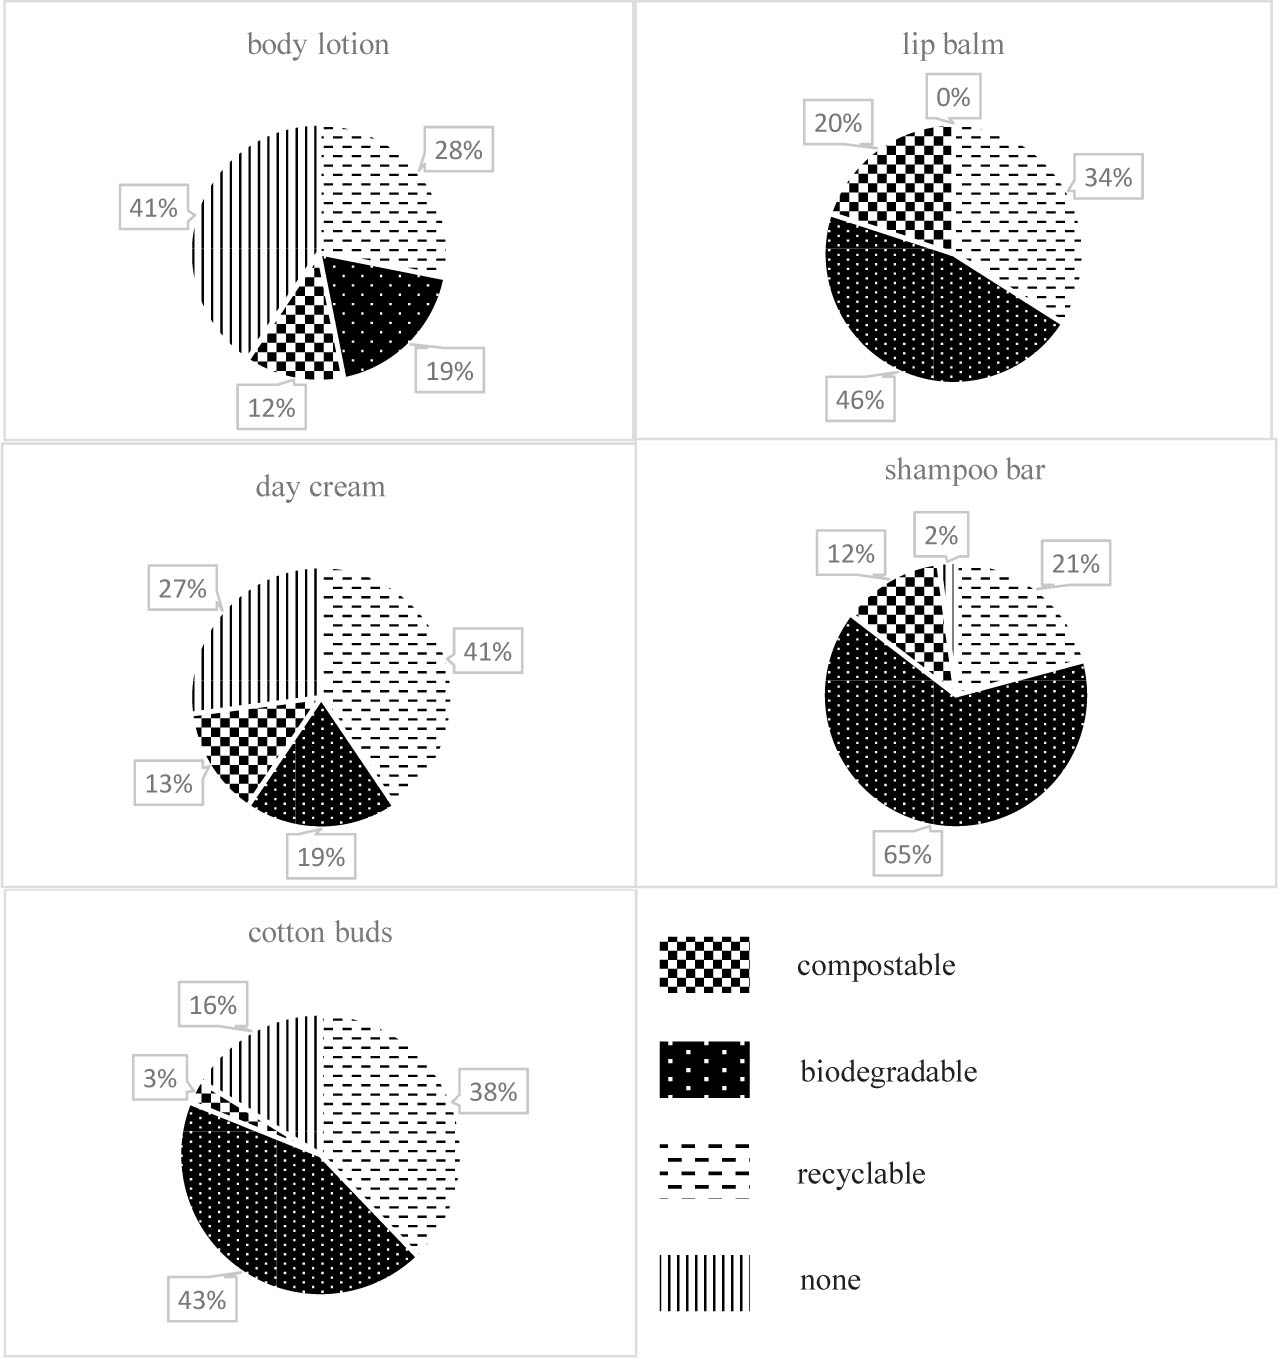
Fig. 3
Results of the consumer survey obtained in terms of the evaluation of the packaging products presented for A) body lotion, B) day cream, C) lip balm, D) shampoo bar, and D) cotton buds