
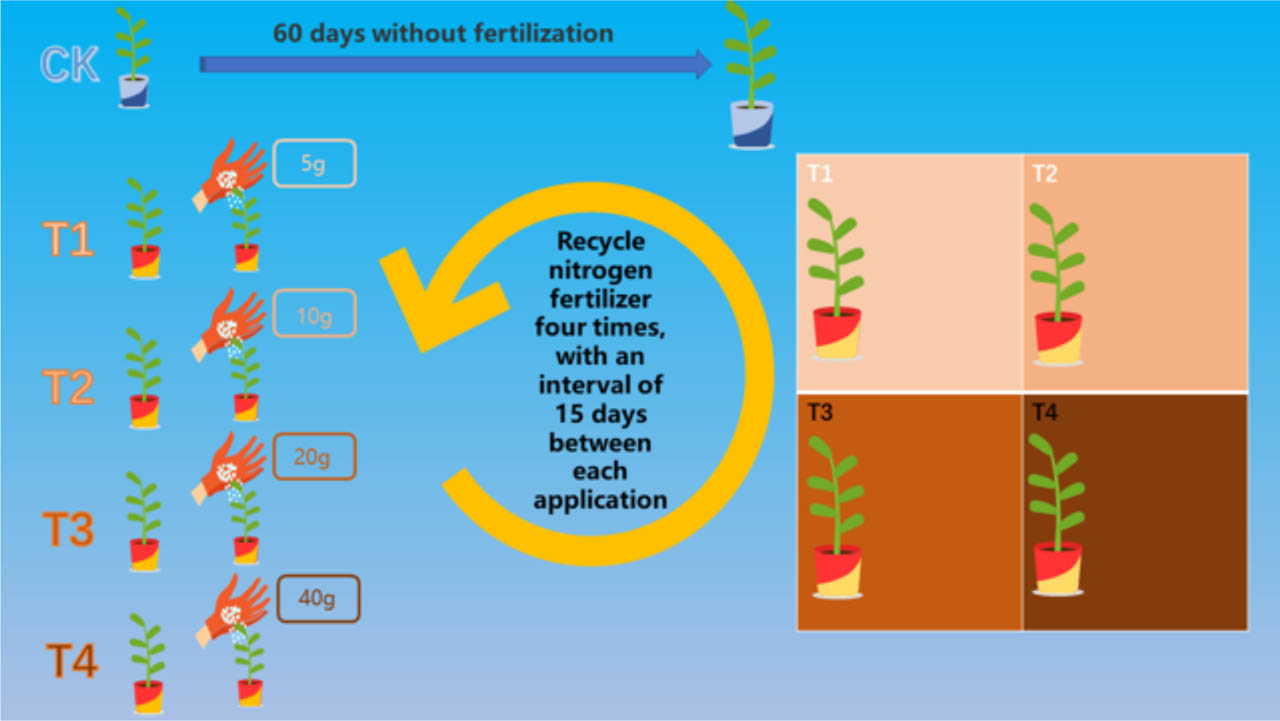
Figure 1.
Nitrogen application schedule during seedling cultivation. Four N levels were applied once every 15 days for a total of four applications.
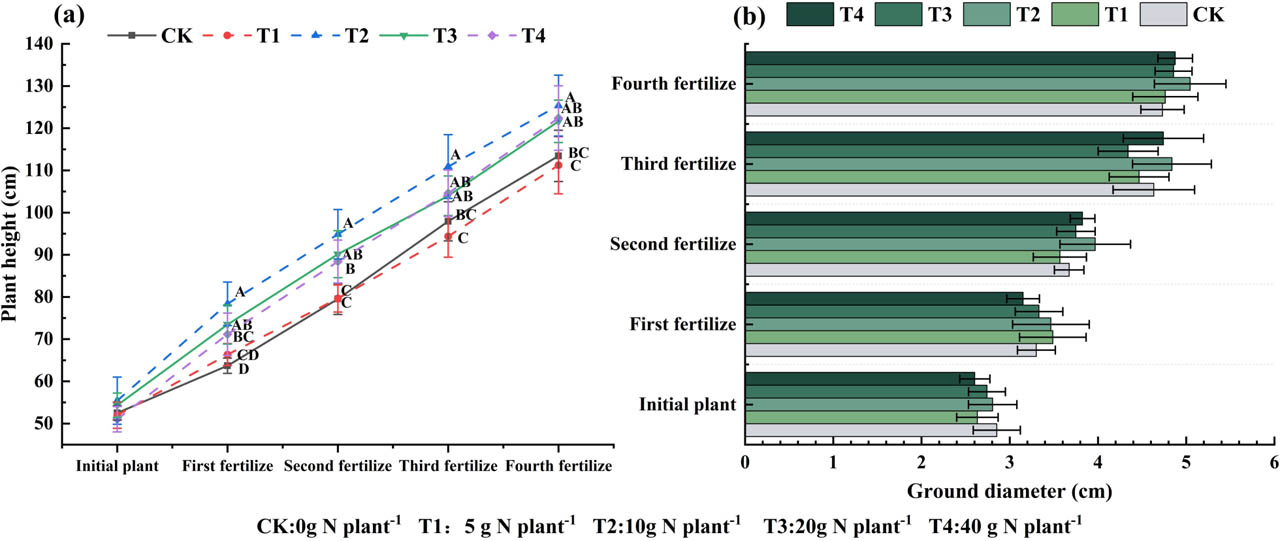
Figure 2.
Effects of N addition on seedling height (a) and ground diameter (b) of P. mume seedlings. Data represent mean ± SD, n = 10 per treatment. N addition levels: CK (0), T1 (5), T2 (10), T3 (20), and T4 (40 g N plant−1).
Table 1.
Effects of N addition on biomass allocation in roots, stems, and leaves of P. mume seedlings.
| Group | Root biomass (g) | Stem biomass (g) | Leaf biomass (g) | Above-ground biomass (g) | Total biomass (g) | Root-shoot ratio |
|---|---|---|---|---|---|---|
| CK | 2.207 ± 0.166 B | 6.982 ± 0.195 B | 6.491 ± 0.345 B | 13.467 ± 0.383 B | 15.908 ± 0.398 B | 0.161 ± 0.013 B |
| T1 | 3.368 ± 0.489 A | 7.637 ± 0.956 AB | 6.44 ± 0.599 B | 14.078 ± 1.529 B | 17.446 ± 1.054 AB | 0.245 ± 0.06 A |
| T2 | 2.933 ± 0.429 A | 8.348 ± 0.81 AB | 6.965 ± 0.549 AB | 15.313 ± 1.303 AB | 18.246 ± 1.206 AB | 0.193 ± 0.039 AB |
| T3 | 2.737 ± 0.079 AB | 8.821 ± 0.166 A | 8.041 ± 0.378 A | 16.862 ± 0.395 A | 19.599 ± 0.349 A | 0.162 ± 0.007 B |
| T4 | 2.708 ± 0.059 AB | 6.976 ± 1.076 C | 6.401 ± 0.553 B | 13.383 ± 1.624 B | 16.092 ± 1.681 B | 0.204 ± 0.021 AB |
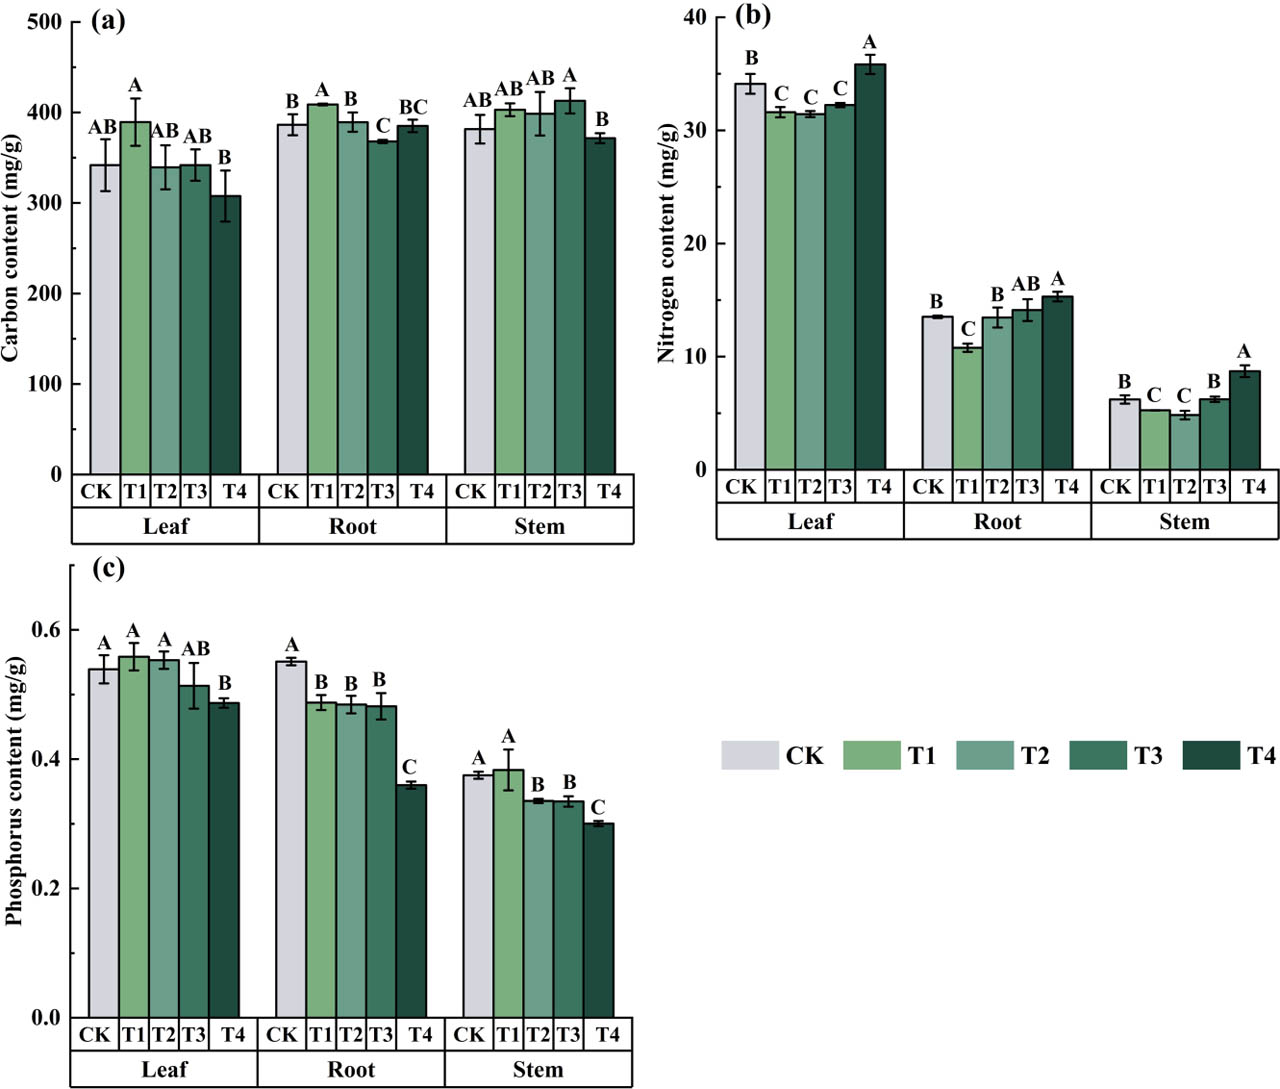
Figure 3.
Effects of N addition on carbon (a), nitrogen (b), and phosphorus (c) contents in the leaves, stems, and roots of P. mume seedlings. Data represent mean ± SD, n = 3 biological replicates per treatment. DW, dry weight. Different uppercase letters above bars denote significant differences among treatments within the same organ at p ≤ 0.05 (Fisher's LSD test).
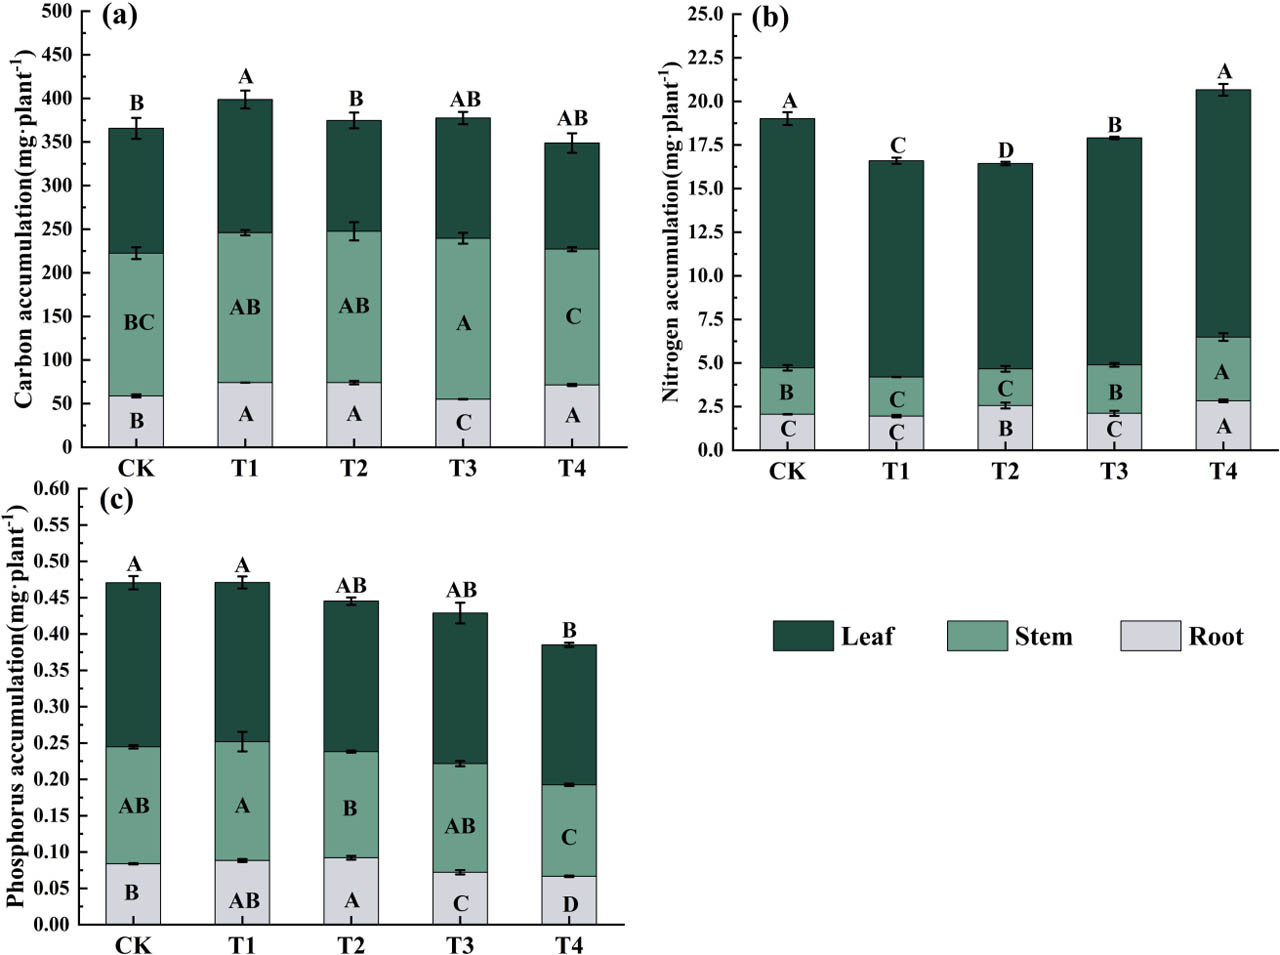
Figure 4.
Effects of N addition on carbon (a), nitrogen (b), and phosphorus (c) accumulation in the leaves, stems, and roots of P. mume seedlings. Accumulation was calculated as organ element content × organ biomass. Data represent mean ± SD, n = 3 biological replicates per treatment. Different uppercase letters denote significant differences among treatments within the same organ at p ≤ 0.05 (Fisher's LSD test).
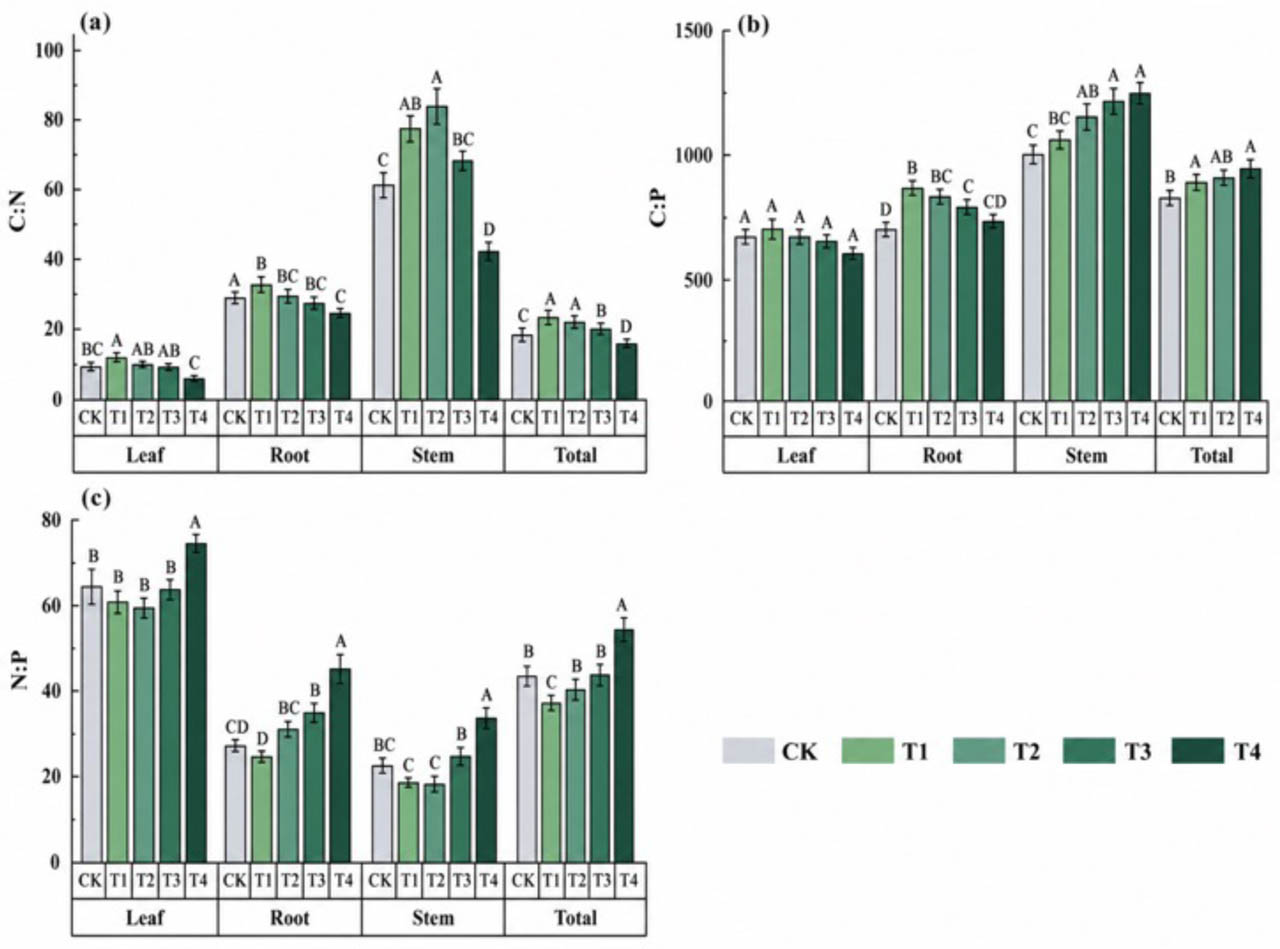
Figure 5.
Effects of N addition on C:N (a), C:P (b), and N:P (c) stoichiometric ratios in the leaves, stems, and roots of P. mume seedlings. Data represent mean ± SD, n = 3 biological replicates per treatment. Different uppercase letters denote significant differences among treatments within the same organ at p ≤ 0.05 (Fisher's LSD test).
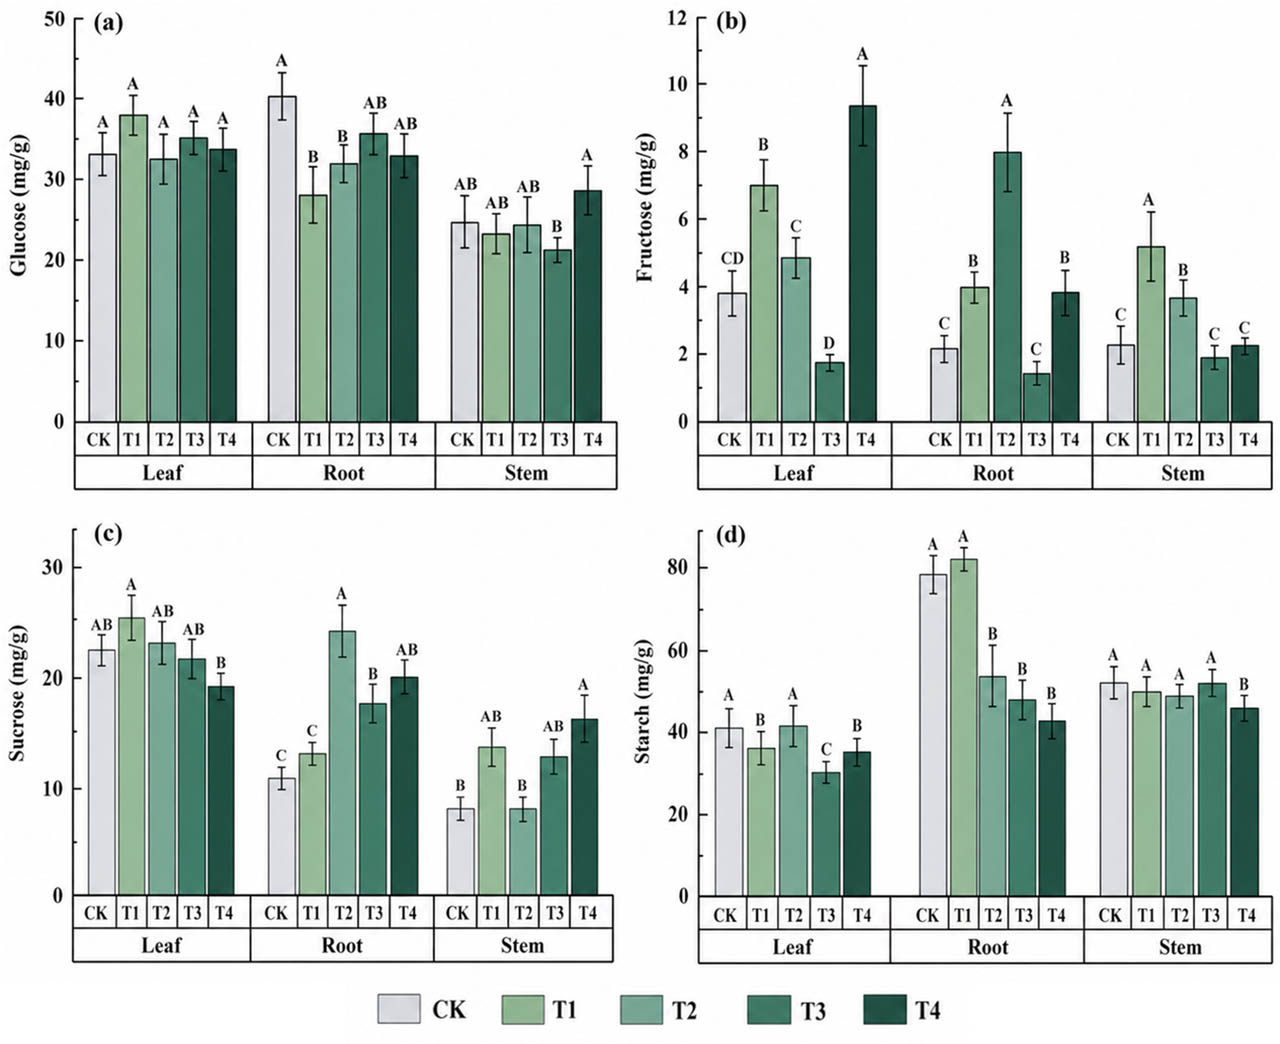
Figure 6.
Effects of N addition on glucose (a), fructose (b), sucrose (c), and starch (d) contents in the leaves, stems, and roots of P. mume seedlings. Data represent mean ± SD, n = 3 biological replicates per treatment. Different uppercase letters denote significant differences among treatments within the same organ at p ≤ 0.05 (Fisher's LSD test).
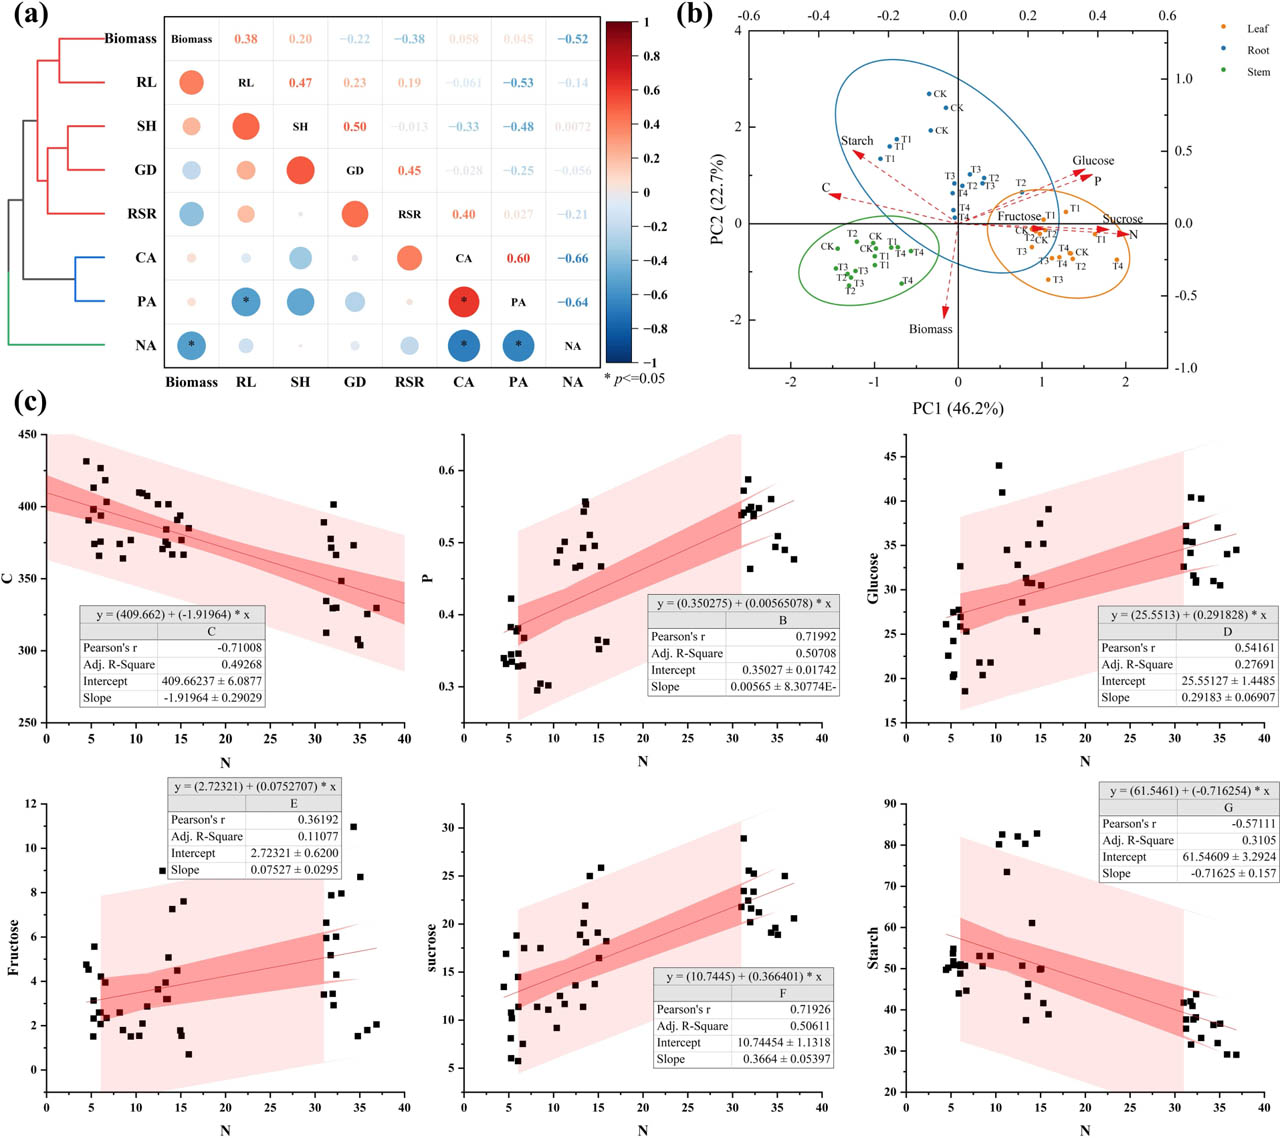
Figure 7.
Multivariate analyses of growth, stoichiometric, and NSC variables. (a) Pearson correlation matrix among morphological indicators and element accumulation. Blue indicates negative correlation (r = −1.0), red indicates positive correlation (r = 1.0); *p < 0.05, **p < 0.01. (b) Principal component analysis (PCA) biplot of C, N, P, soluble sugars (glucose, fructose, sucrose), starch, and biomass across organs and treatments. Variables were standardized (z-score); PC1 and PC2 explain 46.2% and 22.7% of variance, respectively. Points represent individual biological replicates (n = 3 per treatment), with organs color-coded and treatments shape-coded. (c) Linear regression between N content and C content, P content, and NSC components; regression coefficients (K) and significance levels are shown.