
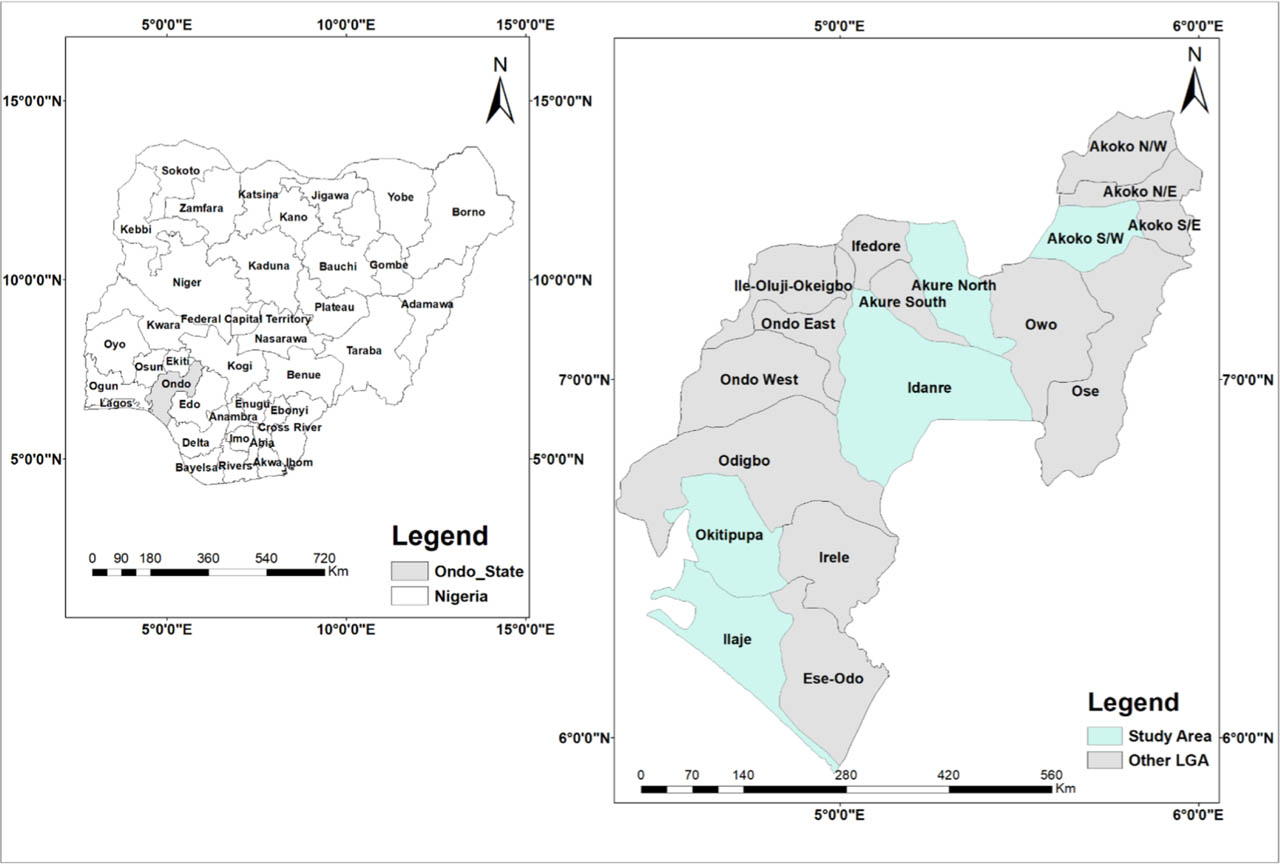
Figure 1.
Location of the study areas: Akure North, Akoko South-West (S-W), Idanre, Okitipupa and Ilaje in Ondo State, Nigeria.
Table 1.
Felled stems across the 18 Local Government Areas of Ondo State (2019–2023): annual counts, five-year totals, percentage share of the state total, and each LGA's peak year and corresponding value (ranked by the five-year total).
| LGAs/Year | 2019 | 2020 | 2021 | 2022 | 2023 | Total (5Y) | Share (%) | Peak Year |
|---|---|---|---|---|---|---|---|---|
| Akure North | 6680 | 6588 | 5837 | 8327 | 5886 | 33318 | 29.065 | 2022 |
| Owo | 3111 | 1792 | 3528 | 4336 | 1549 | 14316 | 12.488 | 2022 |
| Akure South | 3248 | 2228 | 1682 | 2199 | 2037 | 11394 | 9.939 | 2019 |
| Odigbo | 3848 | 1871 | 1825 | 1795 | 1092 | 10431 | 9.099 | 2019 |
| Ifedore | 2636 | 1948 | 1737 | 2137 | 1752 | 10210 | 8.906 | 2019 |
| Akoko South-West | 1627 | 909 | 1199 | 1605 | 1030 | 6370 | 5.557 | 2019 |
| Ondo East | 1821 | 1181 | 737 | 891 | 733 | 5363 | 4.678 | 2019 |
| Idanre | 1667 | 800 | 741 | 1082 | 446 | 4736 | 4.131 | 2019 |
| Okitipupa | 1207 | 644 | 607 | 903 | 445 | 3806 | 3.320 | 2019 |
| Akoko North-West | 906 | 461 | 851 | 1912 | 495 | 3725 | 3.249 | 2022 |
| Ose | 1076 | 500 | 542 | 938 | 92 | 3148 | 2.746 | 2019 |
| Akoko North-East | 586 | 315 | 625 | 883 | 477 | 2886 | 2.517 | 2022 |
| Irele | 440 | 409 | 412 | 377 | 288 | 1926 | 1.680 | 2019 |
| Ondo West | 545 | 280 | 385 | 348 | 133 | 1691 | 1.475 | 2019 |
| Akoko South-East | 150 | 120 | 222 | 385 | 234 | 1111 | 0.969 | 2022 |
| Ile Oluji/Okeigbo | 3 | 7 | 45 | 52 | 62 | 169 | 0.147 | 2023 |
| Ese Odo | 5 | 0 | 20 | 0 | 0 | 25 | 0.021 | 2021 |
| Ilaje | 0 | 0 | 4 | 0 | 0 | 4 | 0.003 | 2021 |
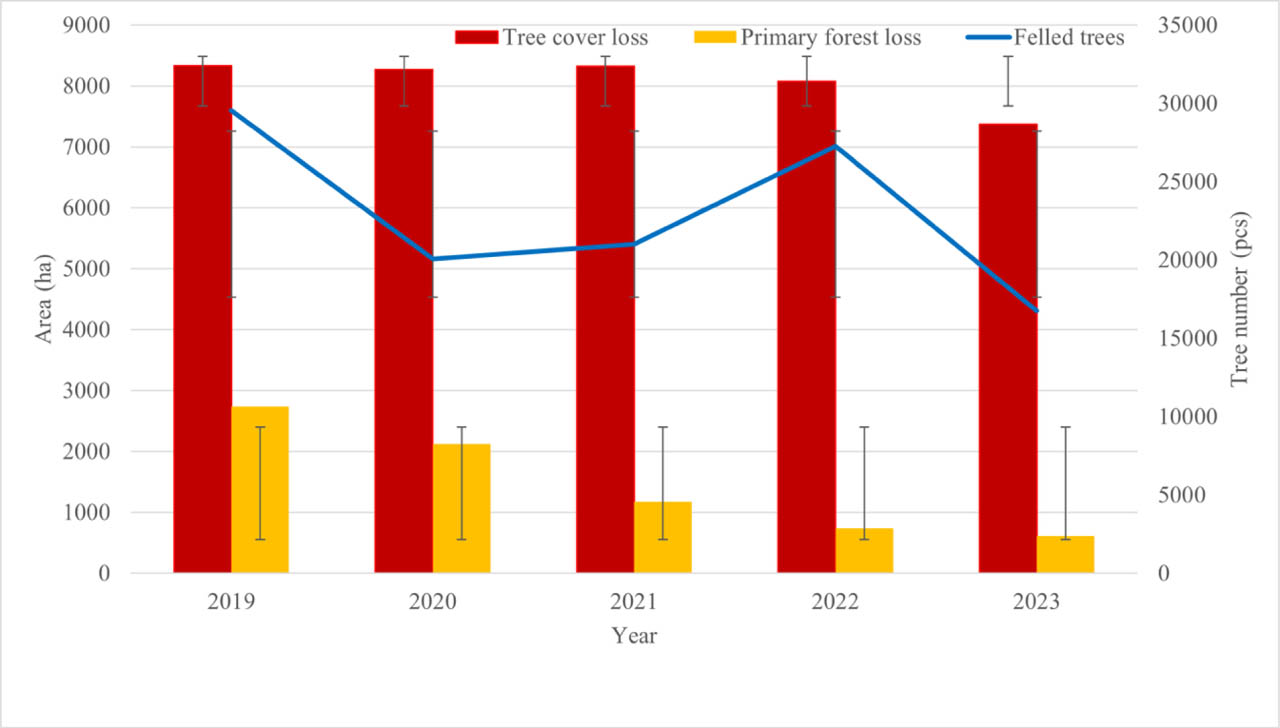
Figure 2.
Primary forest (pcs) and tree cover loss (ha) in Ondo State (2019–2023, hectares, bars) with felled trees (count, line, right-hand axis).
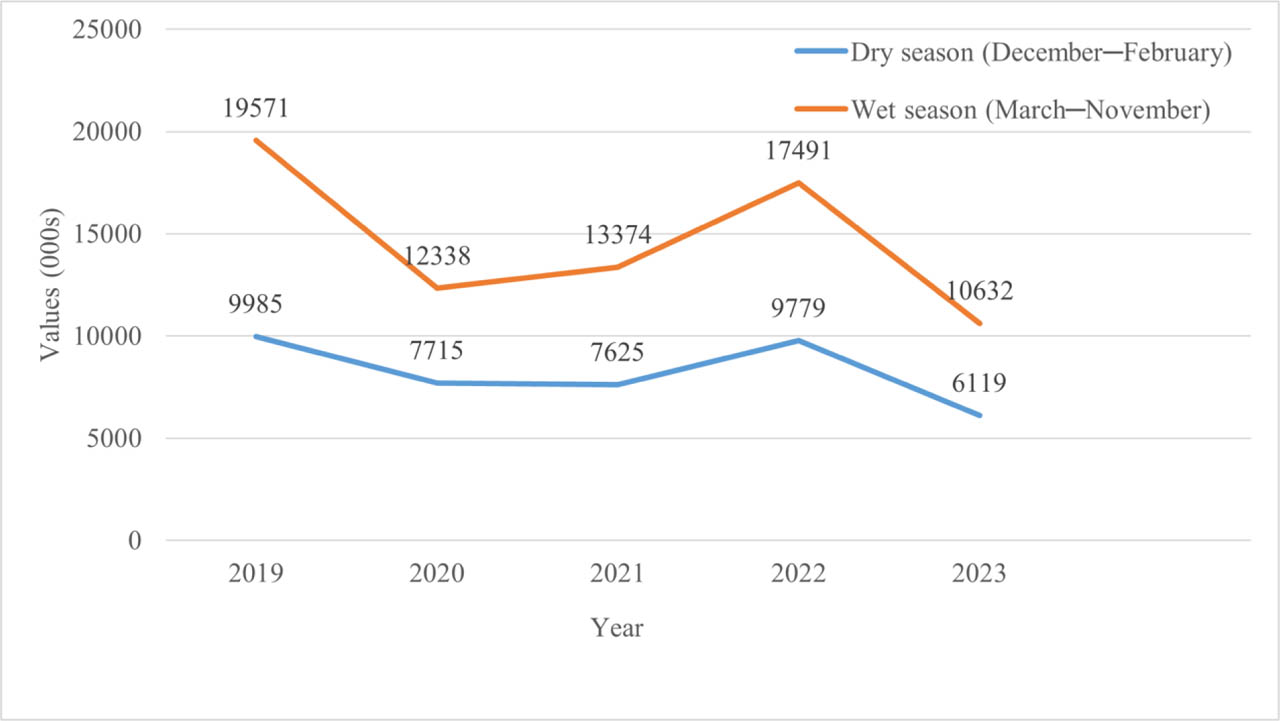
Figure 3.
Seasonal felling of trees in Ondo State (2019–2023), showing higher counts in the wet season (March–November) than in the dry season (December–February).
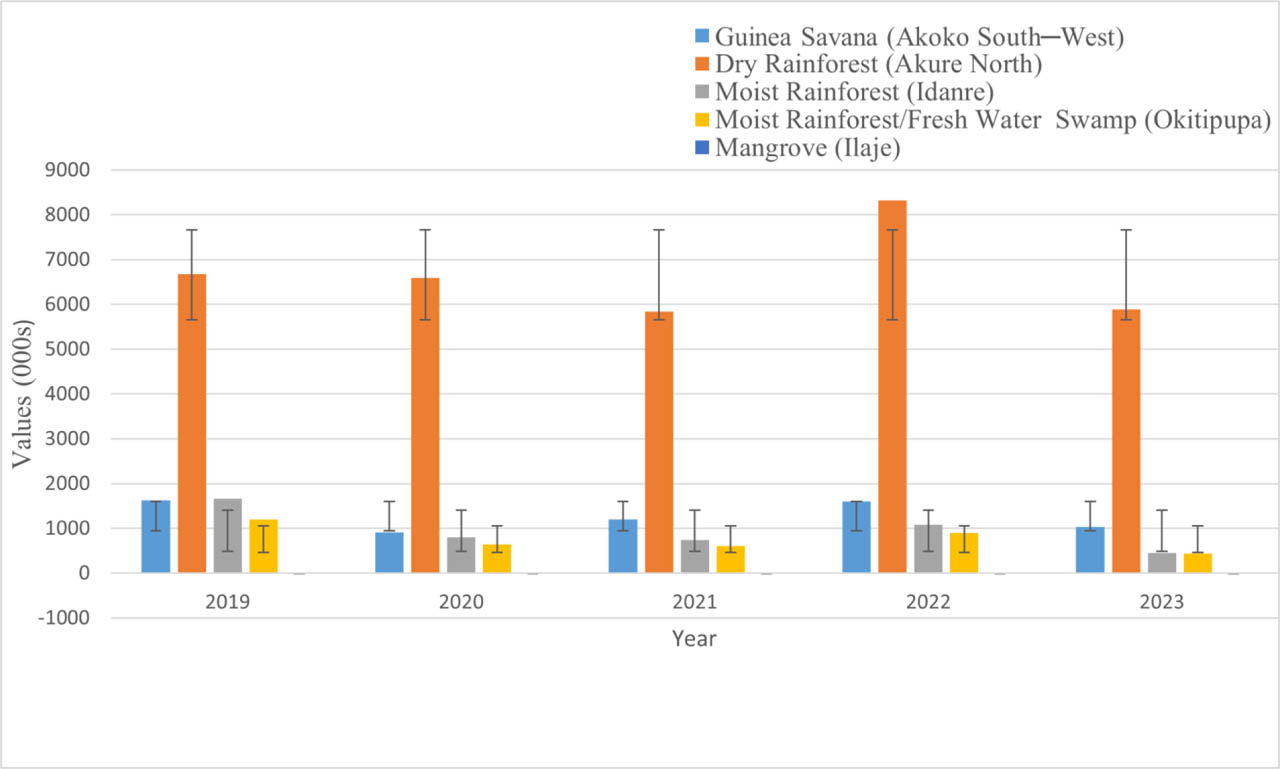
Figure 4.
Annual counts of felled trees in Ondo State by vegetation zone (2019–2023), with representative LGAs: Guinea Savanna (Akoko South-West), Dry Rainforest (Akure North), Moist Rainforest (Idanre), Freshwater Swamp (Okitipupa), and Mangrove (Ilaje).
Table 2.
Pearson correlation matrix (2019–2023) for felled trees, tree cover loss (ha), primary forest loss (ha), and estimated felled area (ha, assuming 103 trees ha−1).
| Variable Pair | r | p | Significance | Interpretation |
|---|---|---|---|---|
| Felled trees – Tree cover loss | 0.576 | 0.310 | ns | Moderate positive |
| Felled trees – Primary forest loss | 0.471 | 0.423 | ns | Weak-moderate positive |
| Tree cover loss – Primary forest loss | 0.653 | 0.232 | ns | Moderate positive |
| Felled trees – Felled trees | 1.000 | <.001 | *** | Near-perfect positive* |
| Tree cover loss – Felled trees | 0.0575 | 0.310 | ns | Moderate positive |
| Primary forest loss – Felled trees | 0.471 | 0.424 | ns | Weak-moderate positive |