
Table 1.
The same drying schedule for drying all hardwoods.
| Time (h) | Surrounding air temp. (°C) | Wet bulb temp. (°C) | Surrounding air RH (%) |
|---|---|---|---|
| 0 | 20 | 19.44 | 60 |
| 1 | 47 | 46.11 | 95 |
| 12 | 48 | 47.10 | 95 |
| 36 | 50 | 48.13 | 90 |
| 60 | 52 | 48.02 | 80 |
| 84 | 52 | 45.54 | 69 |
| 108 | 52 | 43.05 | 59 |
| 132 | 52 | 40.27 | 49 |
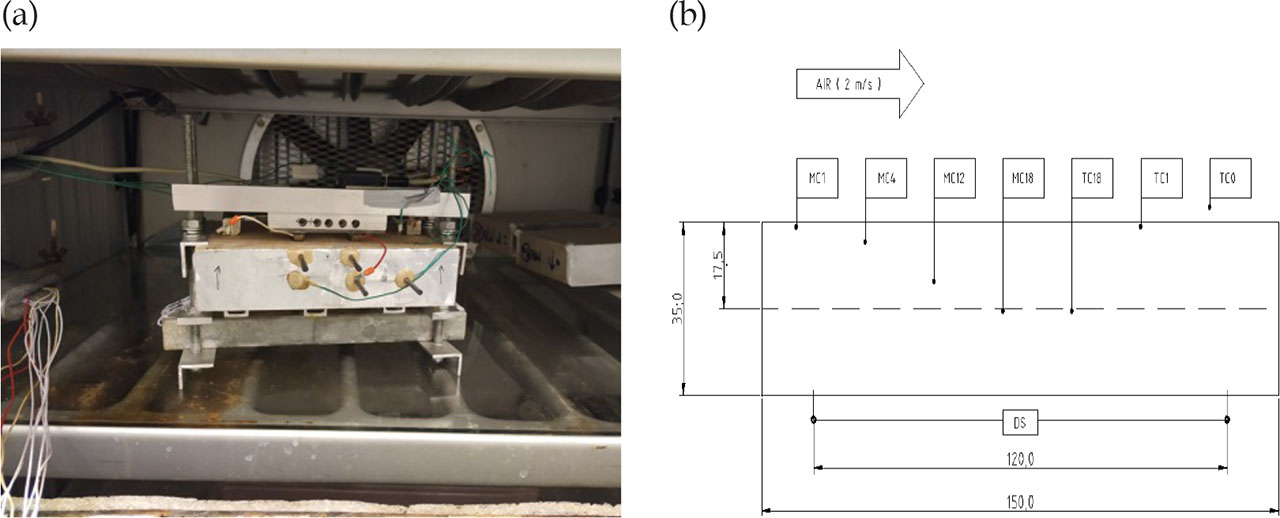
Figure 1.
(a) interior view of the climate chamber, and (b) sensor placement schematic.
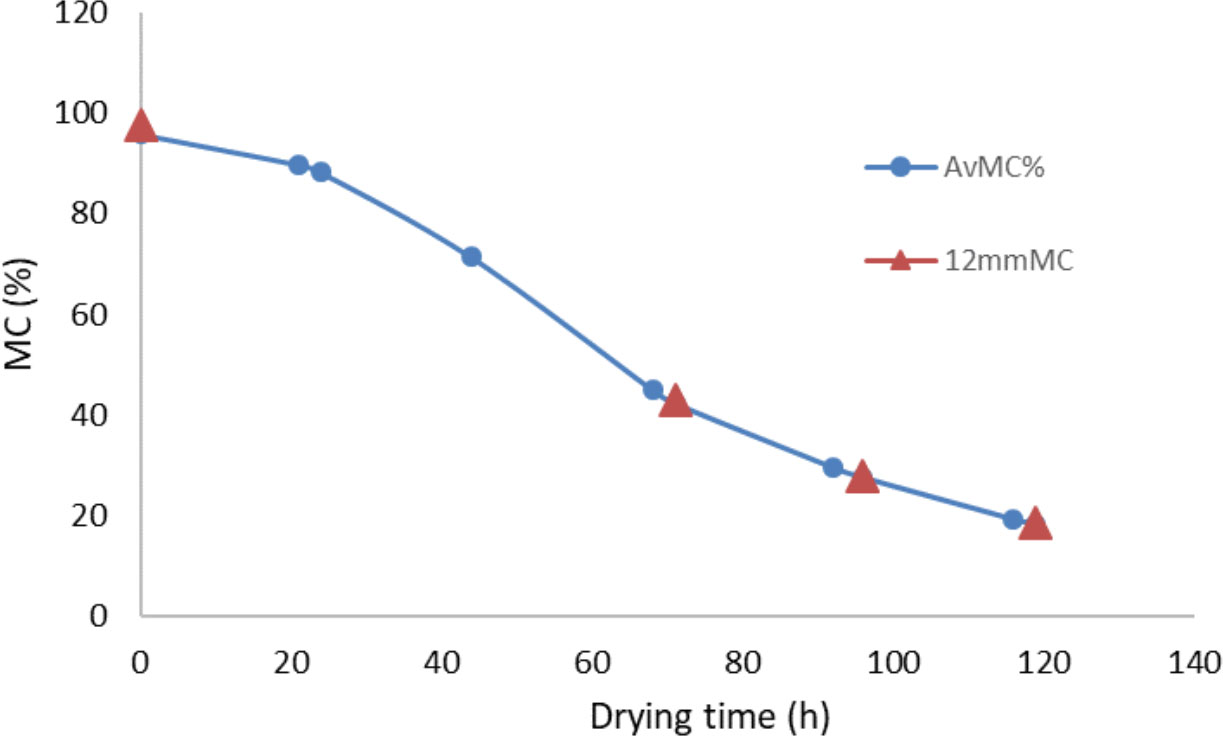
Figure 2.
A comparison of the average moisture content levels, and the moisture content levels which were obtained using the slicing method at a depth of 12 mm on the example of alder wood.
Table 2.
Section-linear calibration functions determined on the basis of Formula (7) at depths of 1 mm and 4 mm from the surface, using the example of alder wood. Independent x-value is electrical resistance of wood (unit 10LogR). Dependent y-value is the moisture content (MC) of wood.
| Depth (mm) | AB | BC | CD |
|---|---|---|---|
| 1 mm | y = −8.0269x+475.3 | y = −0.676x+61.97 | y = −0.41x+43.335 |
| 4 mm | y = −12.813x+714.47 | y = −1.474x+119.696 | y = −0.721x+69.18 |
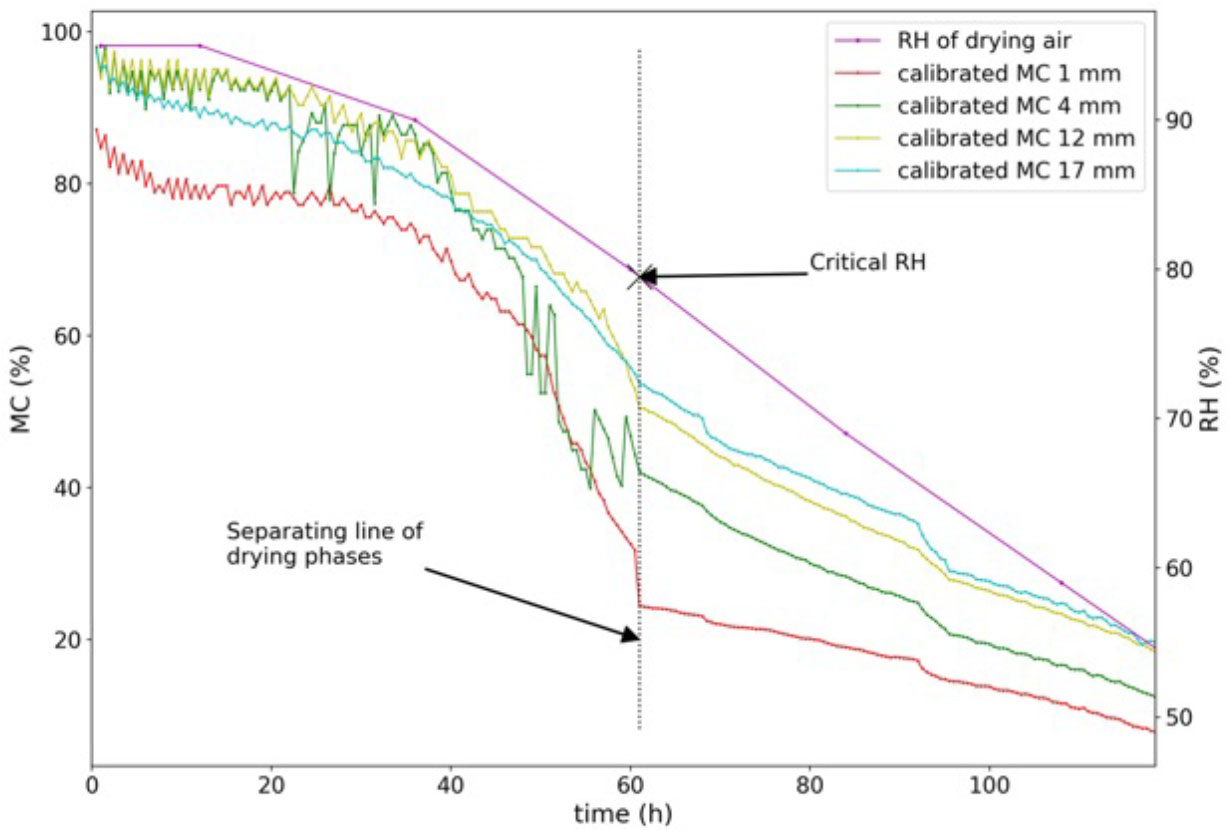
Figure 3.
Alder wood drying experiment. Identification of the critical RH of the drying air according to the separating line of the first and second drying phase (Tamme et al., 2021a). Drying curves for the layers of alder wood at different depths, and the RH graph for the drying air on an axis with a different scale, while the time axis is unchanged.
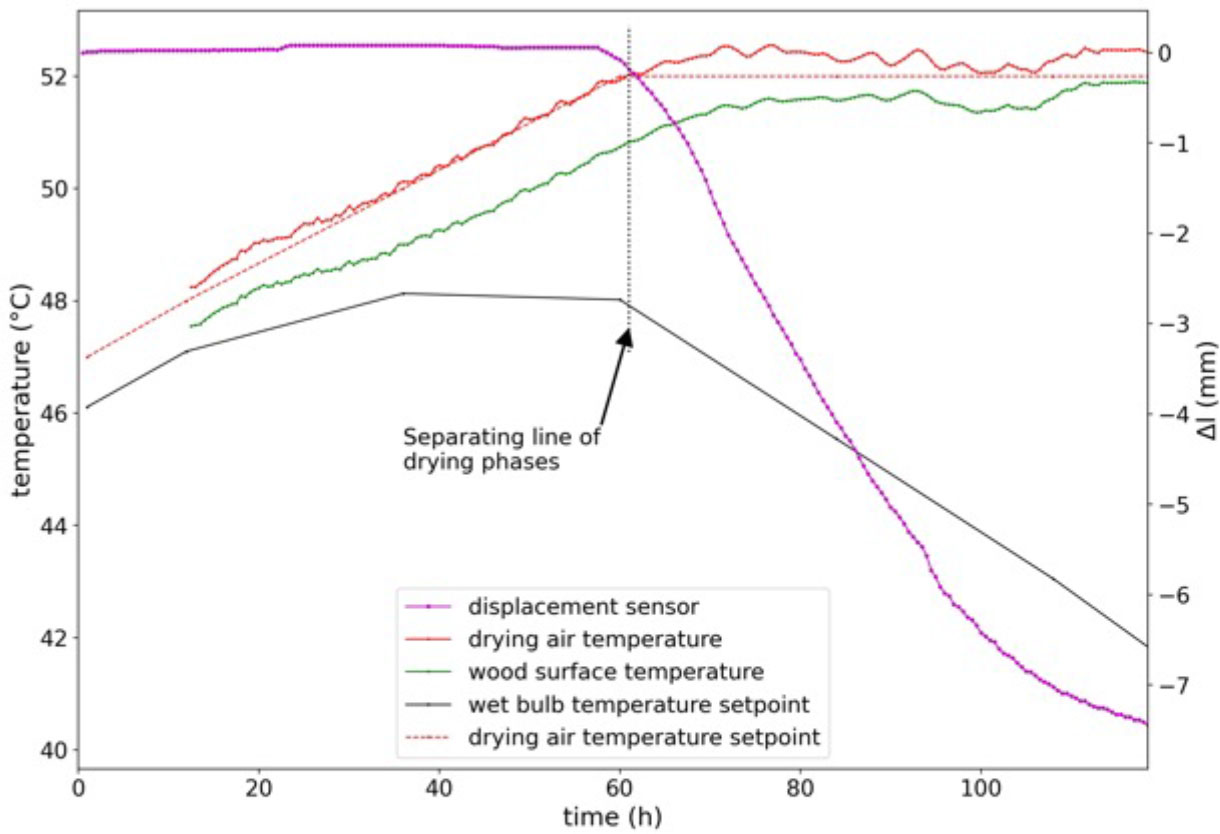
Figure 4.
Alder wood drying experiment. Thermocouple data, with the temperature input based on the drying plan (see Table 1), and displacement sensor data depending on the drying time.
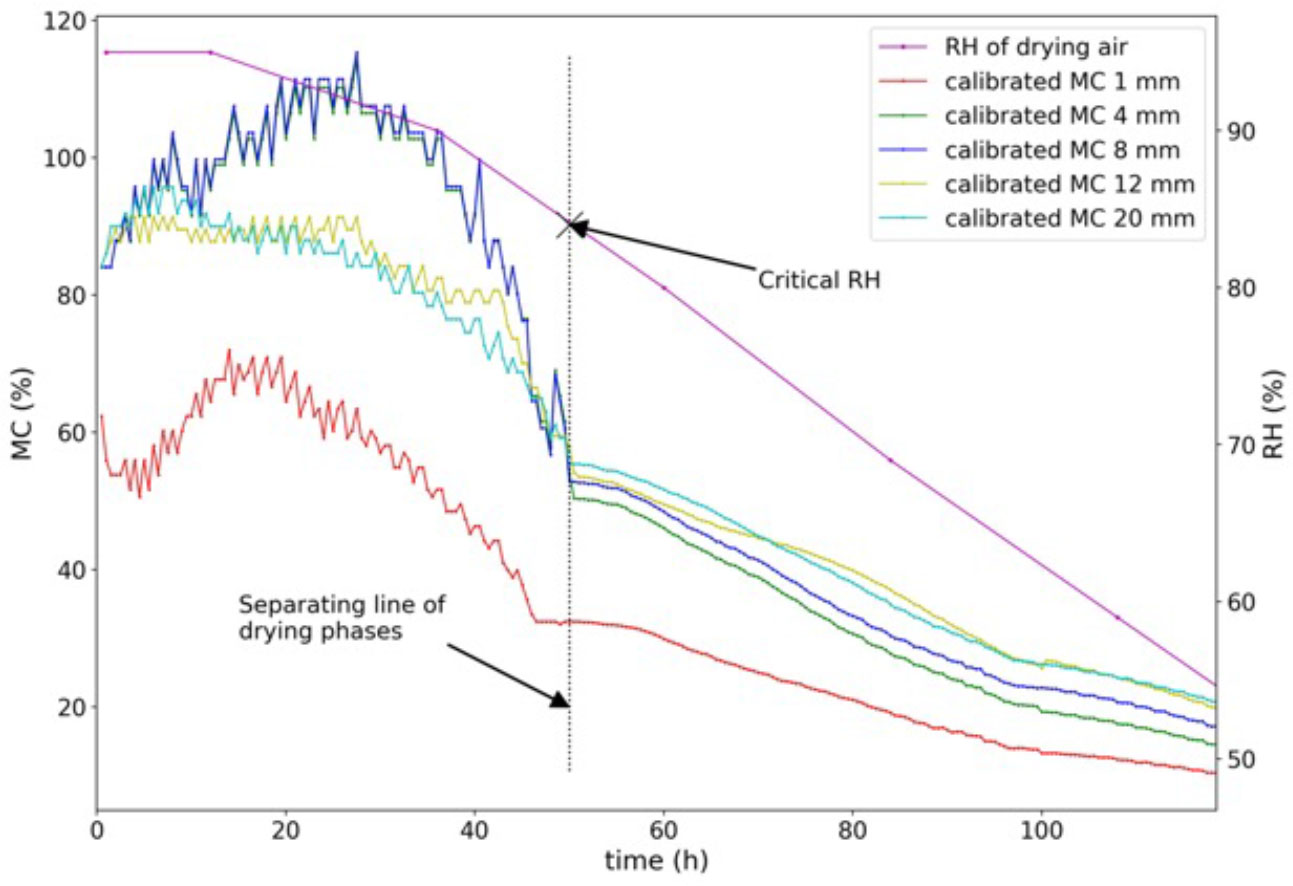
Figure 5.
Aspen wood drying experiment. Identification of the critical RH of the drying air according to the separating line of the first and second drying phase. Drying curves for layers of aspen wood at different depths, and the RH graph for the drying air on an axis with a different scale, while the time axis is unchanged.
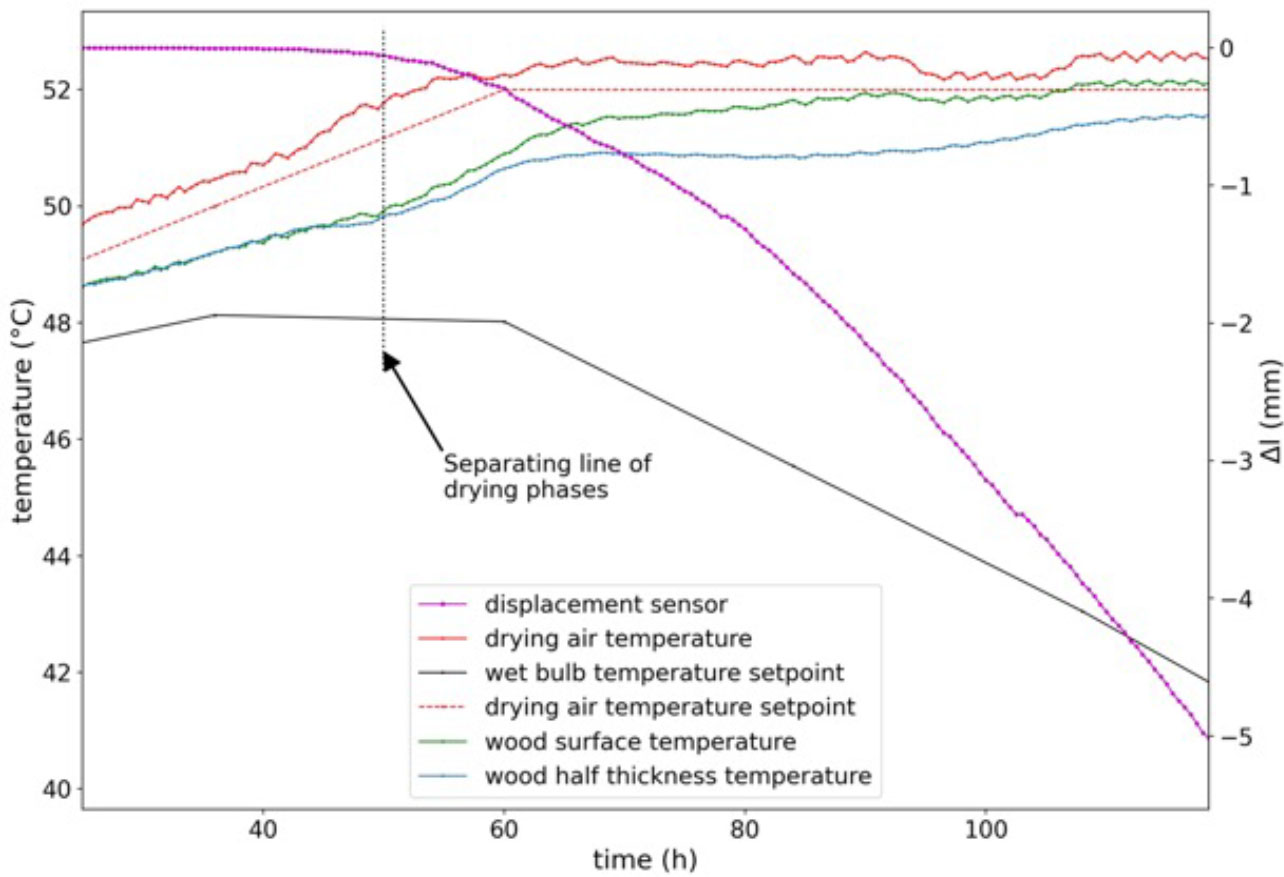
Figure 6.
Aspen wood drying experiment. Thermocouple data, with temperature input based on the drying plan (see Table 1), and displacement sensor data depending on the drying time.
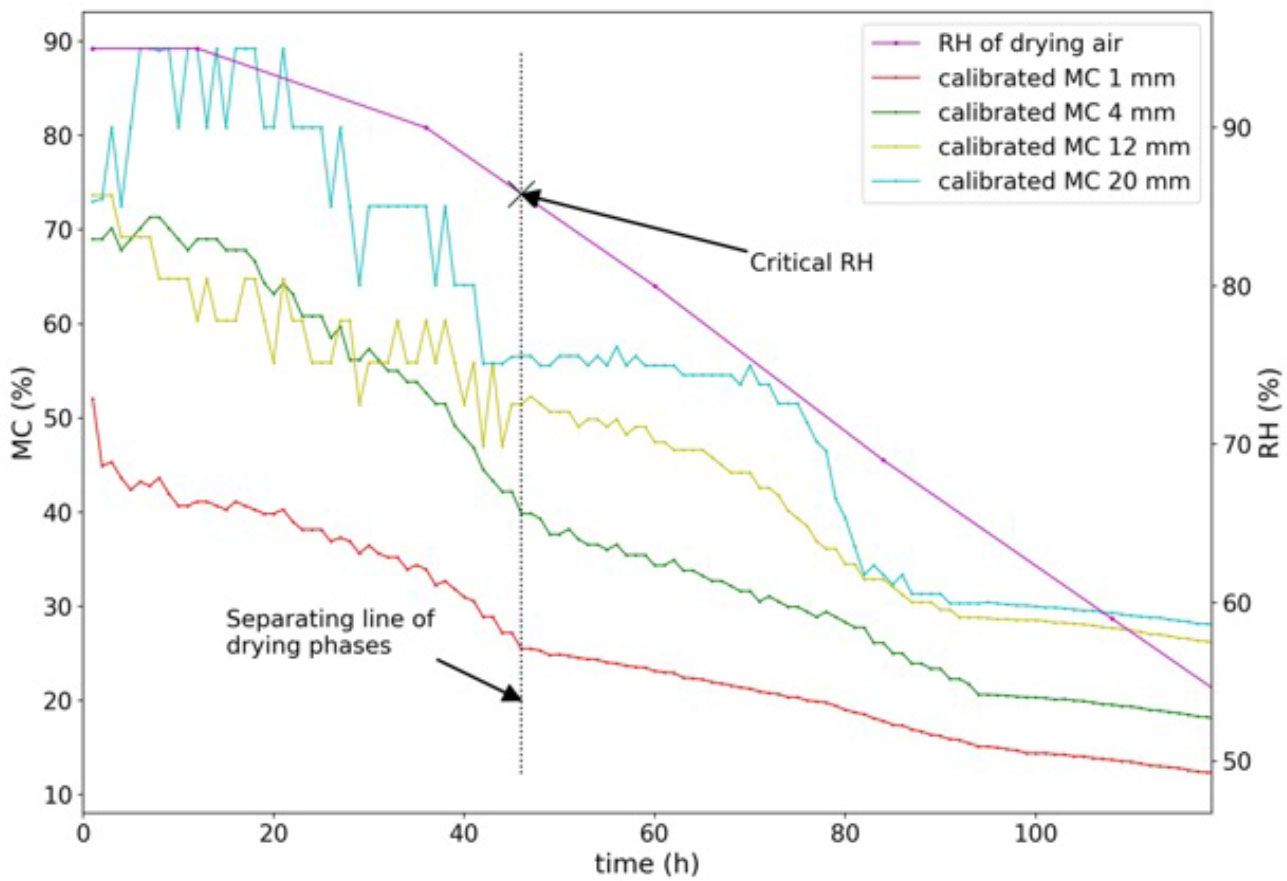
Figure 7.
Birch wood drying experiment. Identification of the critical RH of the drying air according to the separating line of the first and second drying phase. Drying curves for layers of birch wood at different depths, and the RH graph for the drying air on an axis with a different scale, while the time axis is unchanged.
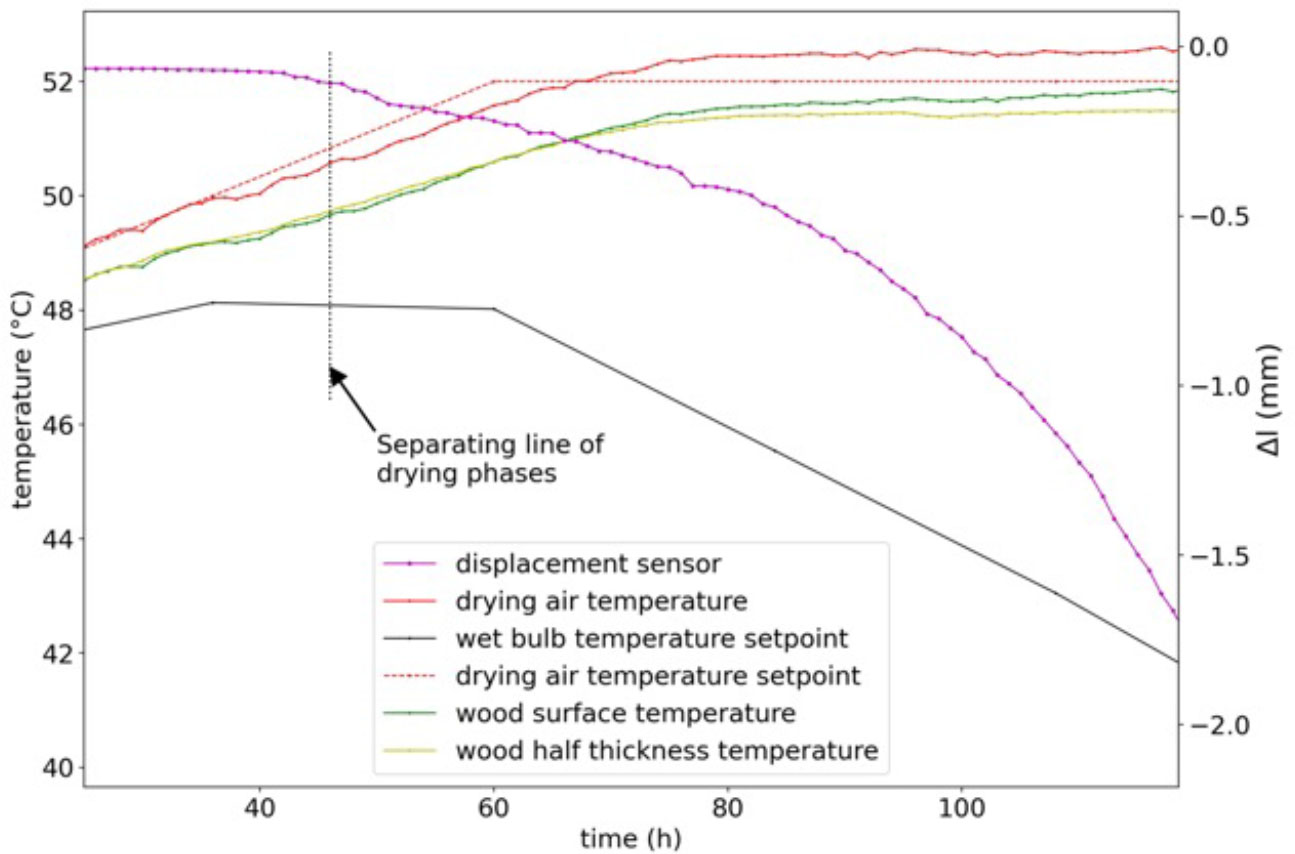
Figure 8.
Birch wood drying experiment. Thermocouple data, with temperature input based on the drying plan (see Table 1), and displacement sensor data depending on the drying time.
Table 3.
The critical diffusion coefficient (Dcr) for the surface layer of three hardwood species and pine sapwood, along with the corresponding critical air humidity (RHcr) and the ratio of the diffusion coefficients for the first drying phase and the second drying phase in the surface layer (Dcr/D2ph), for different tree species.
| Type of wood | Dcr (*10−4 mm2/s) | RHcr (%) | D2ph (*10−4 mm2/s | Dcr/D2ph |
|---|---|---|---|---|
| Black alder | 36.57 | 75.6 | 13.87 | 2.64 |
| Aspen | 30.71 | 85.4 | 11.72 | 2.62 |
| Birch | 16.35 | 85.4 | 6.92 | 2.36 |
| *Pine sapwood | 27 | 81 | 18 | 1.5 |
Table 4.
The experimentally determined moment of time, for the separating line (SL) and the corresponding average moisture content in the wood at the point at which the wood's surface layer transitions from the first drying phase into the second drying phase, and figures related to that transition.
| Type of wood | Separating line (SL) (h) of drying phases | Avg MC (%) | Related figures |
|---|---|---|---|
| Black alder | 61 | 55 | Figure. 9, line 1; Figure. 11a |
| Aspen | 50 | 62 | Figure. 9, line 2; Figure. 11b |
| Birch | 46 | 64 | Figure. 9, line 3; Figure. 11c |
| *Pine sapwood | 94 | 60 | Figure. 11d |
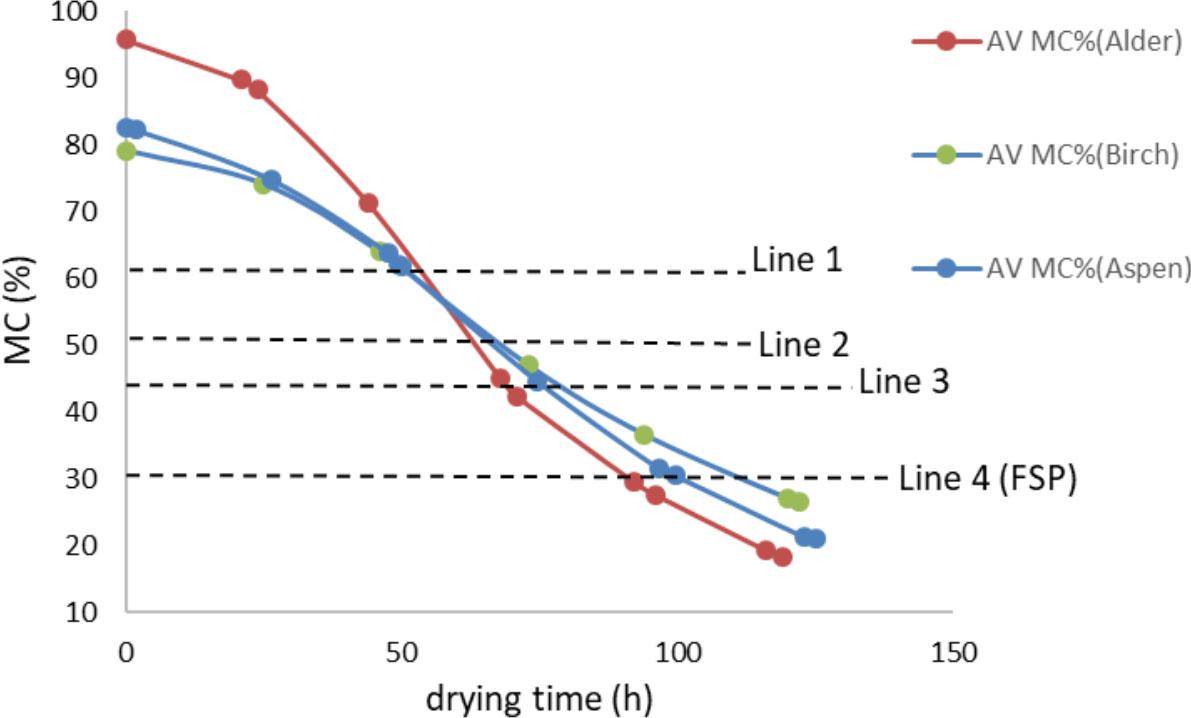
Figure 9.
A comparison of drying curves in different hardwood species under the same drying plan (see Table 1).
Table 5.
Hypothesis testing results for hardwood species. Independent x-value is moisture content (MC) in the depth level of 1 mm from the surface. Dependent y-value is the MC in the depth level of 12 mm from the surface.
| Type of wood | Equation: 12mmMC (y) ~ 1mmMC (x) | R | R2 | p-value |
|---|---|---|---|---|
| Black alder | y = 0.951x + 17.303 | 0.989 | 0.977 | < 0.001 |
| Aspen | y =1.275x + 11.8 | 0.979 | 0.958 | < 0.001 |
| Birch | y =1.302x + 12.028 | 0.965 | 0.931 | < 0.001 |
| *Pine sapwood | y =0.9377x + 57.898 | 0.992 | 0.984 | < 0.001 |
Table 6.
A comparison of the effective diffusion coefficient (EDC) (Deff) for different tree species under quasi-stationary drying conditions.
| Type of wood | Deff (*10−4 mm2/s) |
|---|---|
| Black alder | 11.92 |
| Aspen | 11.44 |
| Birch | 4.18 |
| *Pine sapwood | 9.58 |
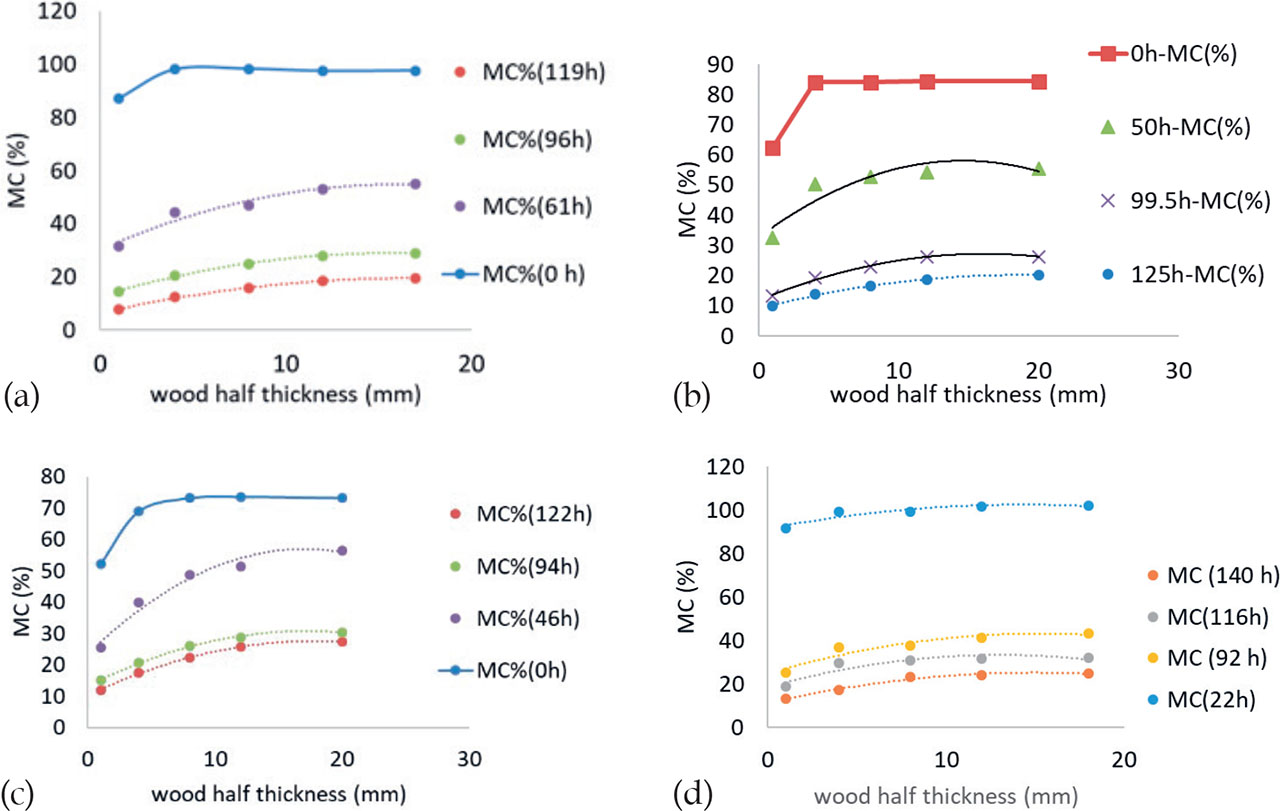
Figure 10.
Moisture profiles for different tree species at different times of drying: (a) alder; (b) aspen; (c) birch; and (d) pine, with moisture profiles-based data which is used in the article (Tamme et al., 2021a).
Table 7.
Equations of experimentally determined parabolic moisture profiles for different tree species, and an R-squared approximation. Independent x-value is the depth level (mm) from the board surface. Dependent y-value is the moisture content (MC%) at the depth level.
| Type of wood | Time (h) | Equation of parabolic MC profile | R2 |
|---|---|---|---|
| Black alder (Figure 10a) | 0 | --------- | ------ |
| 61 | y = − 0.0976x2 +3.0933x +30.2 | 0.9512 | |
| 96 | y = − 0.0655x2 +2.0568x+ 12.884 | 0.9964 | |
| 119 | y = − 0.047x2 +1.5694x + 6.4665 | 0.9974 | |
| Aspen (Figure 10b) | 0 | ----------- | -------- |
| 50 | y = − 0.1197x2 +3.4894x+32.592 | 0.8463 | |
| 99.5 | y = − 0.0597x2 +1.9168x + 11.8 | 0.9916 | |
| 125 | y = − 0.0315x2 +1.18x +9.1838 | 0.993 | |
| Birch (Figure 10c) | 0 | ----------- | -------- |
| 46 | y = − 0.1154x2 +3.9316x +23.5 | 0.9698 | |
| 94 | y = − 0.0599x2 +2.0472x +13.274 | 0.9981 | |
| 122 | y = − 0.0547x2 +1.9479x +10.274 | 0.9984 | |
| *Pine sapwood (Figure 10d) | 22 | y = − 0.054x2 +1.5471x +91.484 | 0.87 |
| 92 | y = − 0.0781x2 +2.3962x +24.791 | 0.8978 | |
| 116 | y = − 0.0867x2 +2.2641x +18.533 | 0.8615 | |
| 140 | y = − 0.0625x2 + 1.8709x +11.191 | 0.9769 |
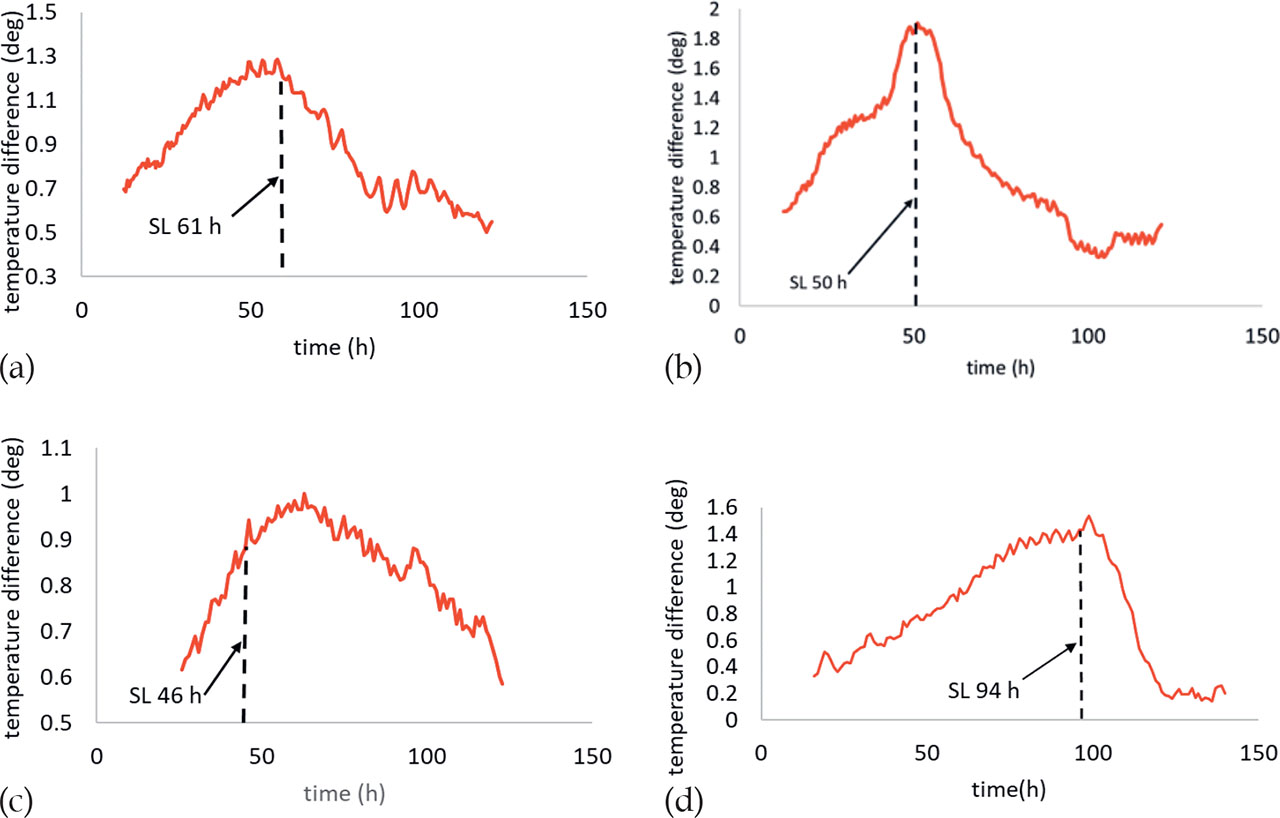
Figure 11.
A comparison of differences in surrounding air temperature and wood surface temperature for different tree species: (a) alder; (b) aspen; (c) birch; and (d) pine (according to the paper by Tamme et al. (2021a)).
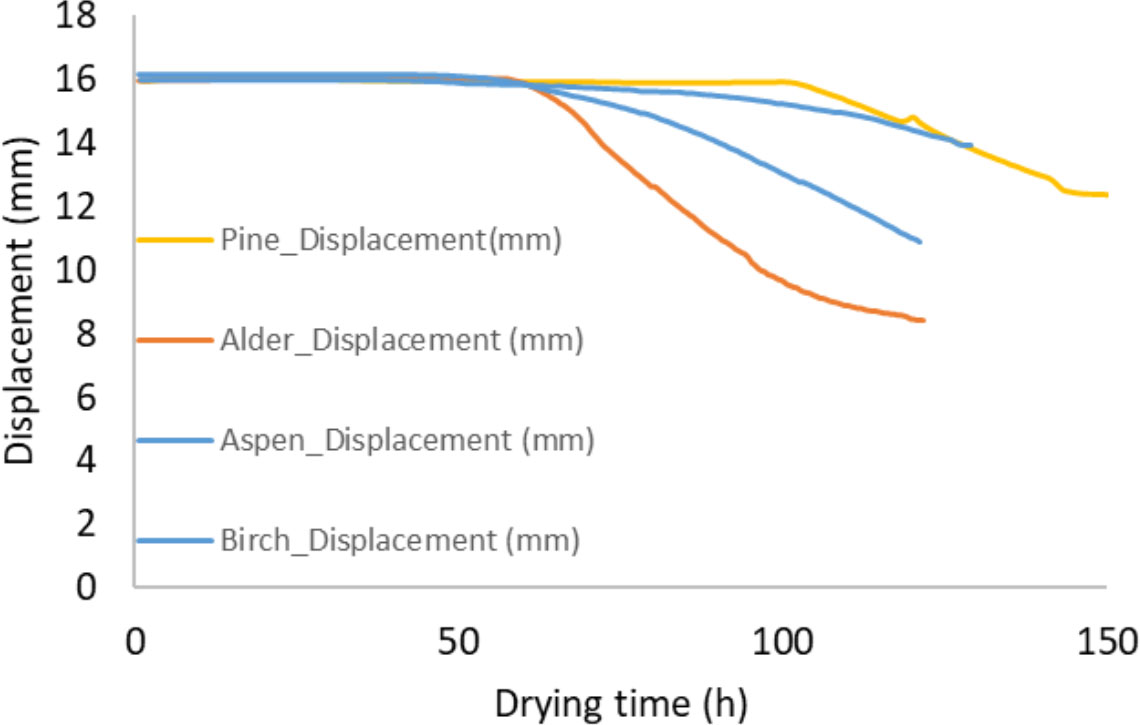
Figure 12.
A comparison of the behaviour of the surface layer displacement sensor as a function of time, for different tree species.
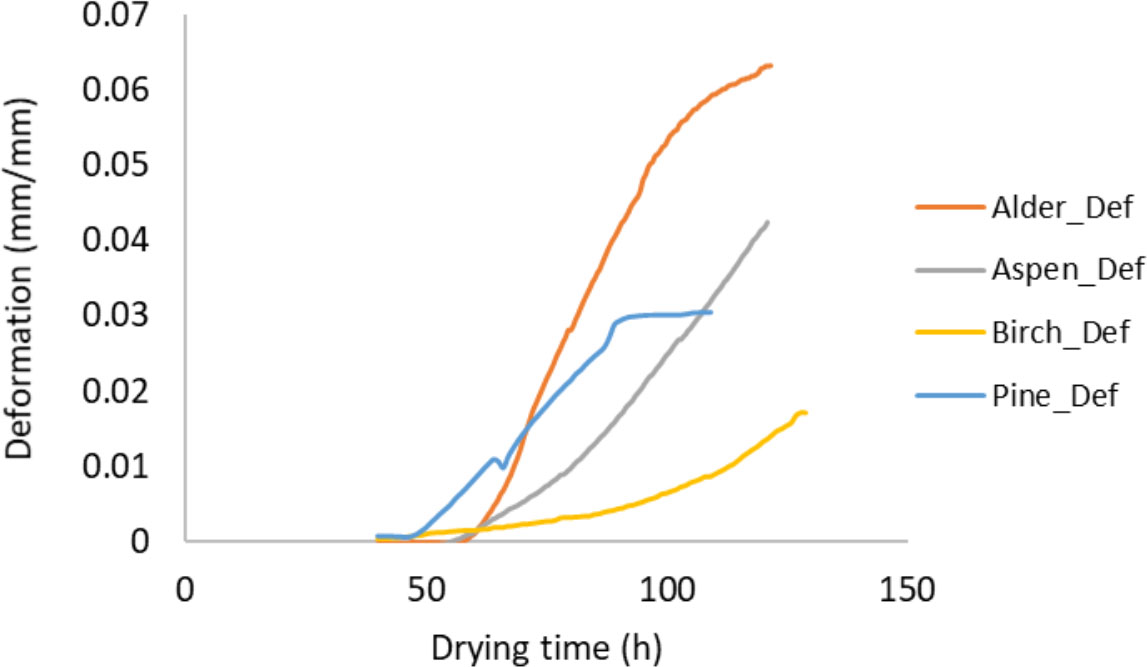
Figure 13.
A comparison of the total deformation in the surface layer depending on the drying time, for different tree species.