
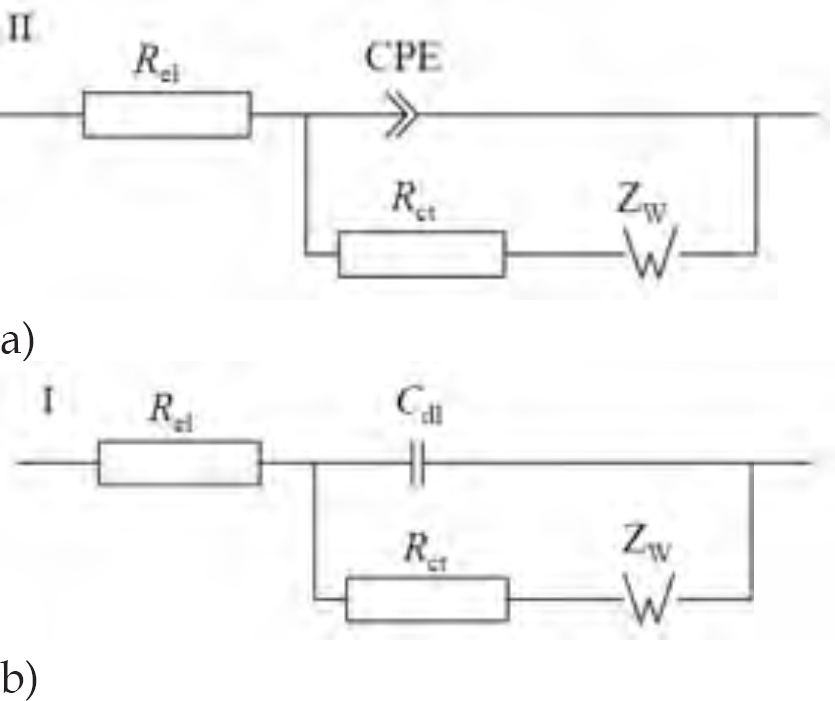
Figure 1.
Equivalent circuits used for modelling in the frequency domain: (a) equivalent circuit (II) adapted from the study by Zelinka et al. (2008), and (b) a simplified version of the equivalent circuit (I). Rel is electrolyte (birch sap) resistance, CPE is the constant phase element, Rct is charge transfer resistance, Cdl is double-layer electrical capacitance, and Zw is the Warburg element.
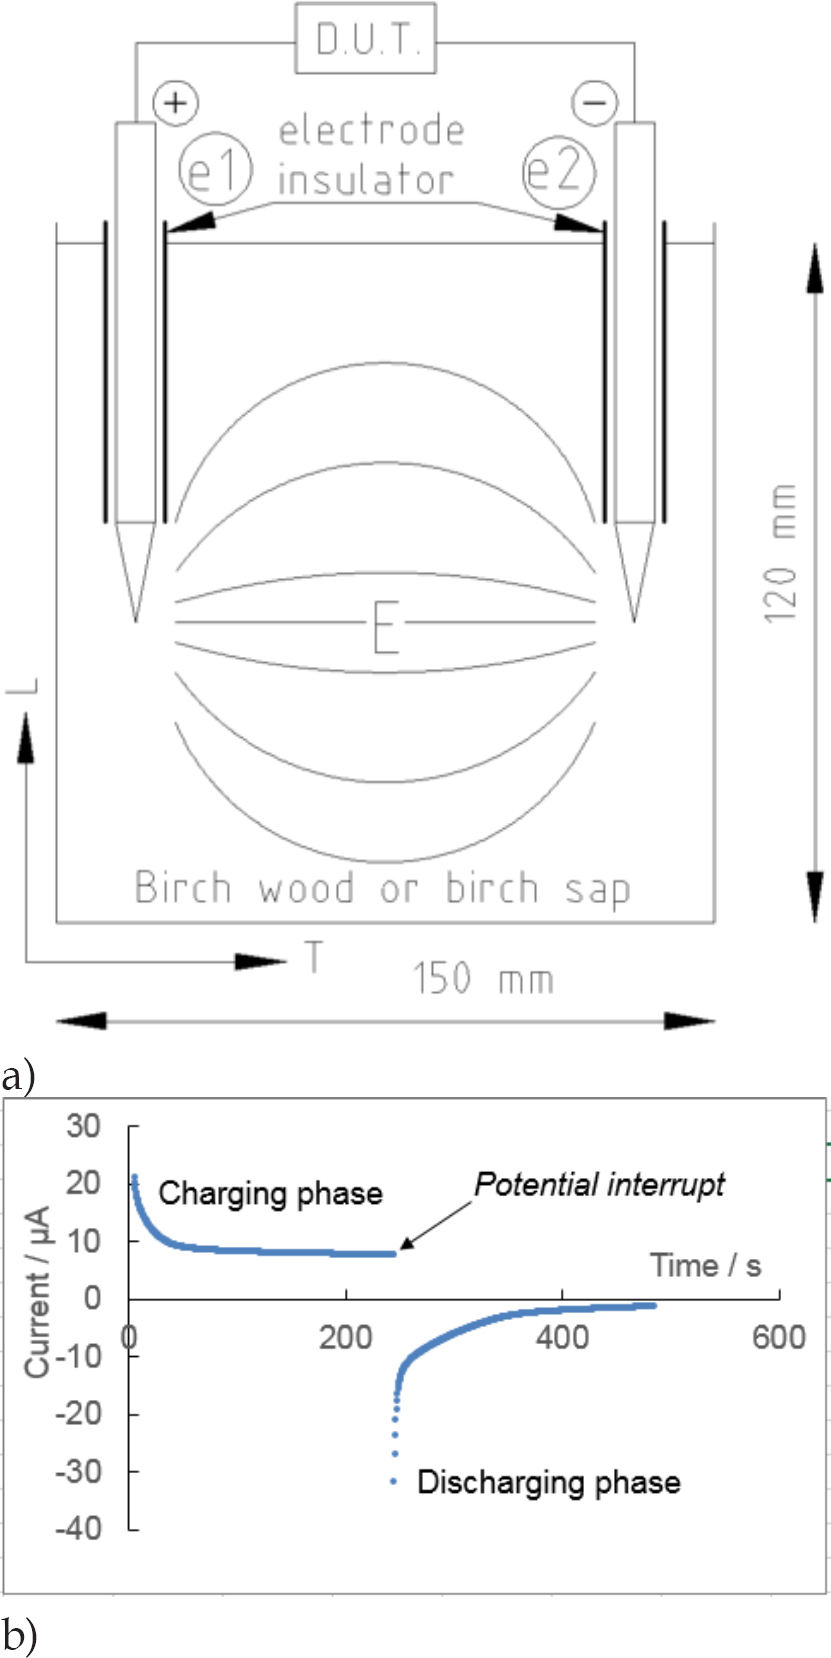
Figure 2.
Schematic diagram of the measuring cell (a), and typical current curves recorded with the CCD measuring procedure in the charging and discharging process (b). DUT means “device under test” using the selected measuring procedure, L – longitudinal and T– tangential directions, e1 and e2 are symmetrical pin electrodes, E is the electrical potential with equivalent potential lines, and birch wood or birch liquid sap are the mediums studied.
Table 1.
The capability of various measuring procedures to determine the potential and current strength of electrodes in the studied medium in the process of electrical charging and discharging. W1 – primary transmitted energy. W2 – secondary stored energy. E(t) – the time dependence of potential. I(t) – the time dependence of current. PDM – polarization-depolarization method. CCD – chrono charging-discharging. CP – chrono-potentiometry. EIS – electrical impedance spectroscopy. CV – cyclic voltammetry.
| Measuring procedure | Primary W1 – charging process | Secondary W2 – discharging process | ||
|---|---|---|---|---|
| E(t) | I(t) | E(t) | I(t) | |
| PDM | yes | yes | yes | yes |
| CCD | yes | yes | no | yes |
| CP | yes | yes | yes | no |
| EIS | yes | yes | no | no |
| CV | yes | yes | yes | yes |
Table 2.
Values of electrical parameters measured and calculated using direct current in the process of charging and discharging in wood and sap at different electrode potentials. E – potential in volts. W2 – primary energy. W2 – secondary energy. C1int – the primary integral electrical capacitance. C2int – the secondary integral electrical capacitance. CHA(E) – conventional chargeability and CHA(W) – energetic chargeability, according to the Formulas (1) (2) (3) (4) (6) and (7).
| Birch wood (B) | ||||||
|---|---|---|---|---|---|---|
| E / V | W1 / mJ | W2 / mJ | C1,int / mF | C2,int / mF | CHA(E) | CHA(W) |
| Legend on the figures | W1(B) | W2(B) | C1(B) | C2(B) | CHA(E)(B) | CHA(W)(B) |
| 0.4 | 0.0269 | 0.0092 | 0.172 | 0.0605 | 0.975 | 0.34 |
| 0.8 | 0.124 | 0.0455 | 0.202 | 0.0767 | 0.963 | 0.37 |
| 1.2 | 0.466 | 0.191 | 0.326 | 0.135 | 0.992 | 0.407 |
| 1.8 | 2.069 | 0.768 | 0.737 | 0.316 | 0.867 | 0.373 |
| 2.6 | 7.973 | 2.442 | 1.541 | 0.617 | 0.765 | 0.306 |
| Birch sap (BS) | ||||||
|---|---|---|---|---|---|---|
| Legend | W1(BS) | W2(BS) | C1(BS) | C2(BS) | CHA(E)(BS) | CHA(W)(BS) |
| 0.4 | 0.0144 | 0.0052 | 0.0898 | 0.0343 | 0.975 | 0.36 |
| 0.8 | 0.108 | 0.0329 | 0.169 | 0.058 | 0.938 | 0.3 |
| 1.2 | 0.519 | 0.187 | 0.361 | 0.132 | 0.992 | 0.357 |
| 1.8 | 72.711 | 2.299 | 22.44 | 0.718 | 0.994 | 0.032 |
| 2.6 | 108.79 | 4.052 | 16.09 | 0.604 | 0.996 | 0.075 |
Table 3.
Values of electrical parameters measured and calculated using direct current in the process of charging and discharging in wood and sap at different transmitted primary energies. W1 – primary transmitted energy in millijoules (mJ).
| Primary energy, W1 / mJ | W2 / mJ, (B) | W2 / mJ, (BS) | CHA (W), (B) | CHA(W), (BS) | W2(B)/ W2(BS) |
|---|---|---|---|---|---|
| Legend | W2(B) | W2(BS) | CHA(W)(B) | CHA(W)(BS) | W2(B)/ W2(BS) |
| 7.97 | 2.38 | 0.315 | 0.298 | 0.0395 | 7.5 |
| 32.9 | 3.683 | 1.191 | 0.112 | 0.0362 | 3.092 |
| 57.89 | 4.146 | 2.067 | 0.0716 | 0.0357 | 2.006 |
| 107.8 | 4.499 | 3.82 | 0.0417 | 0.0354 | 1.178 |
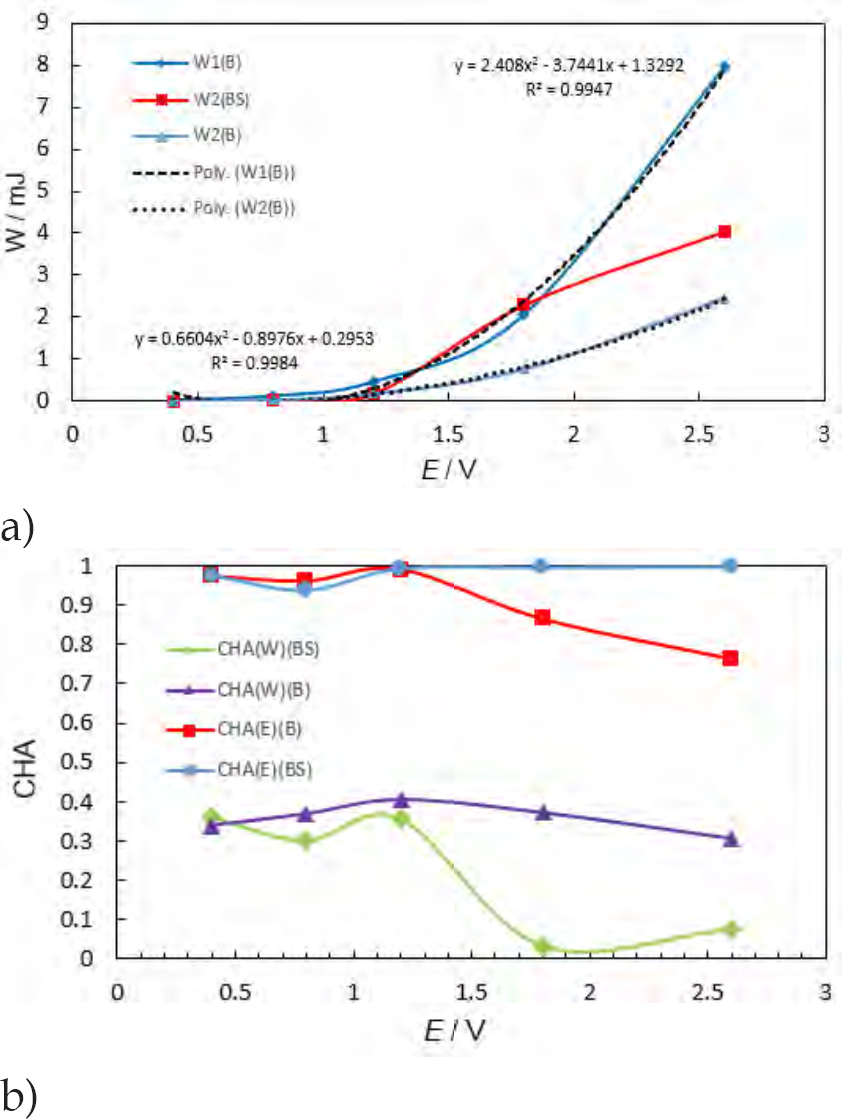
Figure 3.
Some of the values of energy which is stored in wood when compared to transmitted energy, depending upon the potential which can be applied to the electrodes (a), and (b) the dependencies of conventional CHA(E) (Schlumberger) and energetic chargeability CHA(W) on the potential applied to the electrodes.
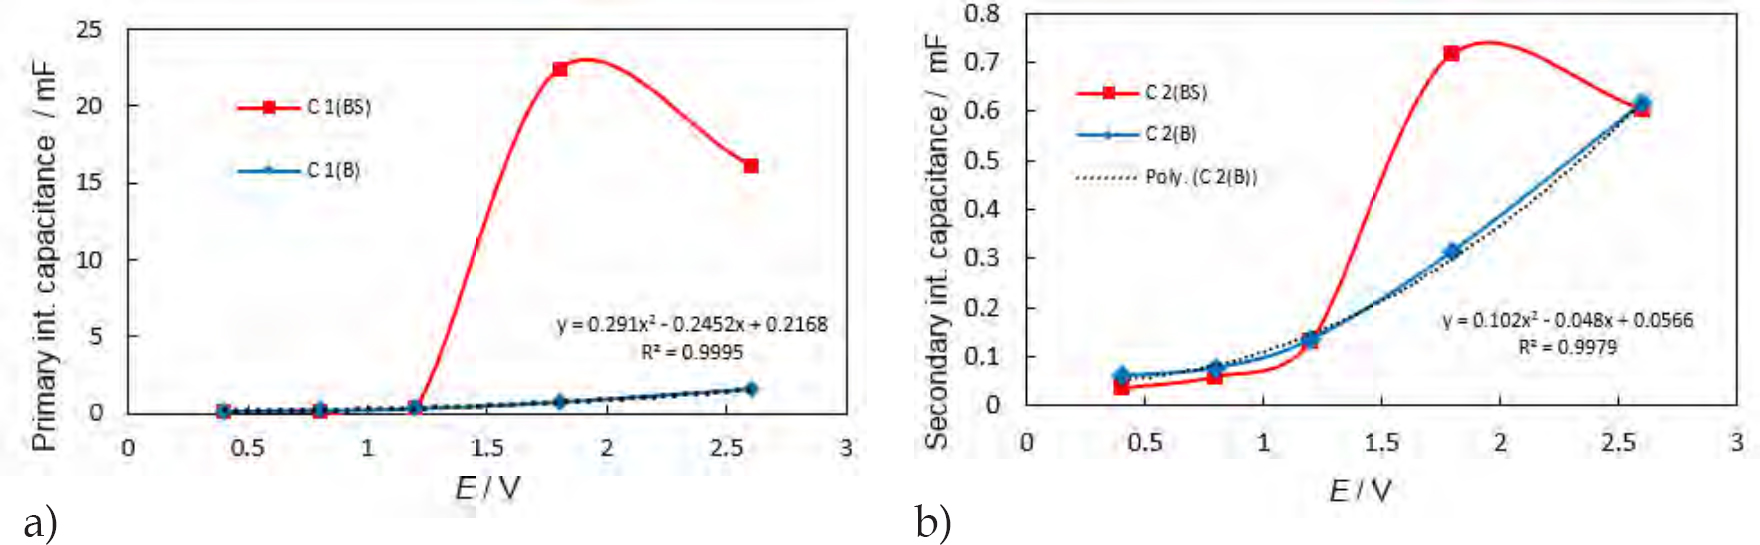
Figure 4.
Different integral electrical capacitances as dependent on the electrode potential, (a) integral electrical capacitances of birch wood and birch sap in the charging process, and (b) integral electrical capacitances of birch wood and birch sap in the discharging process.
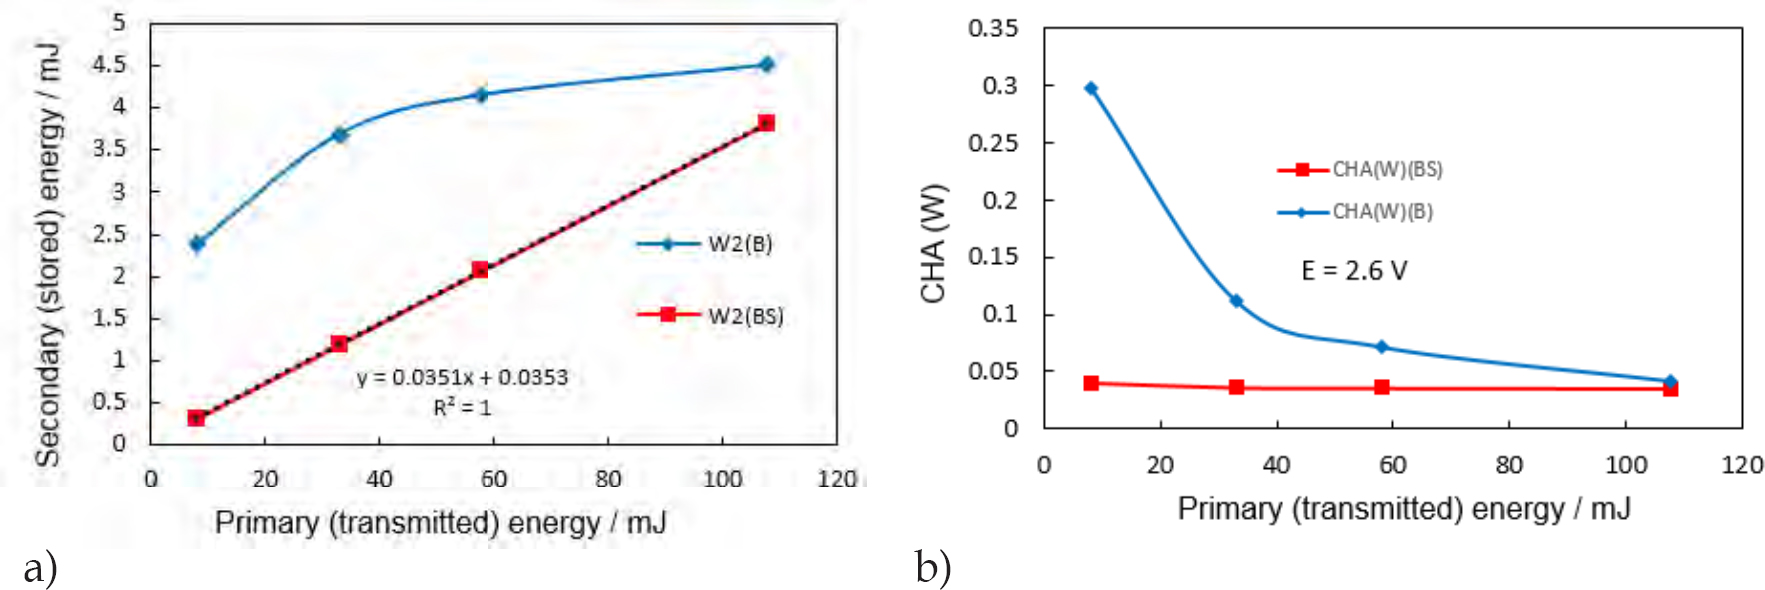
Figure 5.
Dependencies of energies stored in birch wood and birch sap on the transmitted primary energy (a), and (b) the energetic chargeability of birch wood and birch sap as dependent on the transmitted primary energy.
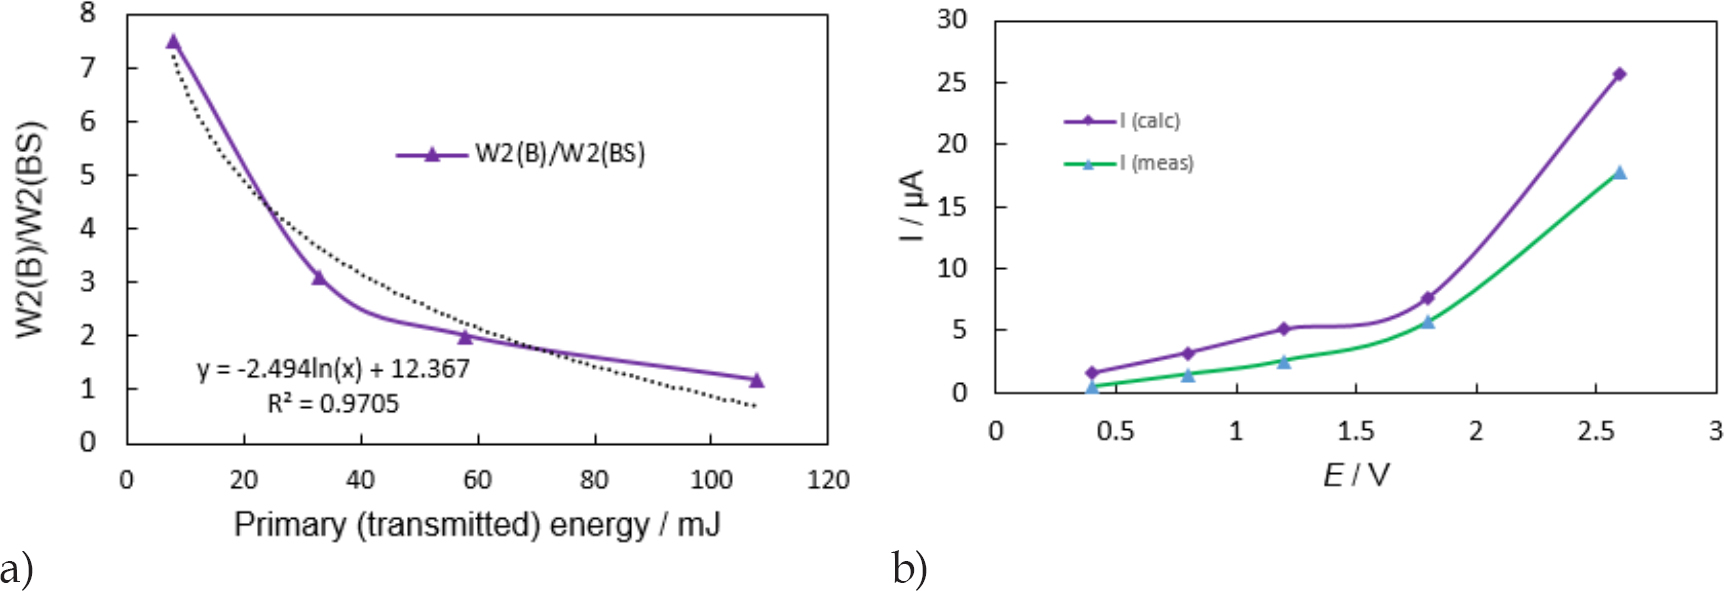
Figure 6.
Ratios between secondary energies stored in wood and sap as dependent on the transmitted primary energy (a), and (b) comparison of direct current strengths of the CCD and EIS measuring procedures at different potentials (at the time moment of 240 sec.).
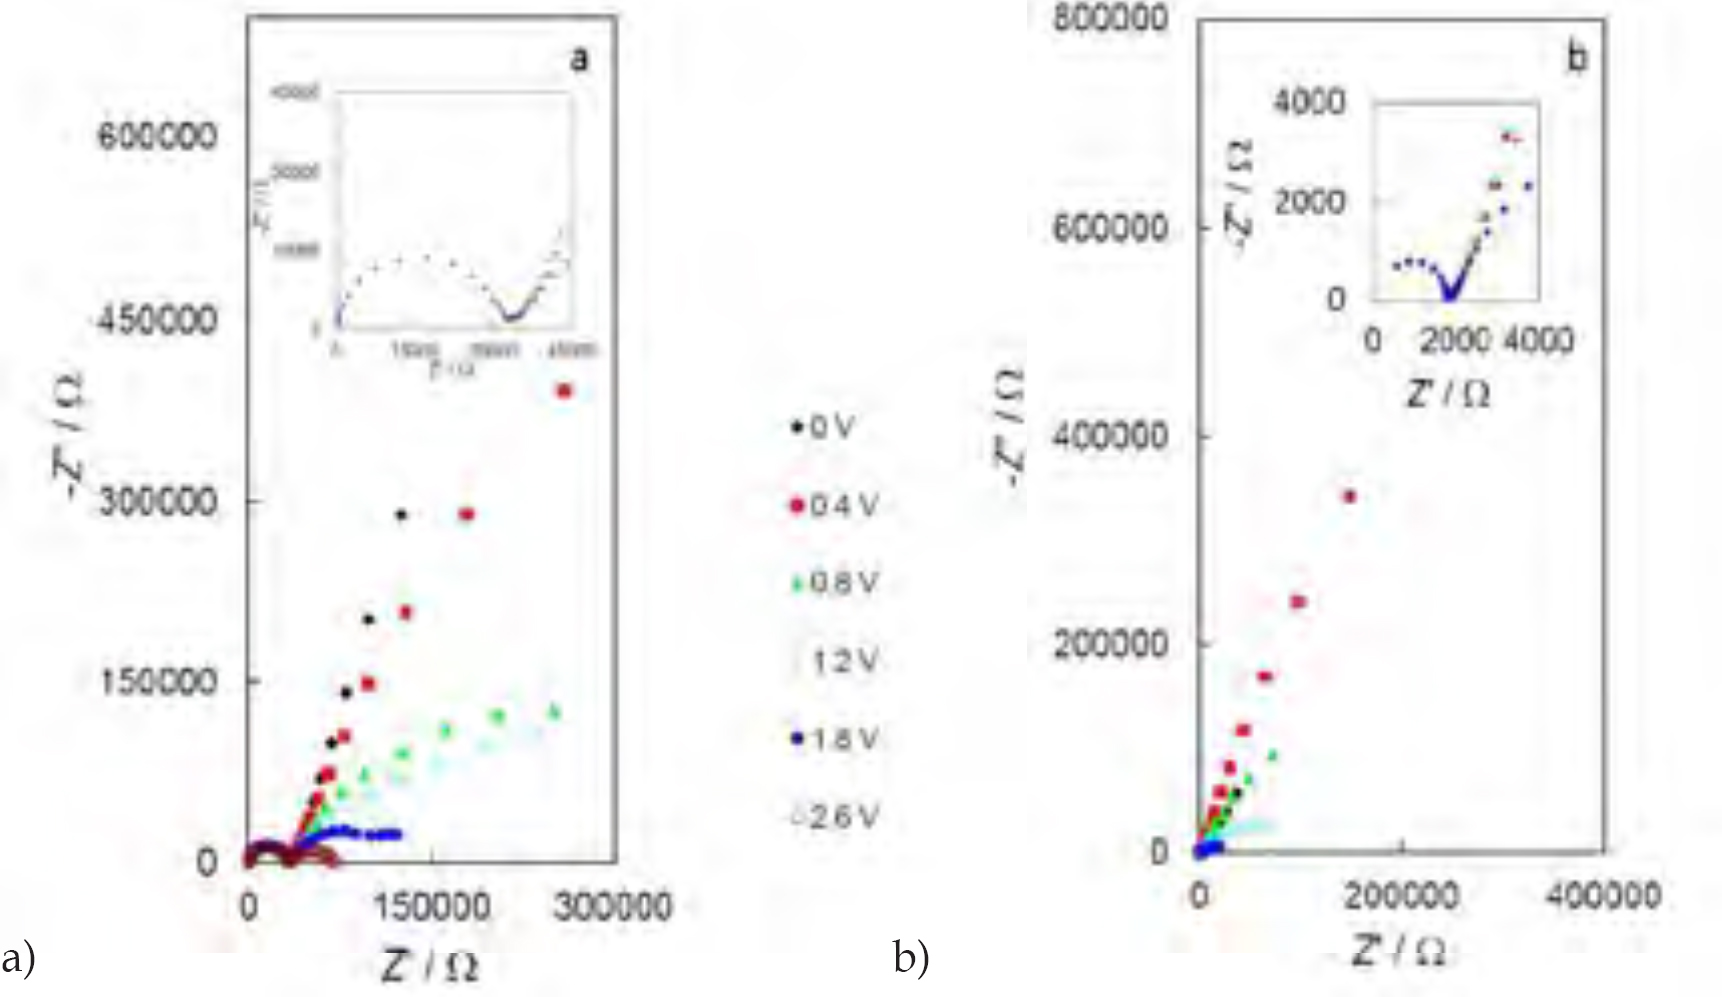
Figure 7.
Nyquist plots at different electrode potentials for birch wood- (a) and birch sap- (b) based systems, respectively.
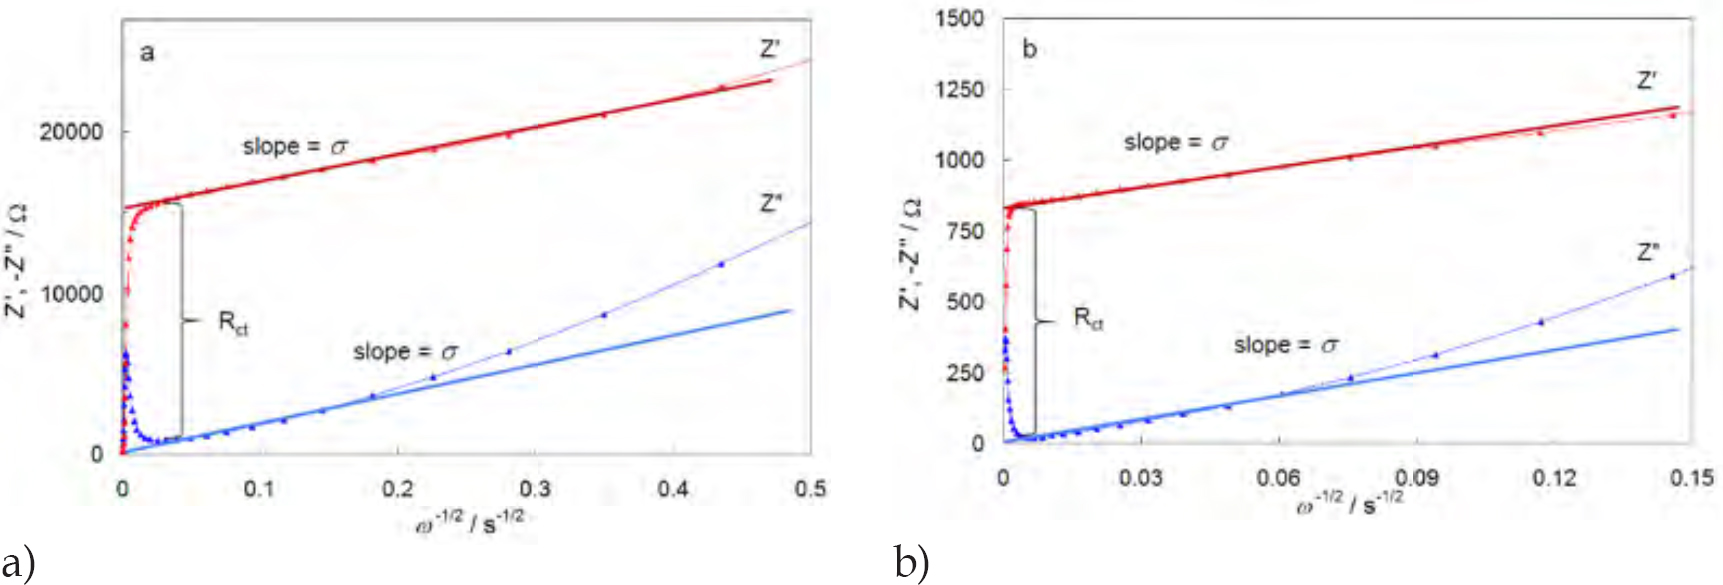
Figure 8.
Calculation of Rct and σ from impedance data for birch wood- (a) and birch sap- (b) based systems at potential 0.8V.
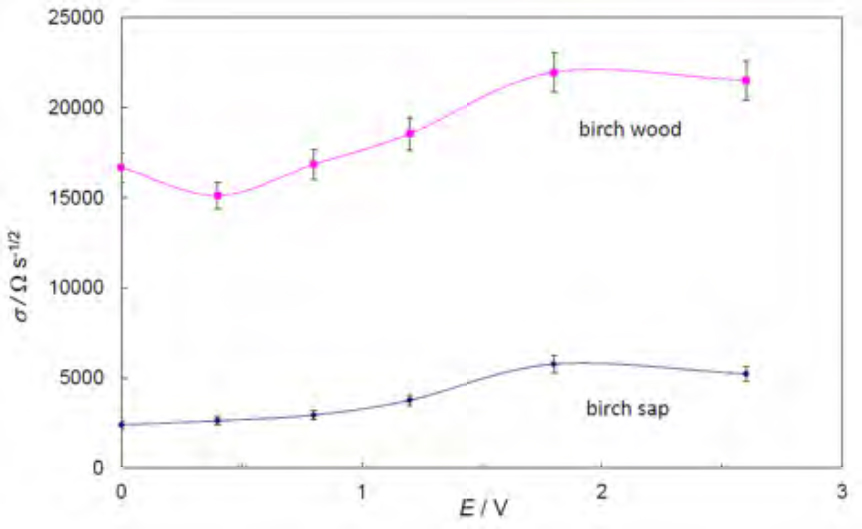
Figure 9.
Dependence of the mass-transfer coefficient on the electrode potential for birch wood- and birch sap-based systems.
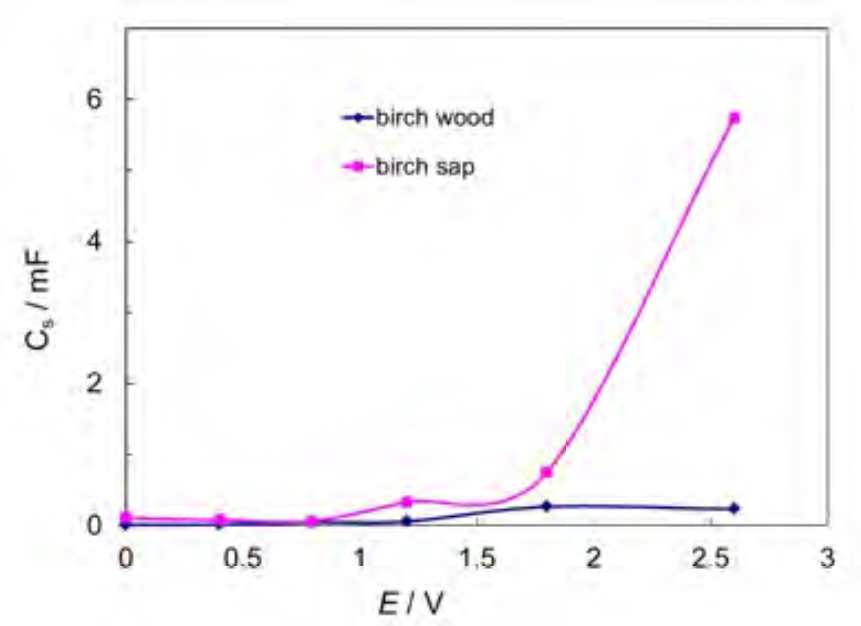
Figure 10.
Dependence of series capacitance at frequency f = 25.5 mHz on electrode potential for birch wood- and birch sap-based systems.
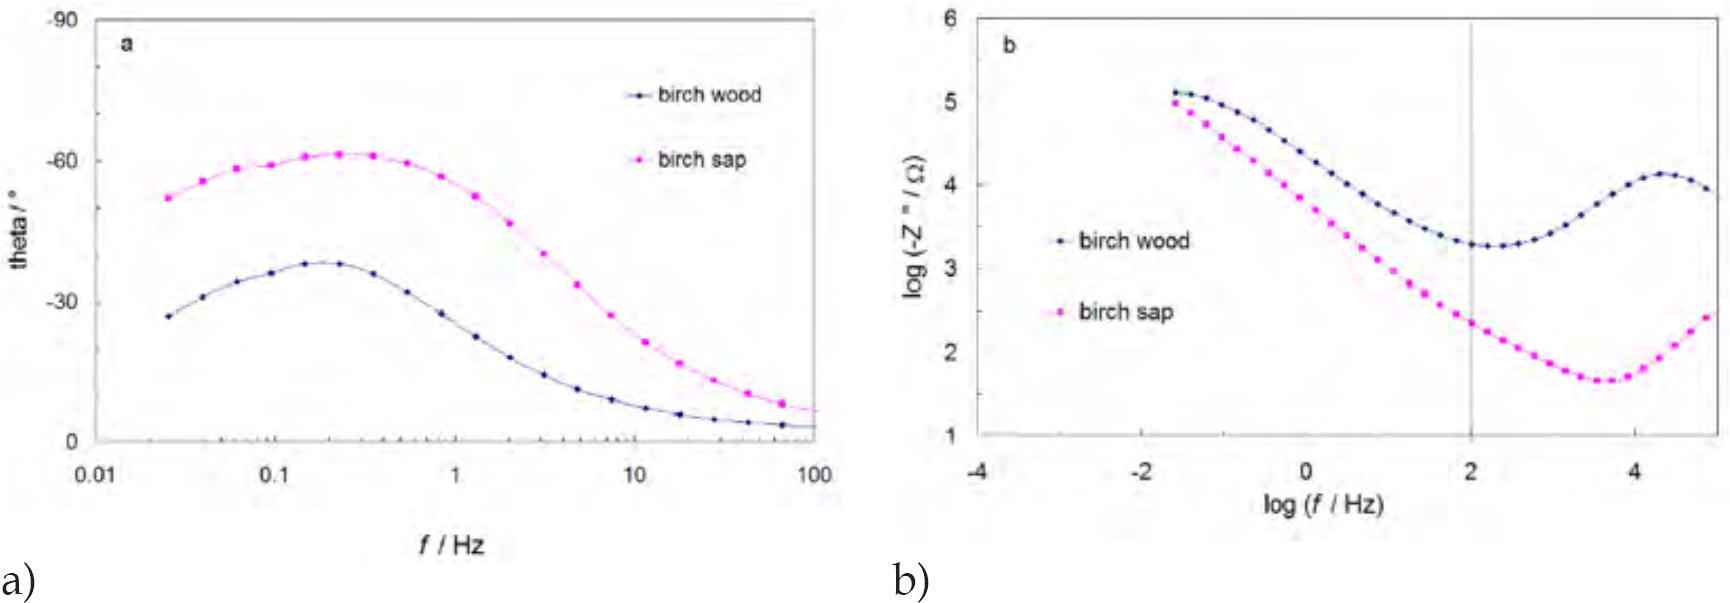
Figure 11.
Dependence of phase angle (a) and log -Z″ (b) on AC frequency for birch wood- and birch sap-based systems at potential 0.8 V.
Table 4.
Results of modelling the equivalent circuit shown in Figure 1a with the ZView ver. 2.3 [35] program in the frequency domain. χ 2 – goodness parameter of fitting. CPE – constant phase element. E – potential in volts. Rel – resistance of the electrolyte (sap). Cdl – double layer capacitance. Rct – the charge transfer resistance. RD – the limiting diffusion resistance. T – the diffusion time constant. αw – fractional exponent for Warburg-like diffusion impedance. α – the CPE fractional exponent.
| Birch wood | ||||||||
|---|---|---|---|---|---|---|---|---|
| E / V | χ 2 | R el / Ω | C dl / μF | R ct / kΩ | R D / kΩ | T / s rad-1 | α w | α |
| 0 | 0.00433 | 238.8 | 12.13 | 15.5 | 611.6 | 78.29 | 0.52 | 0.936 |
| 0.4 | 0.00433 | 237.7 | 12.13 | 15.8 | 611.6 | 78.29 | 0.52 | 0.936 |
| 0.8 | 0.00424 | 295.3 | 20.31 | 15.6 | 74.25 | 2.21 | 0.47 | 0.938 |
| 1.2 | 0.00685 | 285.8 | 23.56 | 15.54 | 68.08 | 1.695 | 0.462 | 0.939 |
| 1.8 | 0.00432 | 285.4 | 97.65 | 15.54 | 63.19 | 1.21 | 0.461 | 0.939 |
| 2.6 | 0.00325 | 256.2 | 21.32 | 14.83 | 34.23 | 1.383 | 0.278 | 0.943 |
| Birch sap | ||||||||
|---|---|---|---|---|---|---|---|---|
| 0 | 0.00162 | 147 | 50.7 | 0.95 | 2950 | 30.96 | 0.97 | 0.651 |
| 0.4 | 0.00767 | 148 | 27.9 | 0.55 | 3078 | 30.54 | 0.976 | 0.666 |
| 0.8 | 0.00413 | 148 | 27.9 | 0.77 | 3077 | 30.54 | 0.976 | 0.666 |
| 1.2 | 0.00397 | 162 | 35.08 | 3.2 | 30.85 | 5.40 | 1.69 | 0.754 |
| 1.8 | 0.00282 | 152 | 36.9 | 13.2 | 8.144 | 2.38 | 2.141 | 0.686 |
| 2.6 | 0.00265 | 166.5 | 29.1 | 6.2 | 3.29 | 3.6 | 2.058 | 0.687 |
Table 5.
Results of modelling the equivalent circuit shown in Figure 1b with the ZView ver. 2.3 (Scribner Inc., 2022) program in the frequency domain.
| Birch wood | |||||||
|---|---|---|---|---|---|---|---|
| E / V | χ 2 | R el / Ω | C dl / μF | R ct / kΩ | R D / kΩ | T / s rad -1 | α w |
| 0 | 0.00107 | 283.8 | 9.86 | 14.9 | 89.22 | 4.615 | 0.406 |
| 0.4 | 0.00103 | 273.7 | 12.89 | 14.7 | 71.38 | 5.166 | 0.361 |
| 0.8 | 0.00114 | 295.3 | 17.397 | 14.84 | 67.10 | 2.544 | 0.403 |
| 1.2 | 0.0014 | 285.8 | 22.78 | 14.89 | 70.76 | 2.057 | 0.421 |
| 1.8 | 0.00963 | 285.4 | 13.36 | 13.24 | 134.28 | 5.51 | 0.225 |
| 2.6 | 0.00732 | 256.2 | 9.485 | 12.62 | 65.99 | 4.46 | 0.055 |
| Birch sap | |||||||
|---|---|---|---|---|---|---|---|
| 0 | 0.0024 | 146.95 | 195.25 | 0.83 | 83.43 | 20.26 | 0.64 |
| 0.4 | 0.00416 | 136.1 | 98.41 | 0.85 | 60.28 | 16.51 | 0.692 |
| 0.8 | 0.00287 | 148.9 | 46.36 | 0.82 | 11.023 | 13.85 | 0.545 |
| 1.2 | 0.00807 | 162.2 | 77.14 | 0.81 | 13.76 | 10.57 | 0.586 |
| 1.8 | 0.0076 | 152.1 | 155.43 | 0.83 | 6.739 | 3.11 | 0.534 |
| 2.6 | 0.0069 | 166.5 | 351.44 | 0.79 | 65.99 | 4.57 | 0.502 |