
Table 1
The species present in the overstory prior to harvest in the Richland Furnace State Forest and Zaleski State Forest, southern Ohio.
| Upland Oak | Mixed Hardwoods | Understory | Hickory |
|---|---|---|---|
| Quercus alba L. Quercus coccinea Muenchh. Quercus prinus L. Quercus rubra L. Quercus velutina Lam. | Acer saccharum Marsh. Acer rubrum L. Fagus grandifolia Ehrh. Fraxinus americana L. Fraxinus pennsylvanica Marsh. Liriodendron tulipifera L. Nyssa sylvatica Marsh. Populus grandidentata Michx. Prunus serotina Ehrh. Ulmus americana L. Ulmus rubra Muhl. | Amelanchier spp. Carpinus caroliniana Walt. Corylus americana Marsh. Hamamelis virginiana L. Lindera benzoin L. Ostrya virginiana (Mill.) K. Koch Sassafras albidum (Nutt.) Nees Viburnum spp. | Carya glabra (Mill.) Carya laciniosa (Michx. f.) Lould. Carya tomentosa (Poir.) Nutt. |
Table 2
Forest attributes in Richland Furnace State Forest and Zaleski State Forest in southern Ohio before and after prescribed burns. Dbh – diameter at breast height.
| Time period | Forest | Basal area (m2 ha−1) | Trees (ha−1) | Dbh (cm) | Stocking (%) |
|---|---|---|---|---|---|
| Before burn | Rich. Furn. SF | 15.6 | 106 | 43.4 | 52 |
| Zaleski SF | 15.9 | 129 | 37.1 | 54 | |
| After burn | Rich. Furn. SF | 12.0 | 101 | 37.2 | 41 |
| Zaleski SF | 9.6 | 120 | 28.1 | 34 | |
Table 3
Analysis of variance statistics for large seedling (0.3–1.3 m total height) canopy volume (m3 ha−1) and large seedling stems per hectare within each species group before and after fall and spring burns in Richland Furnace and Zaleski State Forests in southern Ohio.
| Attribute | Variable | Source of variation | RMSE | F value | Pr > F |
|---|---|---|---|---|---|
| Canopy volume | Fall burn | Time relative to burn | 182.01 | 1.99 | 0.1604 |
| Spring burn | Time relative to burn | 126.23 | 0.01 | 0.9936 | |
| Pre-burn | Burn season | 106.39 | 0.92 | 0.3394 | |
| Post-burn | Burn season | 196.22 | 0.59 | 0.4453 | |
| Fall burn | Pre-burn | 60.14 | 2.14 | 0.0711 | |
| Post-burn | 234.86 | 2.85 | 0.0217 | ||
| Spring burn | Pre-burn | 141.72 | 0.56 | 0.7271 | |
| Post-burn | 103.81 | 3.03 | 0.0168 | ||
| Stems per hectare | Fall burn | Time relative to burn | 2646.09 | 2.05 | 0.1541 |
| Spring burn | Time relative to burn | 2488.14 | 0.22 | 0.6367 | |
| Pre-burn | Burn season | 2325.26 | 0.28 | 0.5969 | |
| Post-burn | Burn season | 2796.71 | 1.79 | 0.1837 | |
| Fall burn | Pre-burn | 2106.04 | 2.18 | 0.0669 | |
| Post-burn | 2222.38 | 13.25 | <.0001 | ||
| Spring burn | Pre-burn | 2457.37 | 1.06 | 0.3929 | |
| Post-burn | 2335.16 | 3.06 | 0.0159 | ||
Table 4
The mean1 (standard deviation) of the total crown volume (m3 ha−1) of large seedlings (0.3–1.3 m total height) for species group one year before and one year after prescribed fire by burn season (fall vs spring) in Zaleski and Richland Furnace State Forests in southern Ohio.
| Fall burn | Spring burn | |||
|---|---|---|---|---|
| Species | Pre-burn | Post-burn | Pre-burn | Post-burn |
| Red oak | 24.1 (21.0)Aa | 20.7 (25.3)Aa | 51.4 (92.5)Aa | 16.9 (17.7)Aa |
| White oak | 23.3 (32.7)Aa | 38.3 (55.6)Aa | 47.1 (108.4)Aa | 43.1 (105.5)ABa |
| Hickory | 15.9 (19.3)Aa | 6.6 (9.0)Aa | 11.2 (9.1)Aa | 14.3 (14.2)Aa |
| Red maple | 40.2 (49.8)ABa | 96.4 (70.2)Ab | 50.9 (51.0)Aa | 128.0 (140)Ba |
| Yellow-poplar | 62.9 (119.4)ABa | 32.3 (64.9)Aa | 97.7 (306.1)Aa | 20.6 (80.9)Aa |
| Mixed Hardwoods | 79.9 (57.3)Ba | 308.9 (194.2)Ba | 92.3 (104.8)Aa | 126.6 (114.0)Ba |
1 Means followed by the same capital letter are not significantly between species within burn season (fall/spring) and time relative to burn (pre-burn/post-burn). Means followed by the same small case letter are not significantly different between time relative to burn within species and burn season, Duncans MRT (p = 0.05).
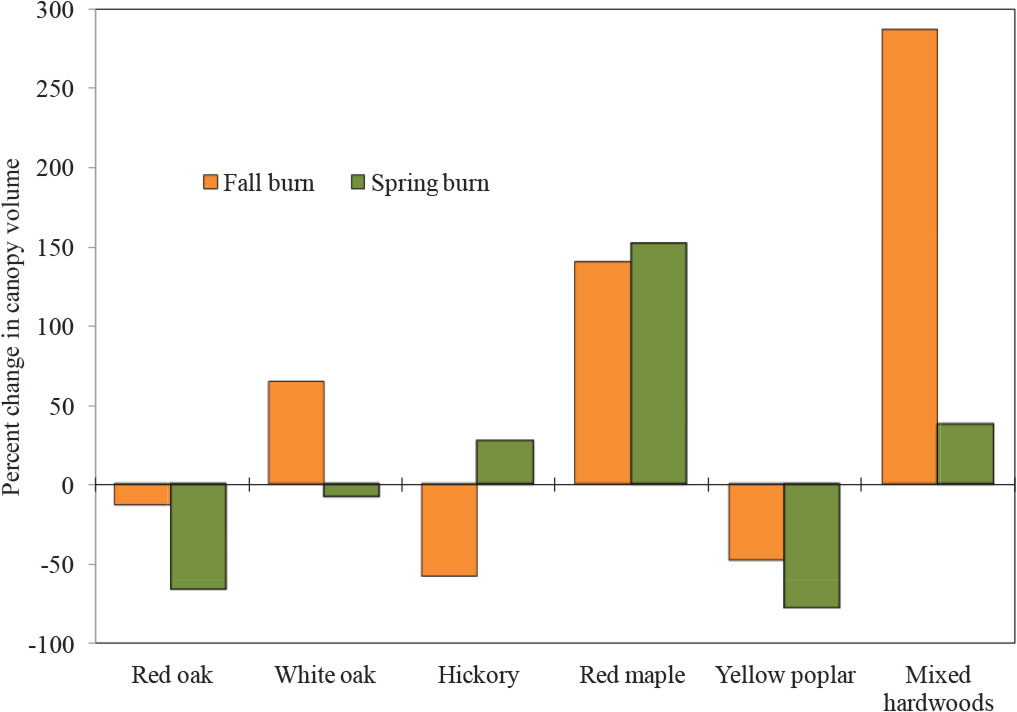
Figure 1
The percent change in large seedling (0.3–1.3 m total height) canopy volume (m3 ha−1) after fall and spring burns in Richland Furnace and Zaleski State Forests of southern Ohio.
Table 5
The mean1 (standard deviation) of the number (stems per hectare) of large seedlings (0.3–1.3 m total height) for species group one year before and one year after prescribed fire by burn season (fall vs spring) in Zaleski and Richland Furnace State Forests in southern Ohio.
| Fall burn | Spring burn | |||
|---|---|---|---|---|
| Species | Pre-burn | Post-burn | Pre-burn | Post-burn |
| Red oak | 1334 (1039)ABa | 1379 (725)ABa | 1334 (1137)Aa | 1127 (894)ABa |
| White oak | 1503 (1451)ABa | 1688 (1721)ABa | 1733 (2629)Aa | 2021 (3185)ABCa |
| Hickory | 325 (267)Aa | 280 (354)Aa | 373 (252)Aa | 314 (219)Aa |
| Red maple | 1758 (1596)ABa | 3100 (2072)Ba | 1302 (1251)Aa | 2582 (1891)ABCa |
| Yellow-poplar | 2589 (3978)Ba | 926 (1216)ABa | 1725 (4476)Aa | 674 (1878)ABa |
| Mixed hardwoods | 2783 (1903)Ba | 6710 (3566)Cb | 2686 (2530)Aa | 3543 (3828)Ca |
1 Means followed by the same capital letter are not significantly different between species within burn season (fall/spring) and time relative to burn (pre-burn/post-burn). Means followed by the same small case letter are not significantly different between time relative to burn within species and burn season, Duncans MRT (p = 0.05).
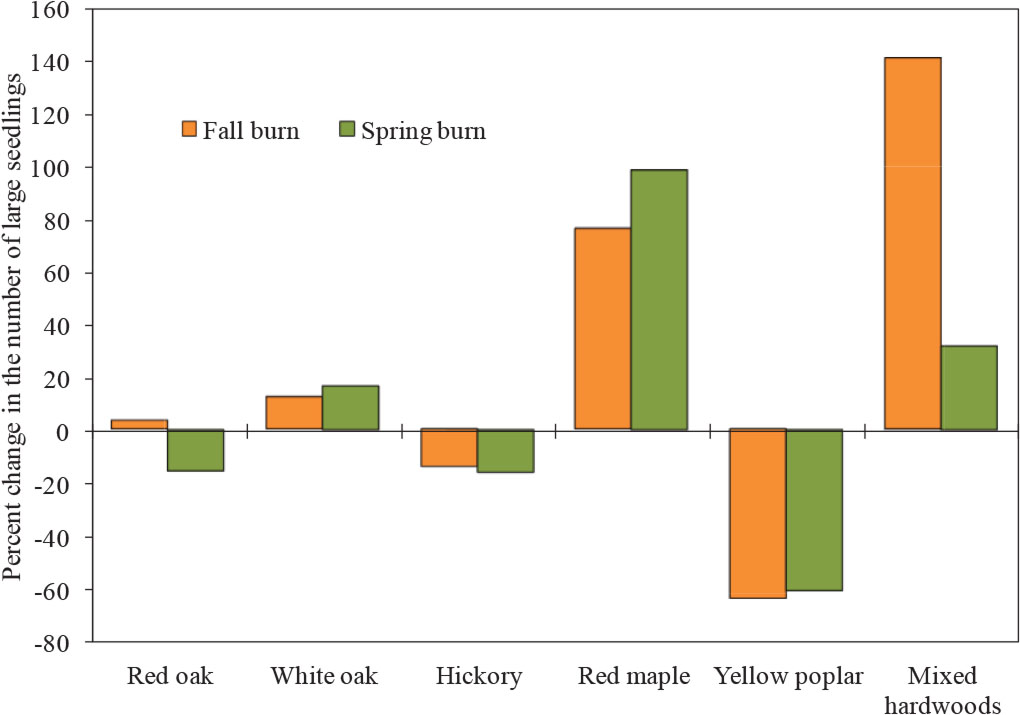
Figure 2
The percent change in the number of large seedling (0.3–1.3 m total height) stems per hectare after fall and spring burns in Richland Furnace and Zaleski State Forests of southern Ohio.
Table 6
The Importance Value Index1 for large seedlings (0.3–1.3 m total height) by species groups and burn season one year before and after prescribed fire in Zaleski and Richland Furnace State Forests of southern Ohio. The Importance Value Index ranking is indicated in the parenthesis.
| Fall burn | Spring burn | |||
|---|---|---|---|---|
| Species group | Pre-burn | Post-burn | Pre-burn | Post-burn |
| Red oak | 115.1 (5) | 113.9 (4) | 111.1 (4) | 115.8 (4) |
| White oak | 116.4 (4) | 119.6 (3) | 114.2 (3) | 122.9 (3) |
| Hickory | 101.9 (6) | 87.9 (6) | 89.1 (6) | 107.2 (5) |
| Red maple | 125.7 (3) | 141.2 (2) | 110.6 (5) | 161.8 (2) |
| Yellow-poplar | 143.0 (2) | 97.61 (5) | 119.4 (2) | 76.1 (6) |
| Mixed hardwoods | 151.8 (1) | 209.0 (1) | 146.6 (1) | 170.8 (1) |
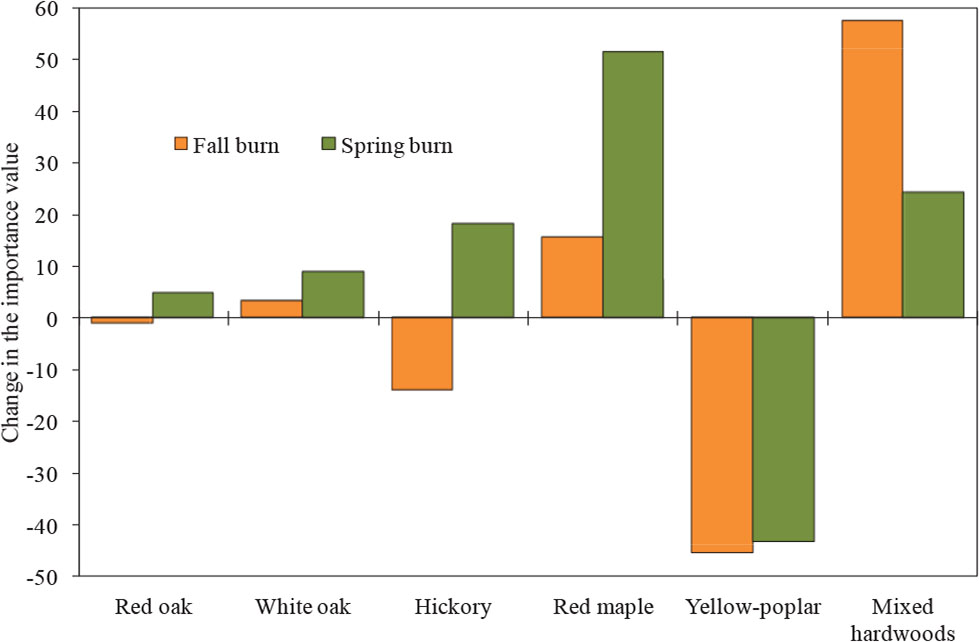
Figure 3
The change in magnitude of the Importance Value Index for selected species groups of large seedlings (0.3–1.3 m total height) after fall and spring burns in Richland Furnace and Zaleski State Forests located in southern Ohio. Seedling crown volume was used in the calculation instead of basal area to determine relative dominance.