
I. Introduction
Financial strain often harms marital satisfaction and well-being (e.g. Kerkmann et al. 2000; Kostouli, Xanthopouloua, & Athanasiades, 2016). Financial disagreement, criticism, and conflict are key indicators of the impact a financial situation has on a couple's marital satisfaction (Archuleta, Grable, & Britt, 2013). When financial disagreements increase, the likelihood of divorce increases as well (Dew, Britt, & Huston, 2012). The broad question we consider here is why some couples struggle when finances get tight, while others are more successful at navigating through this adversity.
We begin by considering communication, noting that how partners communicate is key to determining whether finances ultimately strain a partnership. When partners are financially stressed, they are less likely to communicate and more likely to avoid conflict (Mishra, Garbinsky, & Shu, 2025). The openness and transparency of partners are key drivers in identifying how and when communication affects financial management behaviours, value alignment, and satisfaction (Koochel et al. 2020).
Given that genders differ in their reactions to finances and communication patterns, we expect the influence of financial transparency and financial strain on satisfaction and well-being to vary by gender. Generally, women have lower financial satisfaction than men, a pattern observed within and outside of marriages (Fan & Babiarz 2019). Historically, genders have taken on different financial roles within a marriage, although today those roles may not conform to conventional gender expectations. As females take on a greater financial role, their satisfaction and the stability of their unions are decreasing, especially when the balance of power in a relationship is uneven (Lebaron-Black et al. 2024). Male and female partners also tend to have different communication styles. Wives are more likely to engage in financially relevant self-disclosure than their husbands (Dindia & Allen 1992). Such disclosures can lead to meaningful differences in marital satisfaction. A husband's self-report of healthy communication impacts both partners’ perceptions of disagreements, but a wife's healthy communication only impacts their own perception of disagreement (Saxey et al. 2024).
To better understand how financial transparency affects well-being in marriage, we examine gender roles in financial communication between partners. To our knowledge, this is one of the earliest papers to examine financial transparency dyadically, examining each partner within a marriage and focusing on how the genders differ in their communication and well-being. The goal of this paper is to examine whether there are differences in how transparent husbands and wives are in their financial communication and whether these differences ultimately impact each partner's expectations and feelings of well-being about their finances and marital satisfaction.
II. Literature Review
A couple's financial situation and satisfaction are deeply intertwined and demonstrate bidirectional effects. For example, finances impact happiness, which in turn impacts financial management. A couple's financial situation and financial planning both predict how content a couple feels regarding their finances (Lee & Dustin 2021). A poor financial situation, felt as financial pressure, is highly predictive of marital tension and distress (Conger, Reuter, & Elder 1999; Sawai et al. 2018; Totenhagen et al. 2018). Just as strain can decrease satisfaction, sound financial management can increase satisfaction. Active financial management, including financial planning behaviours and defining financial roles, can increase marital quality both by improving satisfaction and by decreasing conflict now and in the future (Dew, Barnham, & Hill 2021; Lee & Dustin 2021; Saxey et al. 2026). Couples and Finance Theory asserts that financial management, financial satisfaction, and marital quality are all interdependent within a complex ecosystem (Archuleta 2013).
a. Communication and Financial Transparency
Among the drivers of financial and marital satisfaction are communication, shared goals, and financial roles (Archuleta 2013). While financial transparency is still not well understood from a dyadic perspective, previous research has examined financial behaviours and communication dyadically within a marriage. The quality of communication is a key explanatory variable of this relationship (Saxey, Lebaron-Black, & Curran 2022). Discussing finances early in a marriage can increase marital quality, but can also increase financial conflict. Poor communication or conflict over finances are highly predictive of how financial strain affects marital satisfaction (Jackson, Carrese, & Willoughby 2023; Litzinger & Gordon 2005). Financial stress and communication are associated with increased argumentation. Here, financial communication includes the frequency of discussing finances, openness of communication, and agreeableness (Grobbelaar and Alsemgeest 2016). Negative communication within couples is one of the best predictors of instability and dissolution (Kanter et al. 2022). Therefore, the key to happy marriages may not lie strictly in reducing financial strain, but rather in improving communication and financial planning behaviours among couples. This finding may be particularly important given modern society's movement away from specialisation in marriage, in which females do unpaid household labour while men perform paid labour outside of the home, and towards a greater levelling of gender roles, highlighting the need for more collaborative financial management (Lundberg & Pollack 2015).
Communication is also important so that partners can align their values. Similarity of financial values predicts marital satisfaction and stability. This relationship is explained by financial communication (LeBaron-Black et al. 2023). Even when not explicitly discussed, aligning how couples think about finances impacts marital quality. Concordant “money scripts,” which are narratives that describe how people think about money, are associated with better communication and marital satisfaction (LeBaron-Black et al. 2025). However, not all money scripts improve satisfaction. Money focus, which describes a form of overemphasis on material possessions and specifically believing that money can solve problems and bring happiness, is detrimental to satisfaction.
In this context, the newly validated measure of financial transparency (Koochel et al. 2020), which reflects the level of openness in the communication and execution of financial tasks within a couple, can help explain financial well-being. Financial transparency measures can be leveraged to understand how couples’ interactions and perceptions within the area of financial planning and financial behaviours relate to marital and financial satisfaction. Although currently sparse, research on financial transparency has indicated that financial transparency, which includes partnership in financial planning, openness, and avoiding secrecy, is associated with increased marital satisfaction (Baek, Chenail, & Neymotin 2024).
b. Gender Differences in Marital Finance
The question of how financial communication and planning relate to marital satisfaction is further complicated by gender differences. These gender differences have been observed in each major construct under study. For example, females generally show less satisfaction in marriage than men (Jackson et al. 2014; Schumm, Webb, & Bollman 1998). Also, the genders differ in financial means, with unmarried females having a harder time paying their bills (Theodos et al. 2014). Communication-focused marital interventions predominantly help females rather than males (Javadivala et al. 2021).
The reasons why men and women vary in financial outcomes are a complex question. The genders tend to differ in financial knowledge and education. Broadly, females tend to show lower financial literacy than males, especially in personal investment knowledge (Volpe, Chen, & Pavlicko 1996). Such differences hold when controlling for most demographics, as well as investment experience (Chen & Volpe, 2002), but not education. Differences can be observed in children as young as 11 or 12 years old, reflected by the parents’ influence on the simple choice to spend or save money (Agnew, Maras, & Moon, 2018). Financial socialisation is more complicated than simply education. Parents’ financial behaviours, more than their direct teachings, are associated with their kids’ financial behaviours (Pahlevan Sharif, Ahadzadeh, & Turner, 2020). Attitudes and “financial scripts” are passed down through families. Males, for example, are more likely to tie their self-worth to their wealth (Todd & Lim, 2025).
c. Financial Roles by Gender
Another key mechanism through which communication impacts a marriage is that open communication leads to better-defined financial roles, which leads to a better quality of the marriage (McCoy et al. 2021). Historically, gender roles in finance were starkly different, with husbands as the presumed breadwinners and wives as the homemakers (Eagly 2013). While financial roles are not so clearly distinct in modern times, these historical expectations can still impact both financial behaviour and well-being. Deviating from previous gender roles, financial literacy, and decision making depend more on income, education, and age (Bertocchi, Brunetti, & Torricelli 2014; Fonseca et al. 2012).
Financial outcomes and well-being can be explained, in part, by the balance of power within the couple. Couples with more equitable allocations of relational power report less conflict and greater satisfaction than couples in unbalanced relationships (Lebaron-Black et al. 2024). A partner's satisfaction with their financial role, along with shared financial goals and values, is a better predictor of marital satisfaction than financial role (Archuleta, Grable, & Britt 2013). Relational power and clearly defined financial roles predict marital conflict. When partners feel the power within their relationship is imbalanced, they may sense more combativeness from their partners. For example, one partner may feel that the other discredits her or his opinions. Healthy financial management can decrease both feelings of imbalance and aggression (Li et al 2023). One key to helping families create strong, deliberate financial partnerships is defining the financial roles each partner will fill. It is important that couples communicate to define each partner's role. Partnerships with more clearly defined financial roles and less financial boundary ambiguity show improved quality of the marriage in military families (McCoy et al. 2021).
d. Directionality of the Communication-Quality Relationship
As a research topic, the relationships between financial planning behaviours, communication, and marital outcomes are complex. Couples and Finance Theory describes how these elements make up a sophisticated ecosystem with each variable acting as a predictor and outcome of the others, along with couple and individual characteristics (Archuleta 2013). These key variables are intertwined, and their impacts on each other are often bidirectional. Poor communication can lead to poorly coordinated financial planning, which can decrease marital satisfaction, leading to worse communication. In one test, a husband's marital satisfaction predicts his financial communication better than the inverse, and wives’ financial behaviours better predict their communication (Saxey et al. 2023).
Focusing on the path from financial stress to marital satisfaction, a key research question is about the nature of communication in explaining these outcomes. Does communication moderate or mediate the impact of strain on satisfaction? Previous literature shows evidence of both. Financial communication moderates the relationship between financial stress for both partners and a husband's perceptions of marital quality (but not the wife's perception) (Kelley, LeBaron, & Hill 2018). Likewise, dyadic coping moderates the relationship between financial strain and marital satisfaction. Communication is one of four facets measured in dyadic coping (Novianti et al. 2024). When accounting for financial values, the relationship is mediated. Similarity of financial values predicts marital satisfaction and stability and is mediated by financial communication (LeBaron-Black et al. 2023).
III. The Current Study
To this end, we examine the role of financial transparency, a measure of coordinated and shared financial management, on financial well-being. Specifically, this is the first analysis to examine how gender and dyadic interactions separated by gender moderate the relationship between financial transparency and psychological reactions. Other studies examining communication tend to look at it as a broad concept, focusing on the frequency, level of positivity and agreeableness, and/or how satisfactory it is. Financial transparency, as seen through the lens of couple interactions, is an important vehicle to examine how financial communication affects each gender's perception of themselves, their partner, and their marriage. Our goal is to determine how females differ from males in their openness and honesty when discussing finances and the impacts of such communication, as well as in their reactions to their partner's behaviours and perceptions.
a. Conceptual Framework
Financial health and marital well-being are deeply intertwined in the lives of married couples (Archuleta, 2013). As relevant to our analysis, a couple's communications regarding their finances serve as a key driver in how members of the couple respond to financial strain and how this financial strain ultimately impacts the partners’ level of relationship satisfaction. New studies show that financial transparency, defined as honest and open communication between partners, directly impacts the partners’ satisfaction with their partnership (Koochel et al. 2020). However, there are marked gender differences in how partners experience satisfaction within a marriage, how the genders communicate within a partnership, and how partners are impacted by the communication of finances (Jackson et al. 2014; Javadivala et al. 2021). In particular, females tend to show lower marital satisfaction and are more impacted by marital communication.
The current analysis examines gender differences in how financial transparency and financial strain impact the well-being of married individuals.
According to couples and finance theory, the characteristics of the relationship should be accounted for to fully assess this relationship between communication, pressure, and financial anxiety (Archuleta 2013).
Similarly, the impact of financial strain on well-being is likely moderated by a couple's level of financial resources and perceived financial stability. Previous literature shows that socioeconomic status (SES) impacts when and how couples make impactful decisions like cohabitating, reproducing, and separating (Karney 2021). Improvements in a couple's finances also improve other social and emotional outcomes for the individuals in the couple, with more affluent families showing higher levels of relationship confidence and openness with one another (Agnew & Sotardi 2025). Interestingly, directional effects vary by gender, with lower affluence more impactful at undermining women's financial satisfaction and higher affluence more strongly improving men's financial satisfaction (Fan & Babiarz 2019).
Furthermore, assessing the disparate impacts of transparency between couples is complicated by variations in each couple's financial contributions and financial management roles. Couple and finances theory (CFT) determines that these differences in financial roles can substantially impact marital satisfaction (Archuleta 2013). Discrepancies in relational power help explain why partners behave and react differently to their financial situation (LeBaron-Black et al. 2024). Females’ increased dissatisfaction can be explained by their relative lack of financial power (Wanic & Kulik 2011). Since recent history has found females taking on an increasingly greater financial role (Fry et al. 2023), it has been observed that marriages in which the female earns more than her male partner experience a higher likelihood of ending in dissolution (Ferrari, Solaz, & Vitali 2024). Our premise is that males in families with this type of role reversal, compared with the traditional situation, may experience greater relationship uncertainty when financial information is not readily available.
Finally, it is established that balanced relational power is associated with increased marital stability (Conroy et al. 2016). We question whether partners are cognizant of their partner's beliefs about their relationship dynamics. Marital expectations, as well as the presence of financial arguments, predict both relationship satisfaction and quality (Dew, Britt, & Hutson 2012). Both partners show more confidence in the husband's financial decision-making, even when the wife earns more (Alsemgeest & Grobbelaar 2015). If the partners are indeed actively disclosing their financial behaviours and sharing in the financial planning, we would expect their partners to agree on how openly they communicate.
b. Hypotheses
In keeping with the literature review and conceptual framework that we have established, we posit the following:
H1a. Within a marriage, financial transparency and financial strain impact the financial anxiety of females more than that of males.
H1b. Couples in better (more satisfactory, longer) relationships will have increased transparency and decreased anxiety.
H2a. Perceived socioeconomic status, as measured by both income and education, is strongly tied to well-being. We expect stronger effects for the female partner.
H2b. Males who are not primary financial decision-makers or primary breadwinners show a greater correlation between financial transparency and marital well-being.
H3. Partners will slightly underpredict their partner's self-reported transparency on the same questions. Female predictions will understate male self-reports, and males will underpredict female self-reports.
IV. Method
a. Participants/Sample
We recruited participants for our study via email solicitations to faculty and staff at three North American universities. Over two months, identical emails were sent to participants via official college mailing lists. Our analysis was limited to couples in either marital or cohabiting relationships lasting a minimum of five years to ensure couples were together long enough to merge their finances. For context, one survey suggests couples are together 4.9 years on average before marrying (Salaky 2018). Both the initial respondent and their relationship partner were asked to respond to the Qualtrics survey questionnaire, and their responses were linked by a unique identifier code provided by the first partner at the end of his or her survey. This identifier was supplied by the second member of the couple before he or she was provided with their survey questionnaire. Each participant received an identical survey, except for the identifier code restriction, and was provided with a $25 Amazon gift card code after both partners in the couple had completed their surveys. No individually identifying information was requested or provided, and the only direct point of contact with the researcher was an anonymous email address provided by participants for the purpose of receiving their Amazon claim code.
b. Procedure
Our survey started with a filter question to confirm that participants met the participation criteria, which were that they were currently married or cohabiting for a minimum of five years. Following these pre-screening questions, respondents were asked to provide additional details on the number of long-term romantic partners (defined as five years or longer). Next, they provided information about their financial role within their partnership, including whether the respondent or their partner served as the primary breadwinner and the primary financial decision-maker in the family.
Respondents then completed a four-item section detailing their relationship satisfaction. Respondents then rated their confidence in their financial situation and outlined whether their savings were considered “adequate.” Savings questions included three binary choices for whether the respondent and their partner had contributed to emergency funds, children's college education, or savings for retirement.
Respondents then proceeded to complete three primary scales, including the financial transparency scale (FTS) (Koochel et al. 2020), financial strain, and financial anxiety. For details, see the Measures Section. The survey finished with questions regarding net worth and savings. They concluded by answering demographic questions, including questions about their and their family's socioeconomic status and education.
Our study was judged exempt by the Nova Southeastern University IRB (No. 2019-71-NSU).
c. Measures
i. Independent Variables
We employed the FTS as constructed in Koochel et al. (2020). This survey includes 25 seven-option items, ranging from 1 (never) to 7 (always), used to measure the frequency with which an individual engages in certain financial planning behaviours with their partner. The original FTS scale consisted of five-option items, which we expanded to seven-option items to make them more sensitive using a common frequency response scale. Functionally, the FTS includes three subscales. First is the partnership subscale, which consists of 18 items describing the frequency with which individuals engage in financial discussions, make financial plans and goals, and review existing financial plans—some of which include keeping records about debts, expenses, and budgets. The second part is the secrecy subscale, which consists of three items indicating how often individuals in the partnership actively lie or keep secrets regarding their financial information or activities. Finally, the disclosure subscale consists of four items describing the frequency with which a partner discloses her or his financial activity, like earnings, bonuses, and spending, as well as how often he or she trusts his or her partner.
We examined how respondents view and react to their financial situation using items adapted from the National Financial Capability Study (NFCS) state-by-state survey (FINRA, 2018), a triennial survey to understand US adults’ financial behaviours and attitudes. Our measure of financial strain includes three seven-option items designed to assess how people perceive their financial situation. Item content covers concerns that their money wouldn’t last into the future, that they were “just getting by”, and their ability to get what they want in life. These items together comprise part 1 of the Abbreviated CFPB Financial Well-Being Scale (CFPB, 2015). The reliability of this short three-item scale was considered acceptable, with α = 0.67 and ω = 0.72. We tested the validity using the correlation with their standardised net worth, r = −0.46, and their five-year change in net worth, r = −0.29, as well as with their point-biserial correlation with having three months’ emergency funds available, r = 0.42, and having calculated their retirement needs, r = 0.30.
ii. Dependent Variables
Participants also rated how their finances made them feel using three other seven-option NFCS items. This measure of financial anxiety focused on their concerns about retirement, anxiety when thinking about finances, and stress when discussing finances. This financial anxiety is distinct from financial strain (r = 0.53) because it focuses on psychological distress due to finances. Together, this scale has good reliability, α = 0.78, ω = 0.80. We examined its validity using the correlation with their standardised net worth, r = −0.44, as well as Spearman correlations with the belief that their money won’t last (7-option), r = 0.25, and with confidence in meeting financial goals, r = −0.14.
We combined four questions about relationship satisfaction as both a potential predictor and an outcome variable. We asked about happiness in the relationship on a nine-option item to capture the sensitivity of this question. We included three additional seven-option items about how often things are going well, how often they have disagreements, and how likely the couple will be together in five years. Due to the differences in item scales, we rescaled each item from 0 to 1 before averaging these four items to create an aggregate relationship satisfaction scale.
iii. Control Variables
We collected participants’ net worth in open-ended numeric response formats, indicating both current levels and change over five years. Here, their investment portfolio was broken down into real estate, retirement, and non-retirement funds.
Financial position included questions regarding whether the respondent or their partner served as the primary breadwinner and the primary financial decision-maker in the family, using three options for each role: “I am,” “my partner is,” or “neither is.”
Additional demographic characteristics were collected, including age, sex, number of children in their household, racial identification by five pre-specified categories or “other,” indicators for nation of birth (United States vs elsewhere, and if elsewhere, whether or not their parents are US citizens), and educational attainment. Beyond typical demographics, participants also described the socio-economic class of their upbringing across seven categories ranging from “very low income, struggling, in poverty” to “extremely well off, top 1%.” To get a complete picture of their socioeconomic status, we asked about their own, their partner's, and their parents’ educational attainment on eight categories from “less than high school” to “PhD, JD, LLM, MD, OD.” The bat-and-ball problem concluded the final portion of the survey and served as a measure of cognitive reflexivity (Frederick, 2005).
d. Data Analysis
We conducted the data analysis using R and RStudio. We only included couples’ responses when both partners fully completed the survey, and we only included heterosexual couples to allow for the sex stratification that is key to this analysis to analyse gender differences. We handled missing data by removing a couple if either partner was missing more than one response.
Starting with a correlation analysis, we determined the Pearson correlations for continuous variables, the Spearman rank order correlations if one ordinal item was included, the polychoric value between two ordinal items, and point-biserial correlations to correlate binary and continuous variables. We treated the three primary scales, FTS, financial strain, and financial anxiety, as continuous measures, as they were averages across multiple Likert-type items. We used binary coding of the financial roles, being the primary breadwinner and primary financial decision-maker, reflecting whether the respondent took on each role (“I am”), to simplify the analyses. We combined the four marital satisfaction items into one average score to avoid multicollinearity, as described above.
We ran two sets of regression models. Within each set, we ran a separate model for each sex category. The first was our baseline model that included financial transparency and financial strain as predictors of financial anxiety. The second set of models also included our control variables. Net worth was standardised before inclusion as a predictor, so that large network values would not overly influence our regression models. We dummy-coded financial roles, financial breadwinner, and primary decision-maker (1 = claims primary role, 0 = does not claim this primary role). Our marital satisfaction items were included as one average score. We included relationship length as a continuous predictor but omitted age due to potential multicollinearity with it. We also included the socioeconomic status of each respondent's upbringing (a seven-option ordinal predictor) and the highest educational level attained (an eight-option ordinal predictor).
Our multiple regression analyses were augmented with a bootstrapping procedure using 5,000 resamples to help account for potential estimation bias due to limited sample size. The model coefficients displayed are the means from all bootstrap iterations. The 95% confidence interval reflects the inner 95% of output coefficients. Akaike Information Criterion (AIC) and Bayesian Information Criterion (BIC) values were reported to describe the fit of the models to penalise model complexity and to avoid overfitting (Kuha 2004).
Finally, we compared the responses of a subset of items (seven from the FTS, one about financial strain, and one about financial anxiety) where we obtained respondents’ expectations about how their partners would respond to the same items. Due to the ordinal nature of these single Likert-type items, we used polychoric correlations and a Wilcoxon signed-rank test to examine differences between each partner prediction and the matching partner's response.
V. Results
A total of 146 individuals completed our survey. Of these, 114 respondents, forming 57 couples, were identified for use in the analysis based on matching completion codes. One other couple was removed from the sample due to incomplete responses. In the text that follows, we discuss overall results, with gender-stratified demographics additionally presented in Table 1. The individuals in the sample were, on average, 47.5 years old (SD=13.0), primarily identified as white (62.0%), and generally matched with their partner on racial identification (83.3%). Approximately half of the individuals in our analysis sample were born in the United States (48.1%), and the majority matched with their partner regarding national origin (85.2%). Finally, most couples were childless (55.6%), with the others reporting between 1 and 3 children, with only 9.3% stating that they had three children at home. The respondents in our sample were highly educated, with the majority (90.7%) holding at least a bachelor's degree, with the modal response (N=50) of holding an advanced degree (PhD, JD, LLM, MD, DO).
Table 1.
Individual and partnership demographics by gender
| Variable | Female | Male | ||
|---|---|---|---|---|
| mean | sd | mean | sd | |
| Individual Characteristics | ||||
| N | 54 | 54 | ||
| Age (years) | 46.13 | 12.38 | 48.78 | 13.55 |
| Race (% White) | 59.3% | 64.8% | ||
| Matched on Race | 83.3% | |||
| Nationality (% U.S. born) | 50.0% | 46.3% | ||
| Matched on Nationality | 85.2% | |||
| Relationship Characteristics | ||||
| Kids (count) | 0.76 | sd=1.01 | ||
| Relationship Length (years) | 19.89 | 11.15 | 19.78 | 11.05 |
| Previous Partners | 0.35 | 0.59 | 0.43 | 0.77 |
We employed several additional demographic questions focused on the structure and length of their relationship. We found that 47 of the couples were married, eight had been cohabiting for at least five years, and one couple disagreed on whether they were married or cohabiting. Two couples were in same-sex (female) relationships, while the remaining 55 couples were in heterosexual relationships. The gender stratification portion of our analysis proceeded with the reduced sample of heterosexual couples. The average relationship length, employing the mean over both individual responses from each couple, was 20.7 years (SD =11.3), with most couples close in their estimation of relationship length. Specifically, responses for one couple differed by three years, two couples differed by two years, and the remaining couples agreed, or were within a one-year difference in their responses. Most couples had no previous long-term partners (68.5%), 24.1% had one previous partner, 5.6% had two previous partners, and 1.9% had three previous relationships. A strong majority (91.7%) thought they were likely or very likely to still be together in five years.
a. Gender Stratification
Respondents differed by gender in their degree of financial anxiety and in their relationship satisfaction and expectations. A matched-pairs t-test indicated that, on a nine-point scale, female satisfaction levels [mean = 7.70, SD = 1.38] were significantly lower [t(53) = −3.60, p < 0.01] than those of their male counterparts [8.22, SD = 0.96]. While females exhibited lower levels of aggregate satisfaction [0.81, SD=0.12] than males [0.83, SD=0.10], and greater levels of anxiety [mean = 4.27, SD = 1.52] than males [3.90, SD = 1.66], these differences just missed statistical significance [t(53) = 1.87, p = 0.07; t(53) = 1.64, p = 0.11, respectively].
Females and males displayed fewer discernible differences in their financial beliefs and behaviours. Specifically, males reported slightly more transparency, but not significantly [mean= 4.81, SD = 0.91], as compared with females [mean=4.73, SD = 0.97], and both sexes showed similar levels of financial strain [Females: mean = 3.11, SD = 1.26; Males: mean= 3.06, SD = 1.04]. Importantly, the pool of females was more variable in both financial transparency and financial strain.
Breaking down FTS by gender, there were strong associations between relationship characteristics and transparency, but not between socioeconomic status (SES) and transparency. Each gender had a strong correlation between transparency and self-reported relationship satisfaction (r = 0.29 vs 0.28 for females and males). Females, however, showed moderate relationships between transparency and relationship length, r = 0.21, while males did not, r = 0.05. Similarly, female transparency was moderately related to education, r = 0.20, but not for males, r = 0.04 and neither showed strong relationships with net worth, r = 0.11 vs −0.06 for females and males, respectively.
We next considered the interrelationships between financial transparency, financial strain, and anxiety. Our correlation matrix revealed a stronger correlation between financial strain and anxiety than between strain and transparency. Moreover, the relationship between strain and anxiety was stronger for females (R=0.67) than for males (R=0.39). We also found a notable gender disparity in the relationship between transparency and well-being that was not present in the relationship between strain and anxiety. While females showed a moderate correlation between transparency and anxiety (R = −0.26), there was no discernible relationship for males (R = .011).
We wanted to know if it is possible to predict each partner's degree of psychological distress. We began by considering how both financial transparency and financial strain predicted anxiety. Gender-stratified versions of these models are presented in Table 2. For both genders, we found that financial strain was a significant predictor of anxiety, while financial transparency showed no significant relationship with anxiety. We additionally determined that the FTS varied inversely with levels of anxiety. Therefore, greater transparency was associated with less anxiety. Both the Akaike Information Criterion (AIC) and the Bayesian Information Criterion (BIC) indicated that model fit was superior for the female than for the male regressions.
Table 2.
Primary regression models to predict financial anxiety.
| Female | Male | |||||||
|---|---|---|---|---|---|---|---|---|
| Coef | SE | Boot LB | Boot UB | Coef | SE | Boot LB | Boot UB | |
| Intercept | 2.78 | 0.97 | 0.86 | 4.78 | 1.36 | 1.41 | −1.25 | 4.04 |
| Strain | 0.76 | 0.13 | 0.57 | 0.98 | 0.63 | 0.21 | 0.27 | 0.96 |
| FTS | −0.19 | 0.17 | −0.54 | 0.13 | 0.12 | 0.24 | −0.39 | 0.63 |
| AIC | 172.57 | 205.59 | ||||||
| BIC | 180.52 | 213.54 | ||||||
[i] Note: We ran separate models for both sex categories. Each regression model was run with 1,000 bootstrap samples. The model coefficients displayed are the means from all bootstrap iterations. The 95% confidence interval reflects the inner 95% of output coefficients. Akaike Information Criterion (AIC) and Bayesian Information Criterion (BIC) are shown to describe the fit of the models.
In the next step, we augmented our regression analysis with additional predictor right-hand-side values for (1) the respondents’ financial situation, both current finances (self-reported standardized net worth), and the respondent's perception of their social class as a child, (2) satisfaction with their relationship, based on the average of four Likert-type items rescaled to be between zero and one, (3) financial role, which were dummy coded for either being the primary breadwinner and/or the primary financial decision-maker, (4) length of the relationship in years, (5) self-reported socioeconomic class in which he or she grew up, and (6) educational attainment. While age was correlated with anxiety for both females (r = −0.12) and for males (r = −0.27), strong correlations between anxiety and both relationship length (r = 0.78) and net worth (r = 0.58) that were also in the regression indicated that age should be suppressed to avoid strong multicollinearity.
The results in Table 3 display a substantially better fit for the female model compared to the male model. For the male model, financial strain and net worth were the only meaningful predictors, and only significant at the 0.10 level. In contrast, multiple predictors describing both the financial situation and role were meaningful predictors of anxiety in the female model.
Table 3.
Regression models to predict financial anxiety using additional predictors.
| Female | Male | |||||||
|---|---|---|---|---|---|---|---|---|
| Coef | SE | Boot LB | Boot UB | Coef | SE | Boot LB | Boot UB | |
| Intercept | 1.61 | 1.73 | −1.73 | 5.40 | 0.14 | 2.82 | −5.58 | 6.76 |
| Strain | 0.60 | 0.14 | 0.30 | 0.85 | 0.50 | 0.27 | −0.06 | 1.03 |
| FTS | −0.27 | 0.16 | −0.71 | 0.08 | 0.01 | 0.25 | −0.53 | 0.52 |
| zWorth | −0.38 | 0.21 | −0.89 | 0.00 | −0.51 | 0.29 | −1.16 | 0.13 |
| Breadwinner | 0.69 | 0.35 | 0.03 | 1.35 | −0.11 | 0.52 | −1.25 | 1.02 |
| Financial DM | −0.97 | 0.36 | −1.74 | −0.23 | 0.09 | 0.49 | −0.87 | 1.12 |
| Quality | −0.55 | 1.50 | −3.57 | 2.57 | 1.70 | 2.43 | −3.91 | 5.67 |
| Length | 0.02 | 0.02 | −0.01 | 0.06 | −0.02 | 0.02 | −0.07 | 0.04 |
| Upbringing | 0.13 | 0.10 | −0.10 | 0.36 | 0.01 | 0.15 | −0.29 | 0.34 |
| Education | 0.26 | 0.20 | −0.16 | 0.60 | 0.20 | 0.17 | −0.16 | 0.59 |
| AIC | 169.68 | 211.14 | ||||||
| BIC | 191.56 | 233.02 | ||||||
[i] Note: We ran a separate model for each sex category. Net worth was standardised before inclusion as a predictor. Breadwinner and financial decision maker were dummy-coded (1 = claims primary role, 0 = does not claim this primary role). Four satisfaction items were rescaled to range from 0 to 1 and then averaged. Each regression model was run with 1,000 bootstrap resamples. The model coefficients displayed are the means from all bootstrap iterations. The 95% confidence interval reflects the inner 95% of output coefficients. Akaike Information Criterion (AIC) and Bayesian Information Criterion (BIC) were each reported to describe the fit of the models.
Financial strain significantly increased anxiety, while higher net worth decreased it (at α < 0.1). Notable differences were that financial transparency impeded anxiety (at α < 0.1) and that females’ financial roles significantly impacted their well-being. Female decision-makers were less anxious, while female breadwinners were more anxious.
Interestingly, females’ financial role impacted well-being and relationship satisfaction, but not for males. Specifically, females who served as the primary financial decision-maker had significantly less anxiety, with one full point less well-being (on a seven-point scale), b = −1.02 (SE = 0.31), Similarly, a two-way ANOVA examining differences in relationship satisfaction indicated a significant interaction between gender and primary financial decision-making, F(1,104) = 7.44, p = 0.007. Female decision makers rated their relationships as less satisfactory (mean=0.75, SD = 0.14) than did males (mean=0.85, SD = 0.09), while female non-decision makers rated their relationship quality as similar to their male counterparts (Female mean=0.84, SD = 0.10; Male mean=0.82, SD = 0.11).
In addition, being the primary breadwinner was a significant predictor of anxiety in regression analyses for females and had a moderate-to-strong point-biserial correlation with anxiety (r = 0.43). A two-way ANOVA examining differences in anxiety indicated that gender and serving as the primary breadwinner interacted, with F(1,104) = 4.80 and p = 0.03. Female breadwinners showed significantly greater levels of anxiety (mean=4.83, SD = 1.39) than did males holding the same position (mean=3.70, SD = 1.58). In contrast, female non-breadwinners did not show the same increase in anxiety when compared to males in the same position (Female mean=3.94, SD = 1.45; Male mean=4.03, SD = 1.72). Overall, when females served as the primary financial earner in the partnership, they displayed greater anxiety and less relationship satisfaction.
a. Partner Predictions
The concluding portion of our empirical analysis involved asking individual respondents to predict how their partners would respond to various questions. The goal was to test whether individuals understood if their partners were obfuscating in their responses. The partner prediction analysis included a subset of the main survey questions: seven items from the FTS, one measure of financial strain, and one measure of psychological anxiety. We did not find significant gender variation in the self-reported values of any of the individual items, nor did we find differences between the female self-reports and the male predictions of the female self-reports. The only gendered variation we found in the data involved female predictions of the male self-reported values. Females underpredicted male responses, assuming their male partners would exhibit less transparency than the males claimed they had shown. Our empirical analysis revealed significant differences in spending secrets, lying about spending, and lying about transactions (top row in Fig. 1 and Table 4) using Wilcoxon signed-rank tests. Marginally trusting judgment and disclosing all purchases displayed marginal levels of significance (panels 6 and 7 in Fig. 1, see Table 4). Neither strain (panel 8) nor anxiety items (panel 9) showed any statistical differences. To summarise, on average, males and females reported being equally transparent; however, females still expected their male partners to admit to lower levels of transparency than the males actually reported.
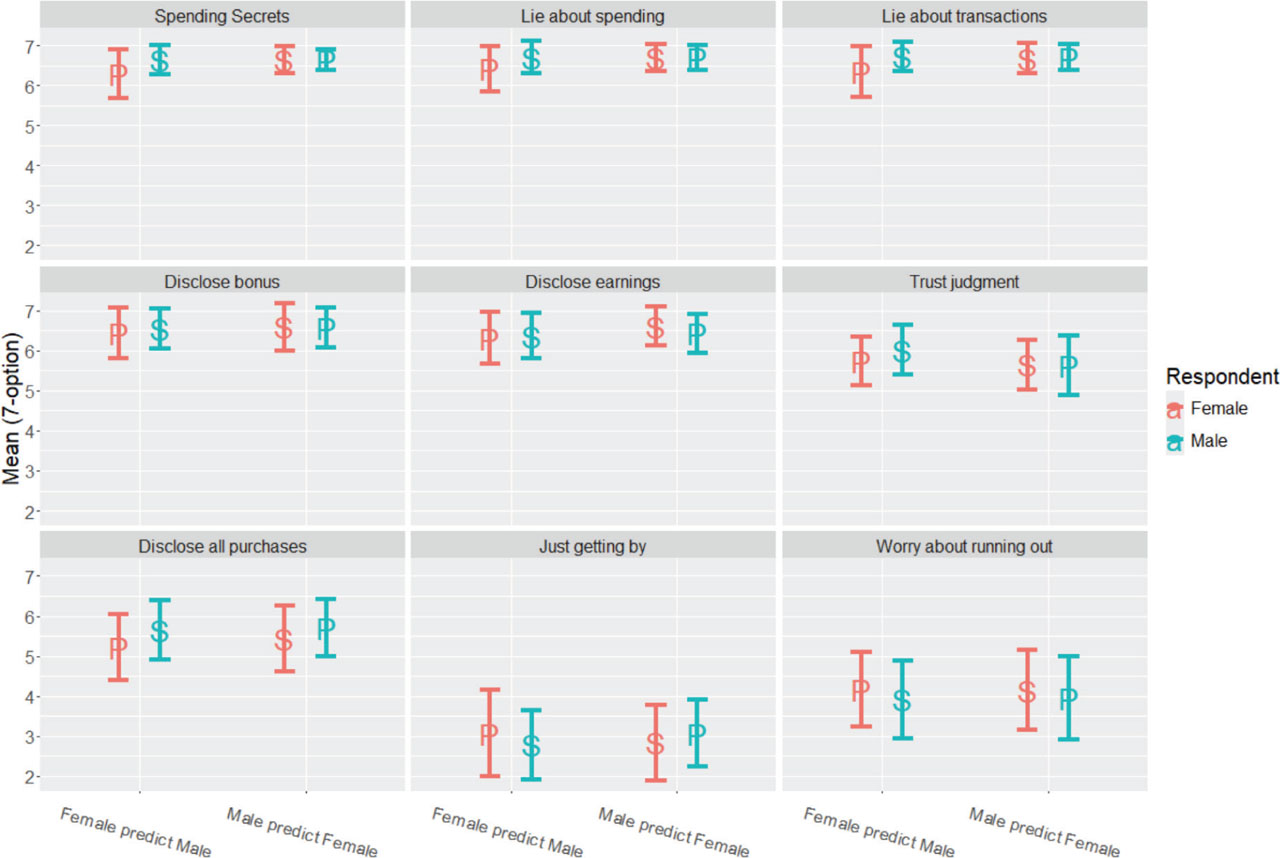
Figure 1.
Predicted vs Self-Reported Responses.
Note: Each panel displays means and standard errors and compares predicted (P) responses to self-reports (S). Female (male) responses are labelled in red (blue). Predicted responses and actual responses are displayed in pairs.
Table 4.
Correlations and Sign Tests
| R | V | p | R | V | p | R | V | p | |
|---|---|---|---|---|---|---|---|---|---|
| Comparison | Spending Secrets | Lie about Spending | Lie about Transactions | ||||||
| self-self | 0.34 | 133.5 | 0.90 | 0.29 | 58.5 | 0.63 | 0.12 | 65.0 | 0.59 |
| female predicts male | 0.55 | 54.5 | 0.02 | 0.74 | 16.5 | 0.01 | 0.66 | 33.5 | 0.01 |
| male predicts female | 0.08 | 88.5 | 0.91 | 0.37 | 59.0 | 0.98 | 0.25 | 77.5 | 0.73 |
| Disclose Bonus | Disclose Earnings | Trust Judgment | |||||||
| self-self | 0.34 | 69.0 | 0.62 | 0.31 | 131.0 | 0.15 | −0.31 | 247.0 | 0.03 |
| female predicts male | 0.37 | 68.0 | 0.70 | 0.72 | 90.0 | 0.86 | 0.12 | 166.5 | 0.06 |
| male predicts female | 0.37 | 58.5 | 0.73 | 0.51 | 114.5 | 0.20 | 0.38 | 287.0 | 0.65 |
| Disclose All Purchases | Just Getting By | Worry about Running Out | |||||||
| self-self | 0.34 | 329.5 | 0.39 | 0.69 | 258.5 | 0.84 | 0.53 | 482.0 | 0.33 |
| female predicts male | 0.44 | 274.0 | 0.06 | 0.67 | 366.0 | 0.24 | 0.53 | 293.0 | 0.83 |
| male predicts female | 0.34 | 297.0 | 0.28 | 0.58 | 315.5 | 0.29 | 0.34 | 373.0 | 0.98 |
[i] Note: Table 4 displays Polychoric correlations (R) and Wilcoxon rank-sign tests (VWilcoxon and p-value) comparing (1) female and male self-reports (self-self), (2) females predicting male responses, and (3) males predicting female responses.
VI. Discussion
The present analysis compared self-reported survey data from each partner to determine how gender mediated the relationship between financial planning, finances, and emotional states. Males and females varied in their perception of both their financial communication and actual finances, as well as in their emotional states. We found that females generally experienced a greater degree of financial stress and a lower level of relationship satisfaction. Also, while female anxiety was predicted by many variables, male anxiety was only moderately predicted by financial strain and net worth. Finally, females in relationships in which they lead—either in decision-making or earnings—were both less satisfied with the relationship and more financially anxious (when they were the breadwinner).
We have found support for H1 in the form of strong differences in female versus male assessments of well-being and relationship satisfaction. In accord with the previous literature on these topics, our results indicated that females experience a greater level of strain and decreased well-being (Robichaud, Dugas, & Conway, 2003; Zlomke & Hahn, 2010) and indicated that they experience a lower level of overall relationship satisfaction (Jackson et al. 2014; Schumm, Webb, & Bollman 1998). For both regression models using financial transparency and financial strain to predict financial anxiety, the models fit the female data better than the male data. Isolating the impact of financial transparency is complicated. For wives, transparency approached significance only when relationship characteristics, financial roles, and SES were accounted for.
Our study is novel in finding that the female in the couple experiences greater variability in her financial transparency and its relationship with well-being. Specifically, both males and females rated their transparency as high. However, males showed considerably less variability in this belief. This greater variability in female beliefs, when paired with higher average ratings of strain and well-being, led to our result of an inverse relationship between transparency and well-being. Unlike males, females who chose higher levels of financial transparency within their partnership experienced less distress. Given that males are typically more financially literate and that boys are financially socialised at a younger age and given more specific “scripts” and goals (Agnew & Cameron-Agnew 2015; Todd & Lim 2025), it is not surprising that females’ financial skills are more variable. Moreover, it is important that couples align on their financial values, since communication explains how aligned values predict marital satisfaction and stability (LeBaron-Black et al. 2023).
Since this study is ultimately interested in how transparency impacts a couple, we also examined expectations about their partners. Each partner answered a subset of the questions about how they felt their partner would respond. We found partial support for H3. Male transparency was perceived by their wives to be lower than reported by the husbands. In contrast, male expectations were statistically no different from their wives’ reports. While partners tend to reflect more confidence in the husband's financial decision-making (Alsemgeest & Grobbelaar 2015), they seem to have the opposite expectations about their communication, with both agreeing that females are the open communicators. Since marital expectations predict relationship satisfaction (Dew, Britt & Huston 2012), female dissatisfaction could be partially explained by their misaligned expectations.
We also found support for H1a. Couples in more satisfactory relationships are more transparent, although satisfaction is not an important indicator of anxiety when transparency and strain are considered. Couples and Finance Theory tells us that communication and satisfaction have a bidirectional relationship (Archuleta, 2013). Here, we see that couples who communicate transparently actively manage their finances, discuss and set (both short-and long-term) goals, and build a partnership to achieve these goals. These transparency traits are among the most important predictors of marital stability and satisfaction, according to CFT (Archuleta, 2013). While CFT describes a complex ecosystem within a marriage, some of the most relevant indicators of a thriving relationship can be measured quickly and directly using the FTS.
We also found broad support for H2a. SES is broadly tied to well-being in that net worth is a good predictor of anxiety, but education is not. But these traits are not where we find gender differences. These patterns are consistent across partners. This further illustrates that the impact of finances on a marriage is greater than simply the state of financial affairs. Strong communication, clear roles, and a strong connection can lead to good psychological outcomes, even under financial stress.
Finally, we found strong support for H2b. Generally, open communication is required to define financial roles through reduced financial boundary ambiguity, which then improves marital quality (McCoy et al. 2021). However, there are significant differences in each gender's role and expectations. Female roles within a marriage have changed over time. Our analysis helps us understand how this change impacts female marital satisfaction. A recent Pew Research Centre report indicated that in the United States in 2022, the likelihood of finding a female breadwinner in any given household has increased threefold, with 16% of households currently having a female breadwinner (Fry et al. 2023). Such households are also associated with greater marital instability and higher rates of dissolution. This idea, termed the “female breadwinner penalty”, indicates that female-led families make less even when controlling for occupation and time worked (Kowalewska & Vitali 2024). This penalty impacts well-being for both partners, who tend to show lower marital satisfaction than those in male-led and balanced families (Kowalewska & Vitali 2024). And the likelihood of dissolution increases with the proportion of the female's financial contribution to the family's finances (Ferrari, Solaz, & Vitali 2024). Our paper fills a gap in the literature by analysing anxiety and relational satisfaction for this group of female breadwinners and finds evidence for the associated penalty. We posit that the decrease in female breadwinners’ financial well-being, along with female decision-makers’ decreased marital satisfaction, extends the female breadwinner penalty.
a. Limitations
Our study's results should be interpreted in light of its limitations. First, our targeted dyadic sampling is both a strength and a weakness. This technique allowed us to obtain both viewpoints within each relationship, but also limited our sample size. To obtain survey responses from both members of a marriage, we used a convenience sample, in which we believe response rates and survey compliance would be appropriately high and bad-faith responses would be low. Specifically, we leveraged college mailing lists to receive more than 100 complete responses from over 50 marital partnerships. While this number of individual responses is considered successful based on typical dyadic recruitment targets, non-dyadic standards would generally consider this response rate to be suboptimal. Furthermore, because we employed a university setting, we acknowledge that generalizability to the larger population of married couples may be limited.
Self-reporting is also an important aspect of our study. While self-reporting allowed for a more detailed view of individual perceptions and emotional states, the lack of response verification prevented us from distinguishing between misreporting and other reasons for differences in responses among members of the partnership. As one example, while we detected some differences between partners in their reported finances, we were unable to determine the reason for these differences. The nature of our survey structure made it impossible to differentiate between separate finances within the couple versus misreporting by at least one partner. As another example, while we detected a pattern of differences in males’ reported levels of transparency and their female partners’ perceptions of these levels of transparency, we have no way of verifying which partner provided the more accurate recollection.
Finally, to achieve our recruitment goals, we aimed for a relatively short survey. We used some items from a large, well-known public goods personal finance dataset (NFCS). This helped ensure that individual items were validated, as they have been used in multiple waves of the NFCS over many years. As a result, some of our key measures, including financial strain and financial anxiety, had relatively short scales. Thus, there is limited information about the breadth and reliability of these item sets. We did find acceptable to good reliability of these scales within this dataset, but ideally would like to know more about them as scales. Moreover, several of our measures are highly related as distinct but overlapping constructs. Correlations are in expected directions within ranges that suggest they are not redundant (not exceeding 0.60).
VII. Implications
We take these results as evidence that females may benefit from being more conscientious about the financial role they play within their marriage, based on the potential effects these roles may have on their emotional well-being. Couples, especially those with young people, or a female breadwinner or already under strain, to communicate about financial planning deliberately and openly. Previous research demonstrated that discussing finances early in a marriage can increase marital quality (Saxey, LeBaron-Black, & Curran 2022). Moreover, couples should aim to improve their financial planning and communication, since they are intertwined with marital quality (Saxey et al. 2023). Planning or communication deficiencies can decrease the other factors, leading to a downward spiral of poor communication, financial planning, and unhappiness. In terms of financial discussions, males should also be aware that their partners’ financial well-being is not necessarily as optimistic as their own, and that their emotional state may be more vulnerable to a lack of financial decision-making ability. Finally, couples with a higher-earning wife should be particularly working on improving their active, open, and transparent communication. We would expect anyone who takes on substantial financial roles with limited literacy to experience anxiety. Couples should be deliberate about the financial roles they take, find shared goals, and set expectations about each partner's role in achieving those goals.
Longer-term, families should consider how they educate and socialise their kids about money, especially when intending to move beyond traditional gender roles. Females’ variability in financial transparency indicates less consistency in their financial acumen. Whether conscious or not, it appears gender still plays a role in teaching children financial skills. As women take on more financial responsibility within families, it is important that girls are prepared to take on financial planning and decision-making roles. If both partners are adequately educated, a couple can balance the responsibilities in a partnership more likely to lead to greater happiness.
Future research could further analyse the mechanisms behind these behavioural patterns. First, a path analysis could shed light on the directionality of these relationships. As CFT suggests, financial planning, financial satisfaction, and marital quality are all interrelated (Archuleta 2013). A bidirectional relationship would be reasonable to hypothesise, potentially showing that financial transparency affects financial anxiety, which in turn affects transparency. It could also be informative to understand if the financial role interacts with transparency and gender. Our dyadic recruitment did not allow us to estimate such a three-way interaction reliably. Finally, given that gender roles have and will continue to change over time, it will be useful to periodically examine how these financial management patterns change over time. As women's earning power becomes more equitable, it stands to reason that their financial socialisation and literacy will even out too.
Acknowledgements
We would like to thank Carolina Poll for outstanding research assistance. All mistakes are our own.