
Figure 1.
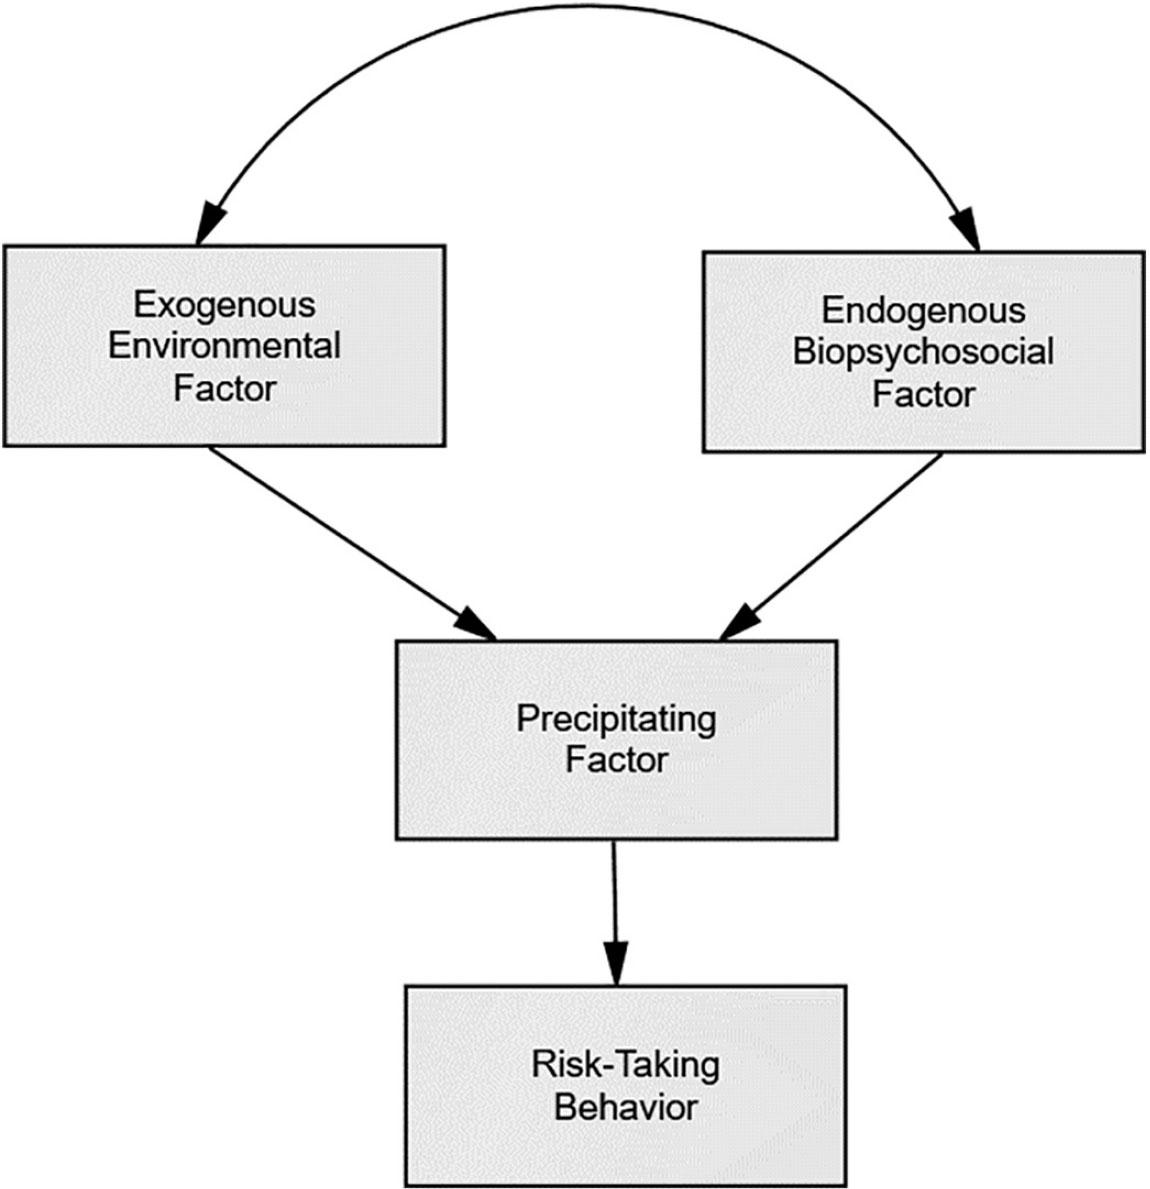
Figure 2.
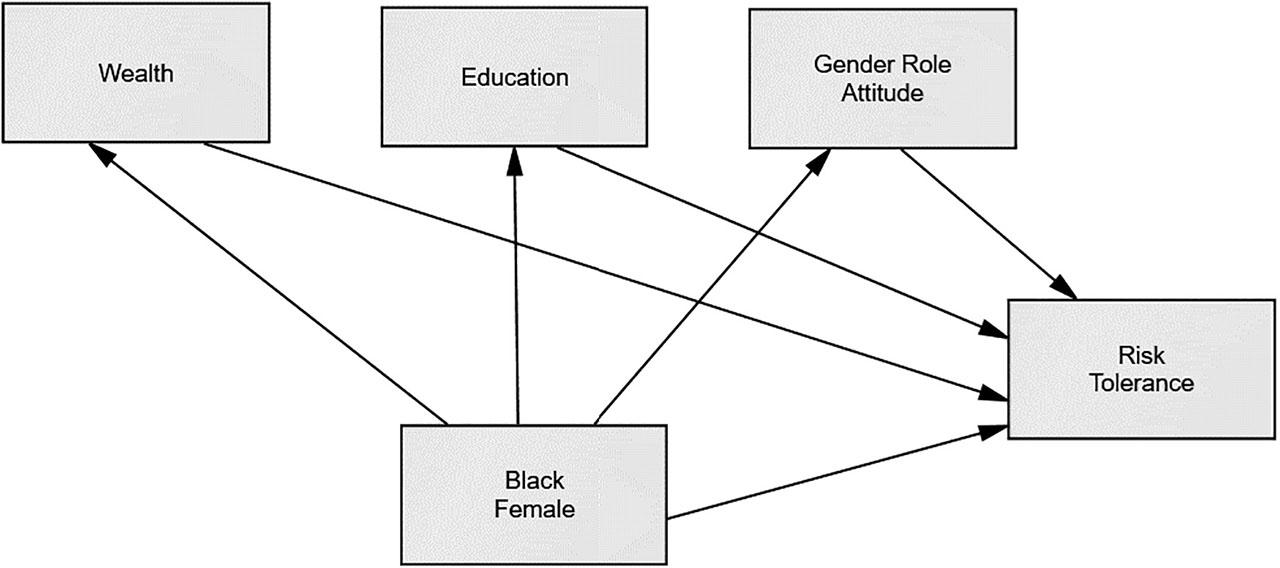
Figure 3.
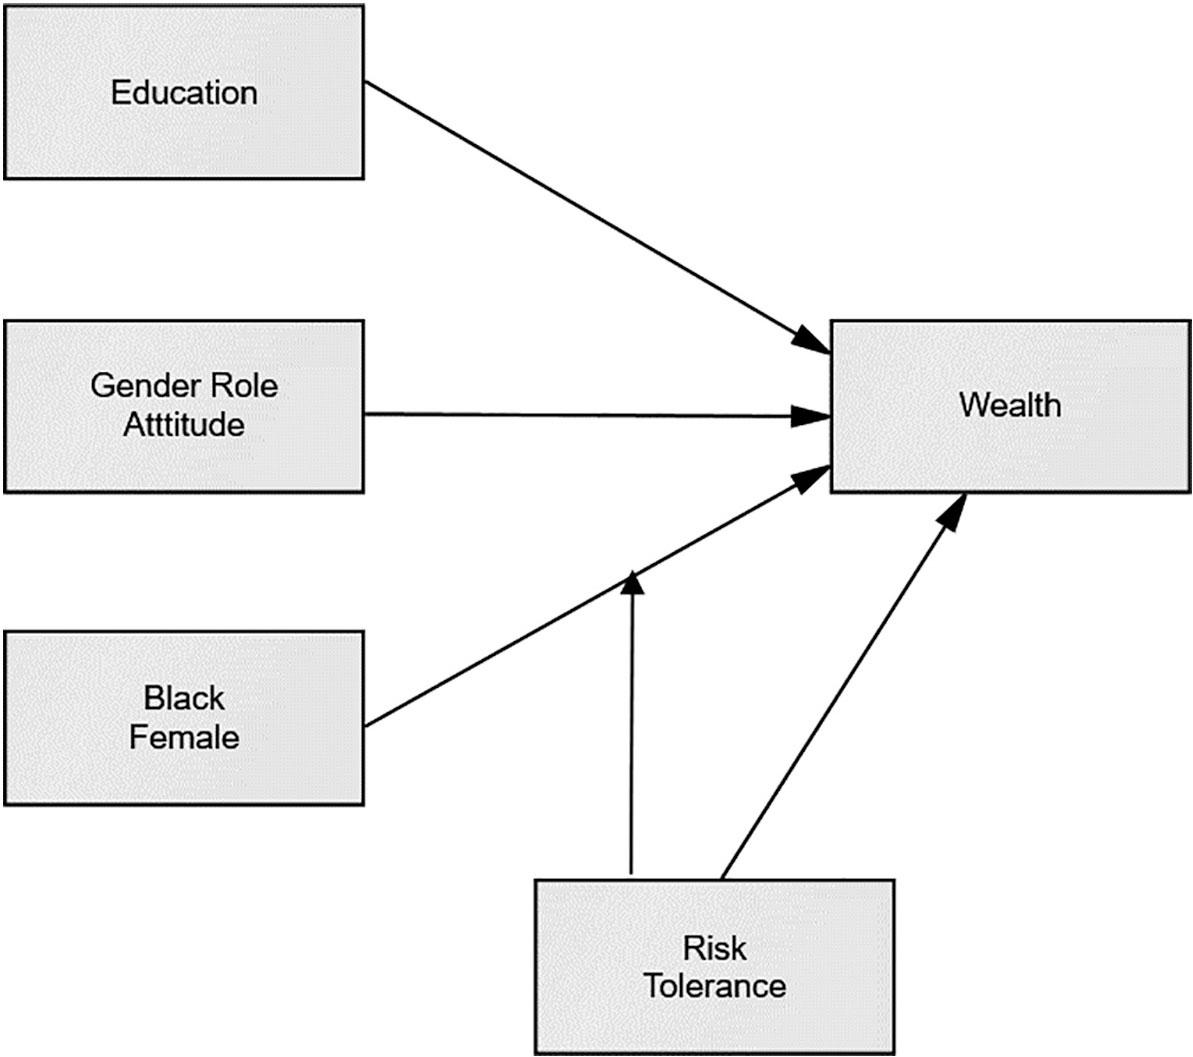
Figure 4.
Figure 5.
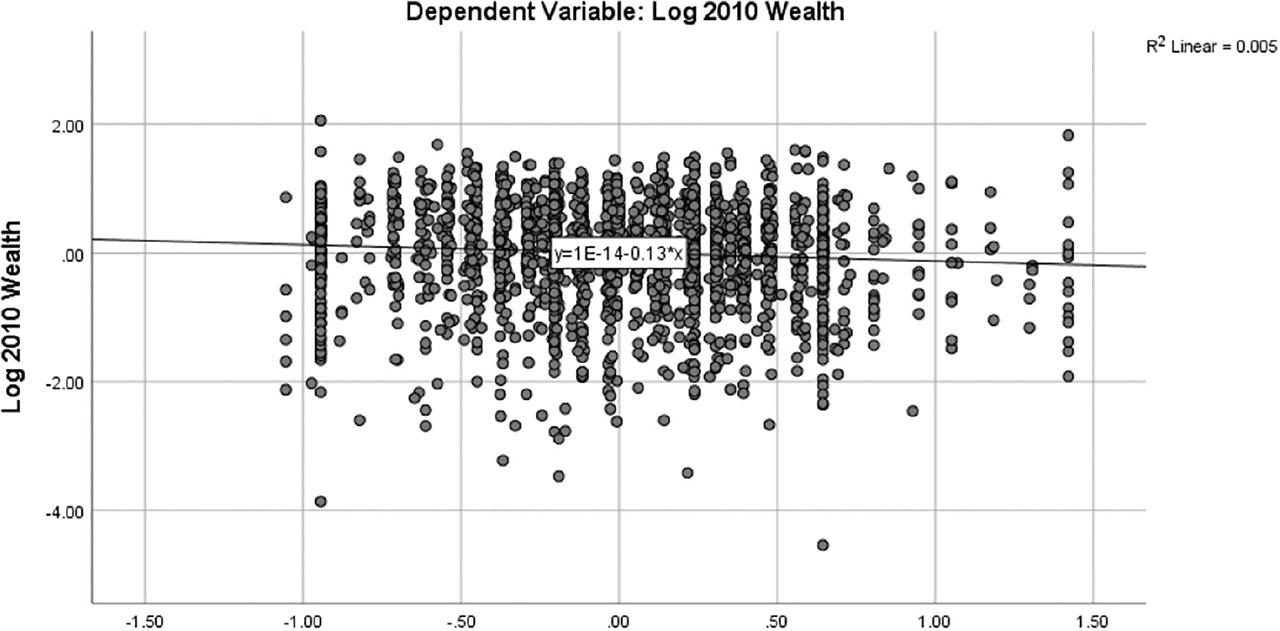
Figure 6.
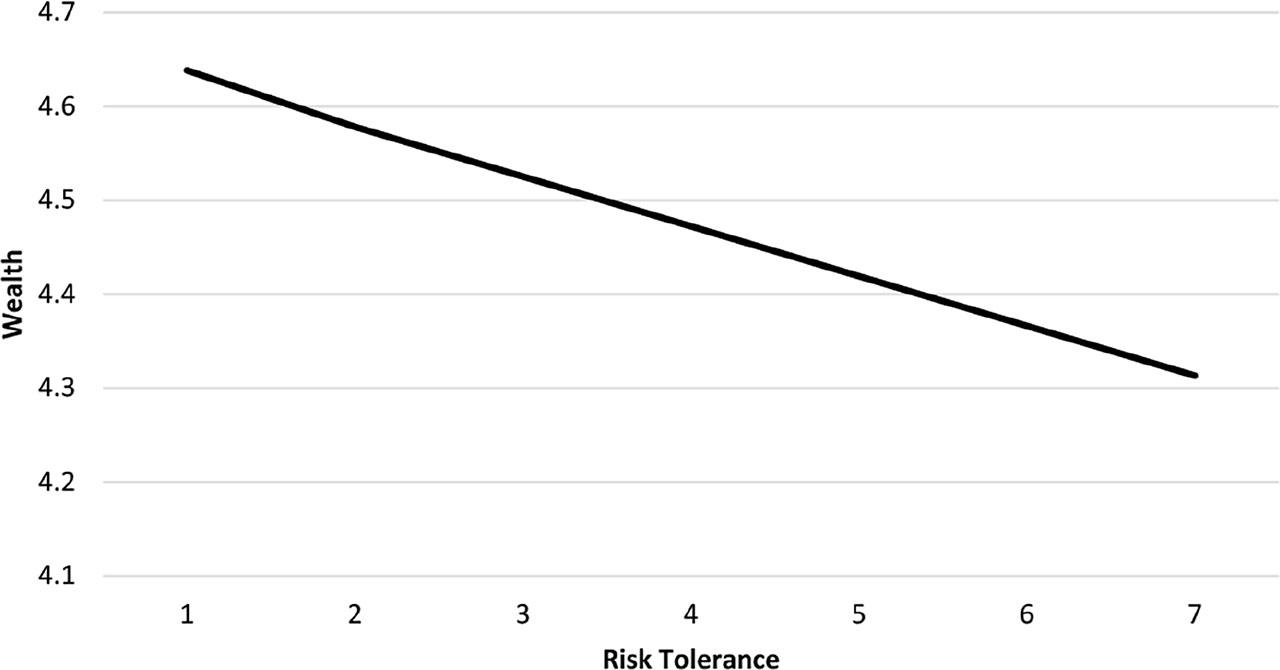
Figure 7.
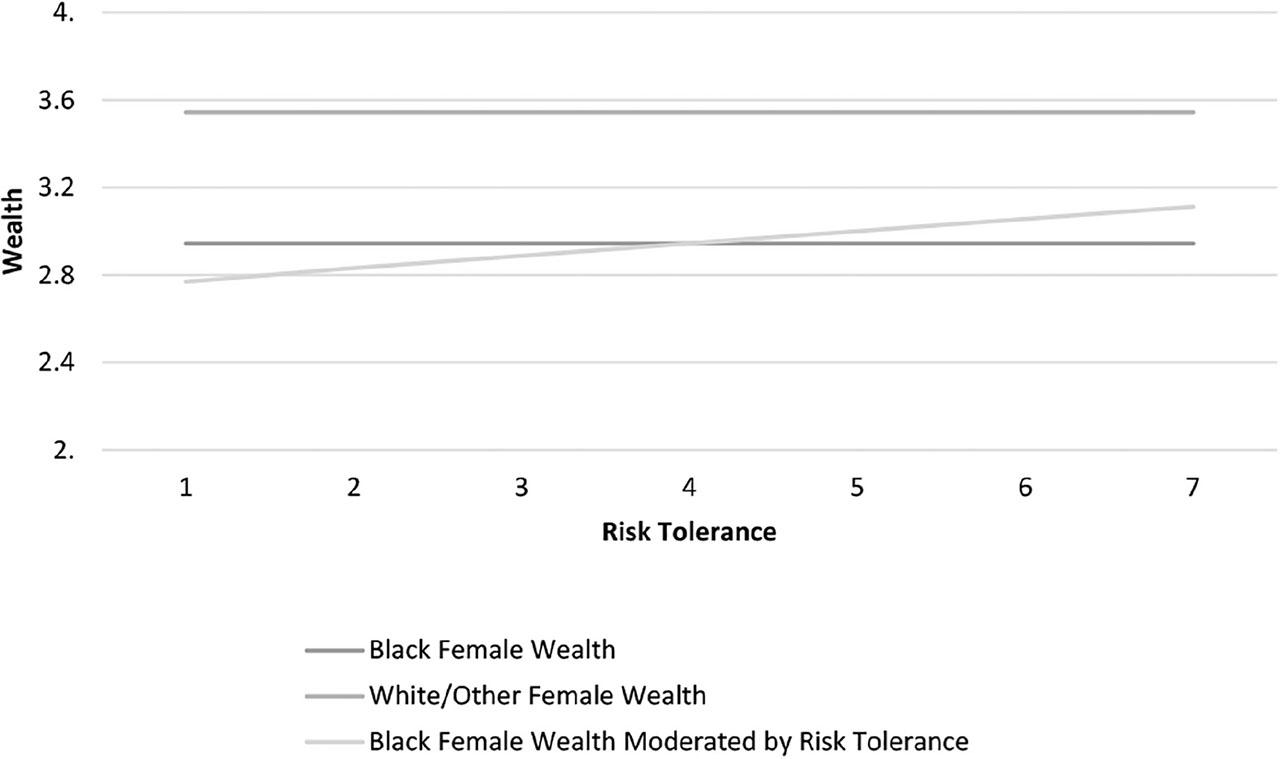
Figure 8.
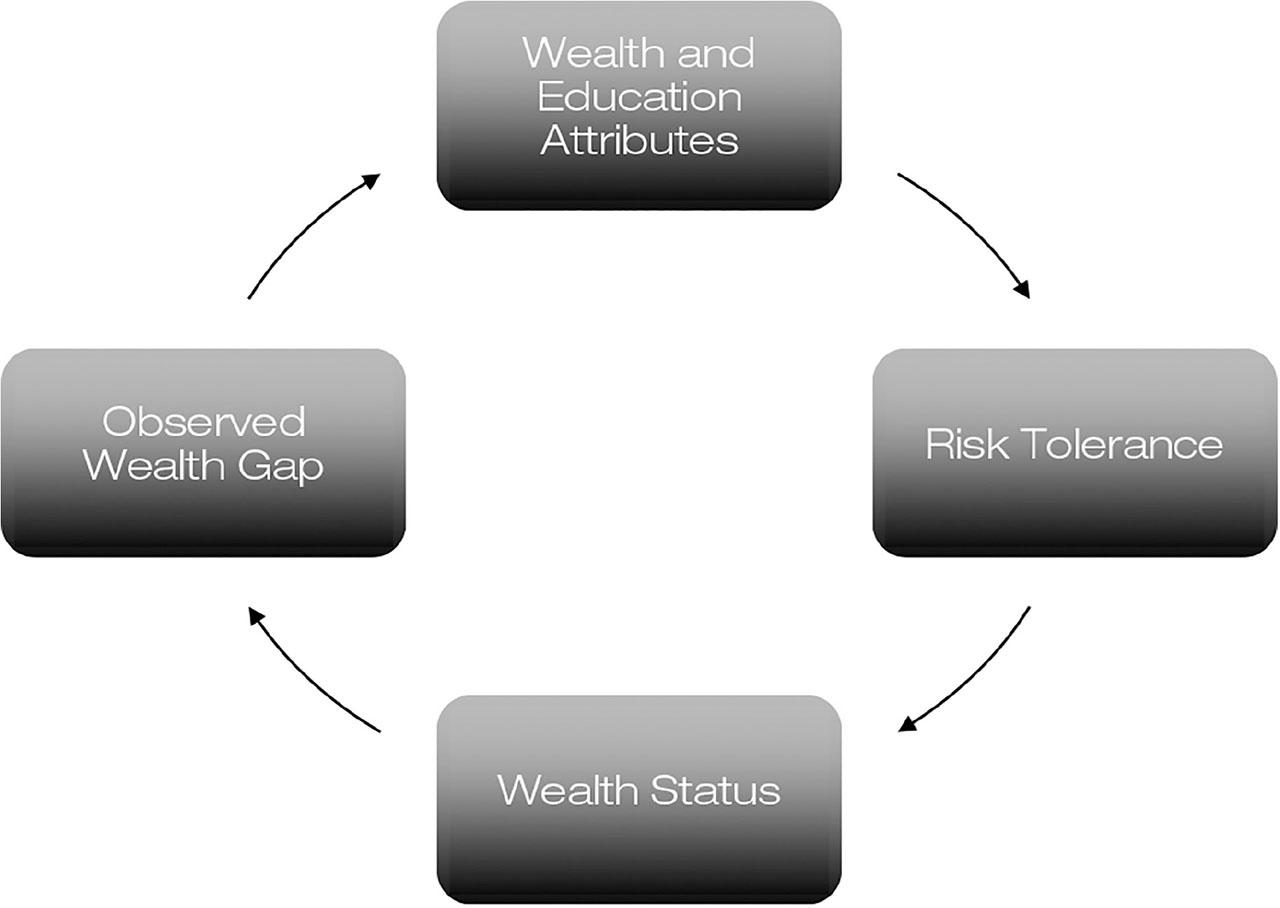
Figure 9.
Mediation Tests of Risk Tolerance as a Function of Being Black Female
| Model | Independent Variable | Dependent Variable | Coefficients | Sig. |
|---|---|---|---|---|
| Wealth | ||||
| 1 | Black Female | Risk Tolerance | .118 | .001 |
| 2 | Black Female | Wealth | −.697 | .001 |
| 3 | Wealth | Risk Tolerance | .086 | .001 |
| 4 | Black Female | Risk Tolerance | .185 | .001 |
| Wealth | .157 | .001 | ||
| Education | ||||
| 1 | Black Female | Risk Tolerance | .118 | .001 |
| 2 | Black Female | Education | −.662 | .001 |
| 3 | Education | Risk Tolerance | .037 | .001 |
| 4 | Black Female | Risk Tolerance | .163 | .001 |
| Education | .048 | .001 | ||
| Gender Role Attitude | ||||
| 1 | Black Female | Risk Tolerance | .118 | .001 |
| 2 | Black Female | Gender Role Attitude | .059 | .107 |
| 3 | Gender Role Attitude | Risk Tolerance | −.030 | .080 |
| 4 | Black Female | Risk Tolerance | .108 | .004 |
| Gender Role Attitude | −.039 | .032 | ||
Estimates of the Relationship between being a Black Female and Risk Tolerance
| Unstandardized Coefficients | Standardized Coefficients | t | Sig. | ||
|---|---|---|---|---|---|
| B | Std. Error | Beta | |||
| (Constant) | −.991 | .162 | −6.118 | .000 | |
| Black Female | .175 | .049 | .089 | 3.596 | .000 |
| Wealth | .104 | .029 | .096 | 3.588 | .000 |
| Education | .031 | .010 | .081 | 3.235 | .001 |
| Gender Role Attitude | −.053 | .022 | −.056 | −2.415 | .016 |
Estimates of the Relationship between being a Black Female and Wealth, Moderated by Risk Tolerance
| Unstandardized Coefficients | Standardized Coefficients | t | Sig. | ||
|---|---|---|---|---|---|
| B | Std. Error | Beta | |||
| (Constant) | 3.544 | .102 | 34.732 | .000 | |
| Black Female (BF) | −.600 | .036 | −.332 | −16.545 | .000 |
| Education | .115 | .007 | .327 | 15.932 | .000 |
| Gender-Role Attitude | −.027 | .018 | −.032 | −1.569 | .117 |
| Risk Tolerance | .112 | .024 | .122 | 4.585 | .000 |
| BF x Risk Tolerance | −.106 | .037 | −.075 | −2.854 | .004 |
Correlation Coefficient Estimates between Driving Risk Tolerance and the Variables of Interest in the Study
| Driving Risk Tolerance | Black Female | Wealth | Risk Tolerance | Gender Role Attitude | Education | |
|---|---|---|---|---|---|---|
| Driving Risk Tolerance | 1.000 | |||||
| Black Female | −.016 | 1.000 | ||||
| Wealth | .020 | −.322** | 1.000 | |||
| Risk Tolerance | .281** | .038** | .075** | 1.000 | ||
| Gender-Role Attitude | −.018 | .032* | −.087** | −.029* | 1.000 | |
| Education | .065** | −.122** | .304** | .092** | −.146** | 1.000 |
Coefficients in the Path Model
| Estimate | Standardized Estimate | S.E. | p | |||
|---|---|---|---|---|---|---|
| Wealth | <--- | Black Female | −.716 | −.373 | .038 | .001 |
| Education | <--- | Black Female | −.773 | −.138 | .096 | .001 |
| Gender-Role Attitude | <--- | Black Female | .081 | .037 | .039 | .037 |
| Risk Tolerance | <--- | Wealth | .092 | .081 | .024 | .001 |
| Risk Tolerance | <--- | Education | .034 | .088 | .006 | .001 |
| Risk Tolerance | <--- | Gender-Role Attitude | −.012 | −.013 | .017 | .459 |
| Risk Tolerance | <--- | Black Female | .228 | .105 | .044 | .001 |
Standardized Indirect Effects
| Black Female | Gender-Role Attitude | Education | Wealth | |
|---|---|---|---|---|
| Gender Role Attitude | .000 | .000 | .000 | .000 |
| Education | .000 | .000 | .000 | .000 |
| Wealth | .000 | .000 | .000 | .000 |
| Risk Tolerance | −.043 | .000 | .000 | .000 |
Correlation Coefficient Estimates Across the Variables of Interest in the Study
| Black Female | Wealth | Risk Tolerance | Gender Role Attitude | Education 2008 | Education 2010 | |
|---|---|---|---|---|---|---|
| Kendall’s Tau-b Correlations | ||||||
| Black Female | 1.000 | |||||
| Wealth | −.322** | 1.000 | ||||
| Risk Tolerance | .038** | .075** | 1.000 | |||
| Gender Role Attitude | .032* | −.087** | −.029* | 1.000 | ||
| Education 2008 | −.122** | .304** | .092** | −.146** | 1.000 | |
| Education 2010 | −.114** | .300** | .092** | −.142** | .864** | 1.000 |
| Spearman’s Correlations | ||||||
| Black Female | 1.000 | |||||
| Wealth | −.395** | 1.000 | ||||
| Risk Tolerance | .046** | .106** | 1.000 | |||
| Gender Role Attitude | .036* | −.119** | −.039* | 1.000 | ||
| Education 2008 | −.137** | .413** | .125** | −.186** | 1.000 | |
| Education 2010 | −.129** | .409** | .124** | −.179** | .917** | 1.000 |
Standardized Direct Effects
| Black Female | Gender-Role Attitude | Education | Wealth | |
|---|---|---|---|---|
| Gender-Role Attitude | .037 | .000 | .000 | .000 |
| Education | −.138 | .000 | .000 | .000 |
| Wealth | −.373 | .000 | .000 | .000 |
| Risk Tolerance | .105 | −.013 | .088 | .081 |
Two-stage Least Squares Analysis Robustness Check of the Moderation Model
| Unstandardized Coefficients | Standardized Coefficients | t | Sig. | ||
|---|---|---|---|---|---|
| B | Std. Error | Beta | |||
| (Constant) | 3.547 | .102 | 34.683 | .000 | |
| Black Female (BF) | −.595 | .036 | −.330 | −16.370 | .000 |
| Education | .115 | .007 | .327 | 15.872 | .000 |
| Gender-Role Attitude | −.027 | .018 | −.032 | −1.563 | .118 |
| Driving Risk Tolerance | .111 | .024 | .121 | 4.561 | .000 |
| BF x Driving Risk Tolerance | −.109 | .037 | −.077 | −2.926 | .003 |
Descriptive Statistics for Variables of Interest in the Study
| Black Female | Wealth | Risk Tolerance | Gender Role Attitude | Education 2008 | Education 2010 | |
|---|---|---|---|---|---|---|
| M | 0.30 | 4.86 | 0.00 | 0.00 | 13.30 | 13.34 |
| Mdn | 0.00 | 5.02 | 0.04 | 0.23 | 12.00 | 12.00 |
| SD | 0.46 | 0.88 | 1.00 | 1.00 | 2.56 | 2.59 |
| Min | 0.00 | 0.00 | −1.57 | −1.26 | 2.00 | 2.00 |
| Max | 1.00 | 6.56 | 2.50 | 3.41 | 20.00 | 20.00 |
Standardized Total Effects
| Black Female | Gender-Role Attitude | Education | Wealth | |
|---|---|---|---|---|
| Gender-Role Attitude | .037 | .000 | .000 | .000 |
| Education | −.138 | .000 | .000 | .000 |
| Wealth | −.373 | .000 | .000 | .000 |
| Risk Tolerance | .062 | −.013 | .088 | .081 |