
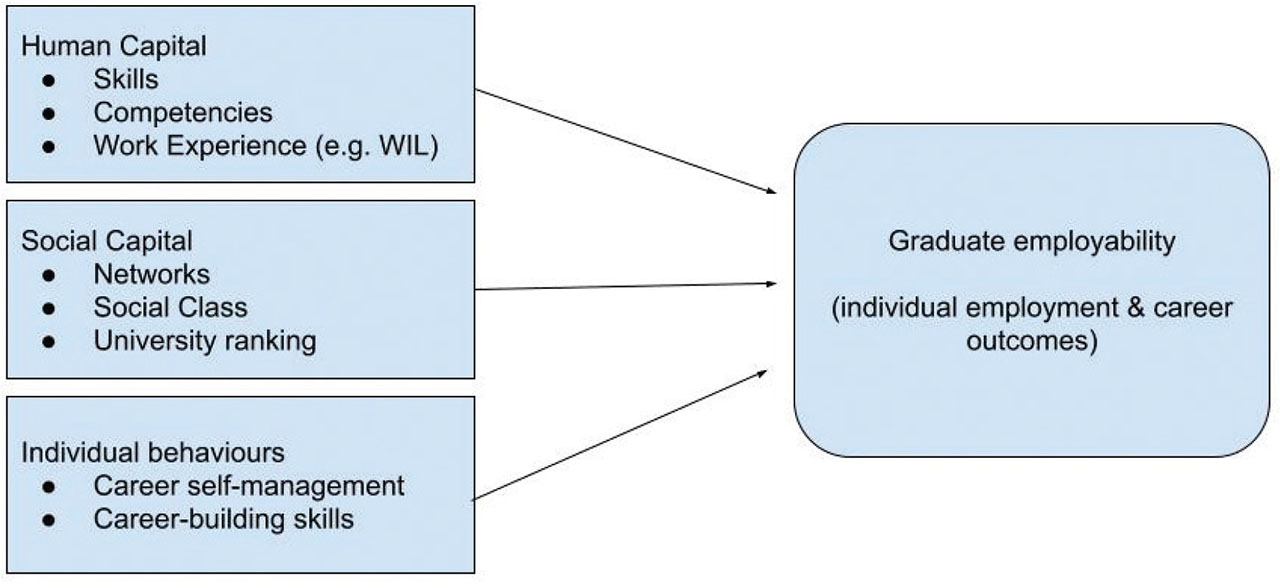
Figure 1.
A simplified model of graduate employability.
Note: This figure was created by Clarke (2018) based on research by Holmes (2013).
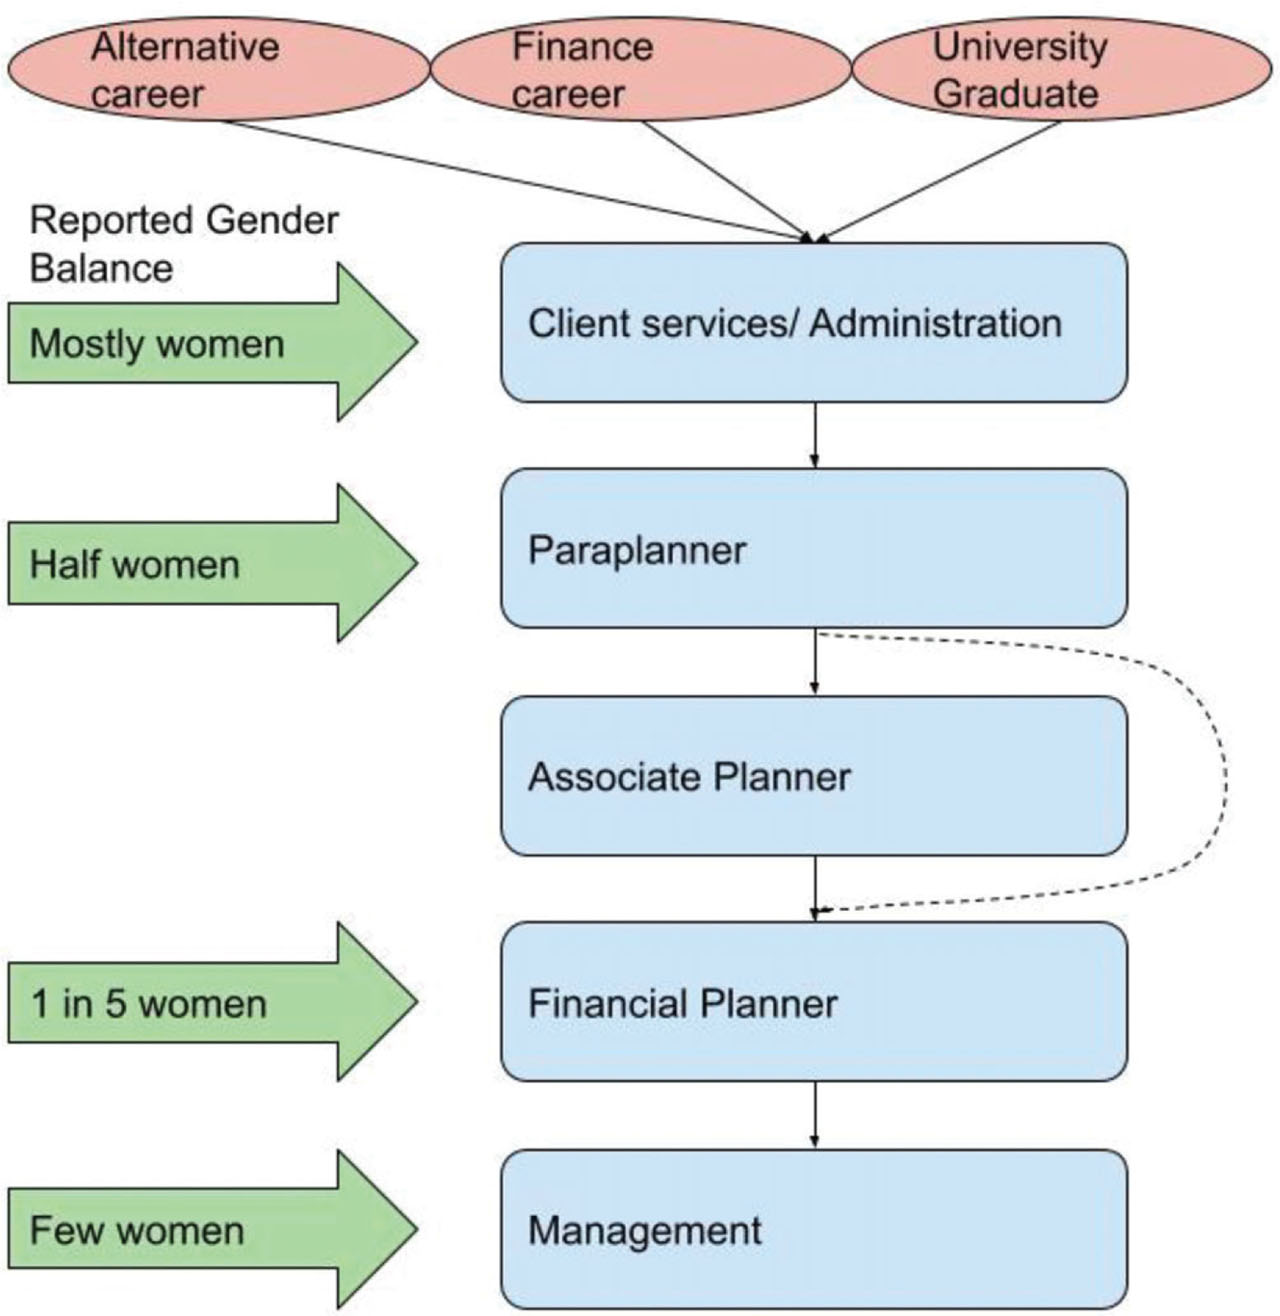
Figure 2.
Reported ideal career path in the financial planning sector.
Note: Figure 2 is from O’Dwyer and Richards (2021, p. 6).
Table 1.
Overview of respondents
| Category | Details |
|---|---|
| Number of Respondents | 20 |
| Mean experience in financial services | 5.5 years |
| Support Role | 45% working in support roles (9 out of 20 respondents) |
| CFP Designation Status | - 20% CFPs |
| - 15% Currently pursuing CFP | |
| - 65% Do not currently have CFP | |
| Gender | 70% Male, 30% Female |
| Mean interview length | 32 minutes |