
Table 1.
Characteristics of the participating population.
| Criteria | n | % | 95% CI | P-value |
|---|---|---|---|---|
| Anemia | 0.000 | |||
| Yes | 24 | 42.1 | 38.5–45.7 | |
| No | 33 | 57.9 | 55.3–60.5 | |
| Sex of the infant | 0.050 | |||
| Man | 31 | 54.4 | 51.7–47.1 | |
| Women | 26 | 45.6 | 42.9–47.1 | |
| Mother’s age | 0.010 | |||
| 16–20 years old | 21 | 36.8 | 33.2–39.7 | |
| 21–30 years old | 27 | 47.4 | 45.7–50.1 | |
| 30< | 9 | 15.8 | 13.1–18.5 | |
| Mother’s educational level | 0.000 | |||
| Primary | 8 | 14.0 | 11.7–16.3 | |
| Secondary | 46 | 80.7 | 77.5–83.3 | |
| Superior | 3 | 5.3 | 2.1–8.5 | |
| Occupation | 0.060 | |||
| Housewife | 51 | 89.5 | 85.4–92.6 | |
| Trade | 6 | 10.5 | 8.4–13.6 | |
| Socioeconomic status | 0.012 | |||
| Not poor | 3 | 5.3 | 2.1–8.5 | |
| Poor | 43 | 75.4 | 72.5–78.3 | |
| Extreme poverty | 11 | 19.3 | 16.8–22.8 | |
| Area of origin | 0.020 | |||
| Rural | 39 | 68.4 | 65.9–71.9 | |
| Urban | 18 | 31.6 | 28.1–34.1 |
Table 2.
Hemoglobin level and adherence to ferrous sulfate in 6-month-old children.
| Criteria | Adherents | Non-adherent | Total | |||
|---|---|---|---|---|---|---|
| n | % | n | % | n | % | |
| Adequate hemoglobin | 29 | 50.9 | 4 | 7.0 | 33 | 57.9 |
| Inadequate hemoglobin | 2 | 3.5 | 22 | 38.6 | 24 | 42.1 |
| Total | 31 | 54.4 | 26 | 45.6 | 57 | 100 |
Table 3.
Hemoglobin values in 6-month-old children (n = 57).
| Values | Criteria | n | % |
|---|---|---|---|
| <7.0 g/dL | Severe anemia | 0 | 0.0 |
| 7.0–9.9 g/dL | Moderate anemia | 3 | 5.3 |
| 10.0–10.9 g/dL | Mild anemia | 21 | 36.8 |
| ≥11.0 g/dL | Without anemia | 33 | 57.9 |
Table 4.
Factors associated with prophylactic adherence with ferrous sulfate in 6-month-old children.
| Factors and Level* | n | % | OR | 95% CI | P-value |
|---|---|---|---|---|---|
| Individual | 1.80 | 1.20–2.70 | 0.005 | ||
| High | 14 | 24.6 | |||
| Half | 0 | 0.0 | |||
| Low | 43 | 75.4 | |||
| Familiar | 1.50 | 1.10–2.05 | 0.020 | ||
| High | 11 | 19.3 | |||
| Half | 6 | 10.5 | |||
| Low | 40 | 70.2 | |||
| Social | 0.75 | 0.60–0.95 | 0.010 | ||
| High | 13 | 22.8 | |||
| Half | 27 | 47.4 | |||
| Low | 17 | 29.8 | |||
| Institutional | 0.65 | 0.45–0.90 | 0.005 | ||
| High | 49 | 86.0 | |||
| Half | 0 | 0.0 | |||
| Low | 8 | 14.0 |
* The values shown represent the level of adherence observed for each factor: low, half, or high; OR values >1 indicate an increase in the probability of non-adherence, while OR <1 indicate a decrease and greater protection for adherence;P ≥ 0.05, there is no significant relationship with non-adherence.
Table 5.
Factors associated with hemoglobin level in 6-month-old children.
| Factors | Hemoglobin (%) | COR | AOR | P-value | |
|---|---|---|---|---|---|
| Adequate | Inadequate | (95% CI) | (95% CI) | ||
| Individual | 3 (5.3) | 11 (19.3) | 3.2 (1.8–5.6) | 2.8 (1.6–5.0) | 0.001 |
| Familiar | 8 (14.0) | 9 (15.8) | 2.1 (1.3–3.4) | 2.0 (1.2–3.0) | 0.000 |
| Social | 4 (7.0) | 5 (8.8) | 1.8 (1.0–3.0) | 1.5 (0.9–2.7) | 0.080 |
| Institutional | 16 (28.1) | 1 (1.8) | 1.5 (0.8–2.8) | 1.3 (0.7–2.4) | 0.240 |
| Total | 31 (54.4) | 26 (45.6) | – | – | – |
[i] Note: OR (95% CI), crude OR with its confidence interval; OR values >1 indicate influence or harm with hemoglobin levels; AOR (95% CI), AOR with its confidence interval; AOR values >1 indicate greater influence with hemoglobin levels after adjustment; A P-value <0.05 indicates a significant correlation of each factor with the hemoglobin level; The Hosmer and Lemeshow test = 0.412 showed that the model fits well; AOR, adjusted odds ratio; CI, confidence interval; OR, odds ratio.
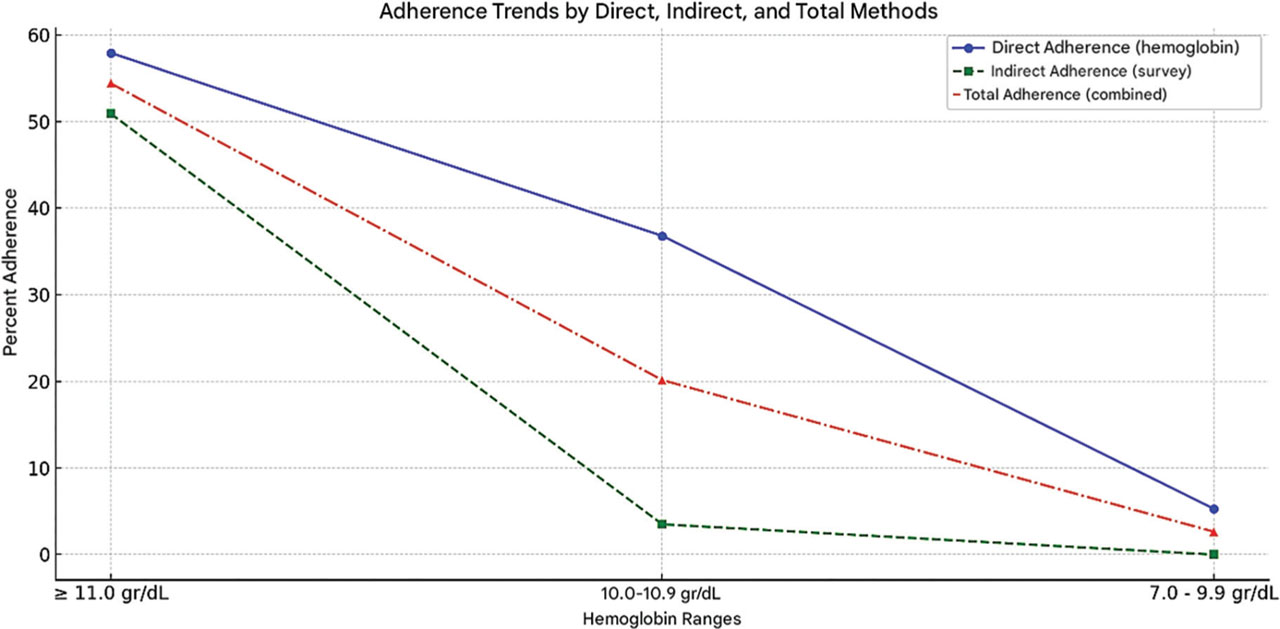
Figure 1.
Adhesion to ferrous sulfate according to direct and indirect methods.