
Table 1.
Item content of the FSI subscale of the D-FISQ and the HD-FIQ.
| Item No. | Snoek et al. (original English version of the FSI). (When I have to inject myself) | Mollema et al. (abbreviated English version of the FSI). (When I have to inject myself) | Celik and Pinar (Turkish version of the FSI). (When I have to inject myself) | In the present study (HD-FIQ). (When a needle must be inserted into a vascular access for HD) |
|---|---|---|---|---|
| 1 | I feel afraid. | I become restless. | I become restless. | I feel tense. |
| 2 | I start to sweat. | I feel tense. | I feel tense. | I feel afraid. |
| 3 | I become restless. | I feel afraid. | I feel afraid. | I feel nervous. |
| 4 | I try to avoid it. | I worry about it. | I worry about it. | I brood about it. |
| 5 | I feel tense. | I feel nervous. | I feel nervous. | |
| 6 | I get a stomachache. | I brood about it. | I brood about it. | |
| 7 | I panic. | |||
| 8 | I worry about it. | |||
| 9 | My heart starts pounding. | |||
| 10 | I feel nervous. | |||
| 11 | I start trembling. | |||
| 12 | I feel anxious. | |||
| 13 | I have trouble breathing. | |||
| 14 | I try to postpone it. | |||
| 15 | I get angry. |
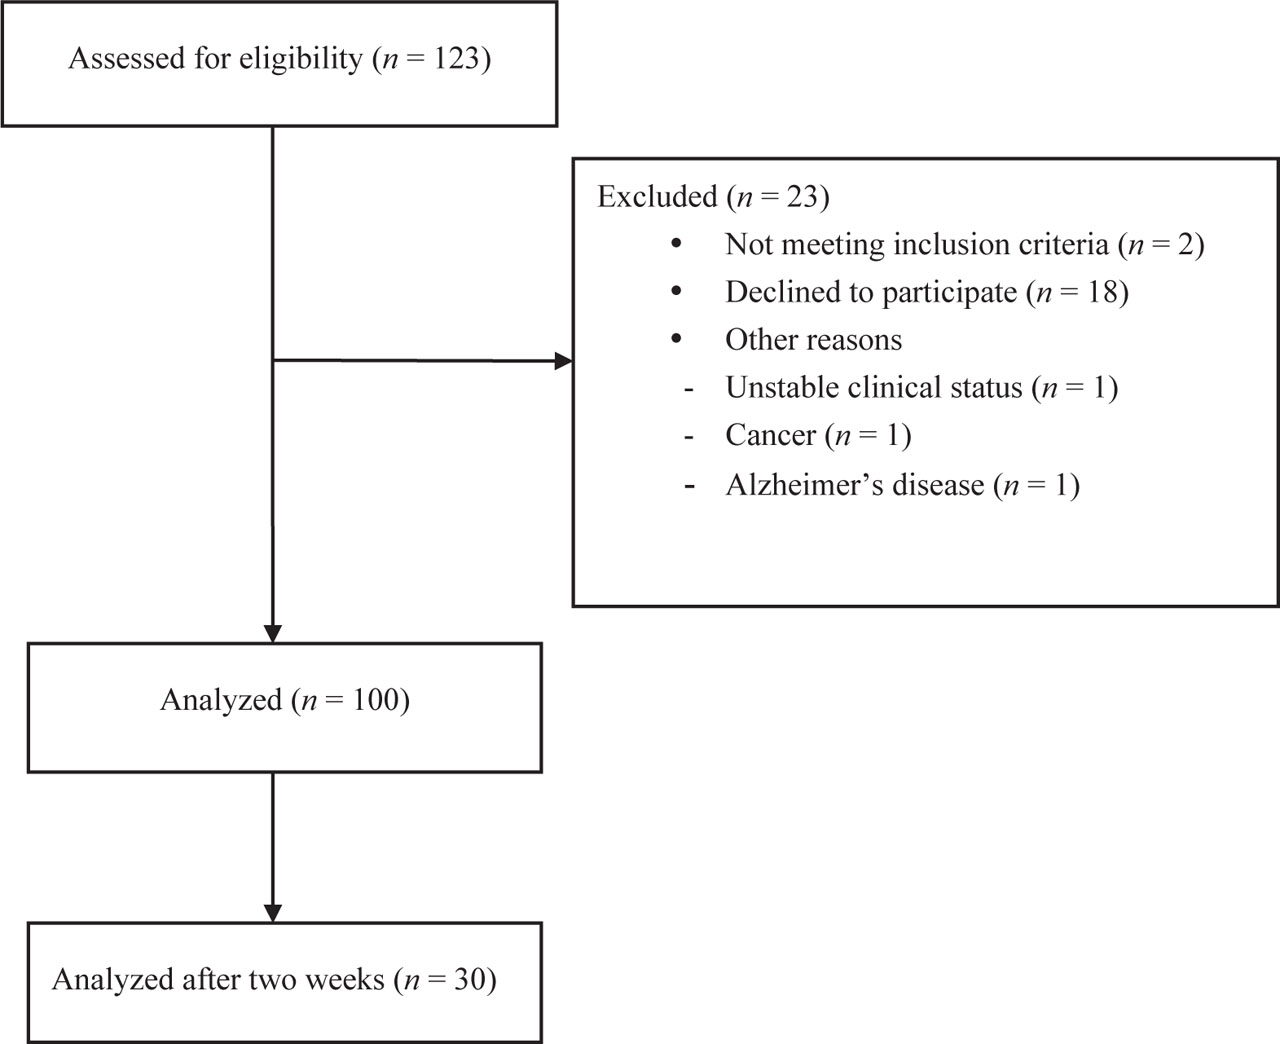
Figure 1.
STROBE flow diagram of the study design.
Note: STROBE: Strengthening the Reporting of Observational Studies in Epidemiology.
Table 2.
Descriptions of participant characteristics and comparison of the HD-FIQ scores by participant characteristics (N = 100).
| Variables | n (%) | HD-FIQ | ||
|---|---|---|---|---|
| M (SD) | z† | P-value | ||
| Gender | ||||
| Female | 38 (38.0) | 5.95 (3.01) | –0.06 | 0.951 |
| Male | 62 (62.0) | 6.26 (3.32) | ||
| Marital status | ||||
| Married | 58 (58.0) | 6.41 (3.50) | –0.68 | 0.495 |
| Unmarried | 42 (42.0) | 5.76 (2.74) | ||
| Education level | ||||
| Literate/primary school (5 years) | 39 (39.0) | 6.44 (3.23) | –1.08 | 0.281 |
| Secondary school or greater (≥6 years) | 61 (61.0) | 5.95 (3.20) | ||
| Employment status | ||||
| Working | 20 (20.0) | 5.65 (2.56) | –0.68 | 0.498 |
| Not working | 80 (80.0) | 6.26 (3.34) | ||
| Income level | ||||
| Adequate | 20 (20.0) | 5.35 (2.25) | 2.16 | 0.339 |
| Moderate | 45 (45.0) | 6.16 (3.42) | ||
| Inadequate | 35 (35.0) | 6.57 (3.35) | ||
| Comorbidity | ||||
| Yes | 76 (76.0) | 6.07 (2.90) | −0.38 | 0.703 |
| No | 24 (24.0) | 6.38 (4.06) | ||
| Dialysis frequency | ||||
| Twice weekly | 8 (8.0) | 7.00 (3.16) | –1.05 | 0.294 |
| 3 times weekly | 92 (92.0) | 6.07 (3.21) | ||
| Residual urine output | ||||
| Yes | 12 (12.0) | 6.08 (3.03) | –0.14 | 0.886 |
| No | 88 (88.0) | 6.15 (3.24) | ||
| Vascular access | ||||
| AVF | 87 (87.0) | 6.39 (3.30) | –2.73 | 0.006 |
| Catheter | 13 (13.0) | 4.46 (1.66) | ||
| Injection fear | ||||
| Yes | 48 (48.0) | 8.46 (3.32) | –9.15 | <0.001 |
| No | 52 (52.0) | 4.00 (0.01) | ||
| Intensity of injection fear (n = 48) | ||||
| No | 52 (52.0) | 4.00 (0.01) | 89.23 | <0.001 |
| Mild | 31 (31.0 | 6.97 (1.96) | ||
| Medium | 11 (11.0) | 9.18 (2.09) | ||
| High | 6 (6.0) | 14.83 (2.86) | ||
| Intensity of anxiety | ||||
| Medium | 32 (32.0) | 6.06 (4.47) | –2.70 | 0.007 |
| High | 68 (68.0) | 6.18 (2.43) | ||
Table 3.
Means, SDs, ranges, medians, and comparison of the HD-FIQ scores by various parameters (n = 100).
| Variables | M (SD) | Range | Median | HD-FIQ | |
|---|---|---|---|---|---|
| r† | P | ||||
| Age (years) | 62.99 (16.34) | 21–96 | 63.00 | 0.14 | 0.157 |
| Dialysis vintage (months) | 88.61 (85.03) | 1–396 | 60.00 | –0.40 | <0.001 |
| Intensity of injection fear (VAS) | 2.62 (2.19) | 1–9 | 1.00 | 0.96 | <0.001 |
| STAI-S | 61.87 (6.50) | 50–75 | 63.00 | 0.33 | 0.001 |
Table 4.
Item means, SDs, CITC, CAID, component loading, and inter-item correlation matrix of the HD-FIQ (n = 100).
| Item No | M (SD) | CITC | CAIDa | Component loading† | Item 1 r* | Item 2 r* | Item 3 r* |
|---|---|---|---|---|---|---|---|
| 1 | 1.57 (0.86) | 0.88 | 0.89 | 0.94 | – | ||
| 2 | 1.69 (0.88) | 0.87 | 0.89 | 0.93 | 0.80 | – | |
| 3 | 1.44 (0.83) | 0.87 | 0.89 | 0.93 | 0.71 | 0.72 | – |
| 4 | 1.50 (0.88) | 0.83 | 0.90 | 0.91 | 0.70 | 0.67 | 0.75 |