
1. Introduction
Global population aging is reshaping healthcare systems worldwide, necessitating adaptations in areas such as integrated care models, chronic disease management, and early intervention for frailty and dementia.1,2 A critical response to this demographic shift is the development of long-term care (LTC) systems. Since the 1960s, many Western countries have established long-term care insurance (LTCI) schemes to support individuals who have lost independence in daily life for extended periods. Formal LTC services have, to a considerable extent, addressed the issue of “socialization of care” and alleviated family caregiving burdens. In China, the pilot program for LTCI was launched in 2016 and has since expanded to 49 cities. During the 15th 5-Year Plan period, the LTCI system is transitioning from the pilot phase to nationwide establishment, while continuing to refine service processes, standardize operational guidelines, and drive quality improvement in service delivery.3 Therefore, understanding the home-based care needs of urban older adults in China is crucial for the comprehensive implementation of the LTCI policy.
However, older people are reluctant to use existing long-term care services in many situations. For instance, in Sweden, the proportion of older adults primarily cared for by family members increased from 60% in 1994 to 70% in 2000.4 A Japanese national survey in 2007 estimated that about 1.6 million people refused to pay for social health insurance premiums even though their incomes were high enough to be taxable.5,6,7,8,9 Similar challenges have been observed within China’s LTCI system, where a key systemic flaw lies in the misalignment between standardized service offerings and the highly differentiated needs of the older population.3 Precise targeting of services is paramount, as inadequate care leads to poor health outcomes, while excessive or inappropriate services incur costs without commensurate benefit.10
Segmenting populations into groups that are relatively homogenous in terms of their characteristics helps provide targeted services to different segments to meet their healthcare needs optimally.11 For example, identifying people as being “frailty with or without dementia” informs us that the priority concern for this type of people is integrated home-based service, including providing morbidity and care devices, training and supporting family caregivers, and selling nursing facilities. Thus, health-care needs segmentation has distinct advantages of enabling development and evaluation of integrated care, in relation to certain needs of these services.
There have been many segmentation models that help policymakers distribute health resources. A typical healthcare-need-based scheme is “bridge to health model” by Lynn et al.11 The Bridge to Health model is an initiative in creating the concept of segmenting the patient population based on health prospects and priorities that can make the distribution of healthcare resources and interventions more effective and efficient.12 Chong and Matchar13 made a systematic review of 16 population segmentation models and found that most identified tools were only conceptually comparative, but there is a lack of a segmentation model that can be universally applicable. Thus, it is necessary to research segmentation model in different care scenes and populations.
With the nationwide pilot of LTCI in China, designing services that are acceptable and effective for its vast aging population is urgent. Beijing, the nation’s capital, was selected as the study setting due to its representative aging profile: it ranks among the top of all provincial-level regions in both aging rate and the number of older adults living at home. Furthermore, Shijingshan District in Beijing was among the first national pilots for LTCI, where community-dwelling older adults demonstrate relatively strong demand for and purchasing power toward home-based care services, thus enhancing the generalizability of the findings. To avoid scenarios where home-based LTC services are underutilized, developing a needs-based classification model for Chinese community-dwelling older adults is essential. Currently, there is a paucity of research applying population segmentation approaches to this group in the Chinese context. Therefore, this study had 2 primary objectives: first, to classify older adults based on functional status using a data-driven clustering method; and second, to compare their demographic, physiological, psychological, and social characteristics, as well as their perceived needs for various LTC services across the identified clusters. The findings aim to provide evidence for developing more targeted and efficient LTC service packages.
2. Methodology
2.1. Study design
A community-based, cross-sectional study was conducted from June 2020 to August 2021. The study was reported in accordance with the strengthening the reporting of observational studies in epidemiology (STROBE) statement.14 A self-administered electronic questionnaire based on the Chinese version of the continuity assessment record and evaluation (CARE) items was used for comprehensive assessment of older people.15 The study was conducted in 8 communities of 5 districts (including Xicheng district, Docheng district, Chaoyang district, Haidian district, and Fengtai district) in Beijing. A simple random sampling method was used, and older people were stratified by activities of daily living (ADL). A stratified random sampling design was employed to ensure the sample represented the spectrum of functional ability among the target population. The sampling procedure consisted of the following steps: (1) A roster of all residents aged 60 years and above was compiled for each of the 8 selected communities, primarily sourced from local community health service centers and neighborhood committees. (2) Eligible individuals on the roster were stratified into 3 mutually exclusive strata based on their ADL score: independent (ADL = 100), mildly dependent (ADL = 95–99), and moderately or severely dependent (ADL <95). Following stratification, a simple random sampling method was applied independently within each stratum to select the study participants. A computer-generated random number list was used for this purpose. All participants provided written informed consent prior to their involvement in the study.
The sample size for this community-based survey was calculated to ensure sufficient precision for estimating population proportions. The following formula for estimating a population proportion was used.16
The parameters were set as follows: a 95% confidence level (z = 1.96), a conservative anticipated proportion (P = 0.5) to maximize the required sample size, a margin of error of 2% (0.02), and a design effect (deff) of 1.5 to account for the stratified sampling by functional status. This yielded a minimum required sample size of 3602. Based on the estimated functional distribution within the urban elderly population, the minimum total sample of 3602 was proportionally allocated across the 3 pre-defined strata: approximately 2521 for the independent (ADL = 100), 720 for the mildly dependent (ADL 95–99), and 361 for the moderately/severely dependent (ADL <95) stratum.
In the field implementation, a total of 6150 community-dwelling older adults were surveyed. The inclusion criteria were: (1) Aged 60 and above; (2) Living in their home for at least 6 months; (3) Living in Beijing now and will live here for another year continuously; (4) Having at least one contactable caregiver; (5) Agreed to participate in this study. The following participants were excluded from the study: (1) Living in the community, but 3 investigations failed since they were not at home; (2) Refused to participate in the study. All participants had signed the informed consent prior to the investigation, and the study had been approved by the Institutional Review Board of Capital Medical University in Beijing, China. After excluding incomplete or inconsistent responses, 5997 valid questionnaires were included in the final analysis, yielding a high response rate of 97.5%. The actual number of participants significantly exceeded the initial allocation in each stratum: 4243 (independent), 969 (mildly dependent), and 785 (moderately/severely dependent). These achieved sample sizes ensure ample statistical power for robust within- and between-stratum comparisons in all subsequent analyses.
2.2. Measures
Demographic and socioeconomic characteristics, including age, sex, education level, monthly income, marital status, living arrangement, and district of residence, were collected. Functional status, psychological characteristics, and social characteristics were primarily assessed using the Chinese version of the CARE item set, which was adapted from the original English tool designed for comprehensive geriatric assessment. The Chinese CARE demonstrated excellent reliability, with a Cronbach’s α of 0.97 for the functional status subscale and good-to-excellent inter-rater agreement (Kappa = 0.6–1.0 for 93.5% of items). Validity was also strongly supported: content validity indices were high [scale-level Content Validity Index (CVI) = 0.93, average CVI = 0.98], and criterion validity correlations with established tools were significant, including with the Barthel Index (r = 0.93) and the Mini-Mental State Examination (r = 0.70). Based on this rigorous validation process, the Chinese CARE was confirmed as a reliable and valid instrument for the comprehensive assessment in this study. We also collected self-reported long-term care service needs by presenting participants with a list of 18 common LTC services and asking them to indicate their current need for each service.15
To ensure data quality, a 2-person data entry system was implemented, in which 2 researchers independently entered the same set of data. Any discrepancies were reviewed and resolved by referring to the original questionnaires. Additionally, a third researcher randomly selected 10% of the entered records for verification against the original responses to ensure consistency and accuracy.
2.3. Statistical analysis
K-means was an effective semi-parametric machine learning approach that classifies data assuming “k” clusters previously.17,18 The main advantage of k-means is that it has high computational speed for large variables if the number of clusters is small. Considering that the sample size in our data was relatively large, and we classified the functional status of the elderly based on data characteristics rather than existing classification standards. Therefore, the k-means algorithm was performed to identify optimal functional clusters for older people. All variables used in the clustering procedure were standardized to z-scores to eliminate scale differences and ensure comparability. Different clustering solutions were tested, comparing models using activities of daily living (ADL) and instrumental activities of daily living (IADL) scores alone versus in combination with other variables; the solution based solely on ADL and IADL scores produced the most interpretable and homogeneous clusters. The optimal cluster number was determined by the “elbow method,” in other words, by observing the descent rate of the sum of squared error as the number of clusters increased using “scree plot”.17,18. We also combined relevant professional knowledge to select optimal cluster number. The scatter plots of sample distribution were used to observe whether all kinds of samples were clearly divided. The ratio of “cluster sum of squares” and “total sum of squares” was calculated to evaluate the performance of clustering. Considering the heterogeneity of variants between groups, one-way Analysis of Variance (ANOVA) was used for continuous variables, and the chi-square test was used for categorical variables. Logistic regression analysis was conducted by a disordered multiple classification model using “health states” as a reference. Univariate regression was first conducted, and then multivariate regression was performed to adjust baseline characteristics including age, sex, education, marriage, and income. The missing data were estimated by the multiple imputation method using “mice” package in R. All statistical analyses were conducted with R 3.6.2 (R Foundation for Statistical Computing, Vienna, Austria) and SPSS 26.0 (IBM Corp., Armonk, NY, USA). Our study was approved by Capital Medical University (2020SY047).
3. Results
A total of 6150 eligible older adults were approached across 8 communities in 5 districts of Beijing. Of these, 5997 completed the survey, yielding a response rate of 97.5%. The sample had a mean age of 78.8 years (SD = 8.4), with 60.5% (n = 3624) being female and 39.5% (n = 2373) male. The majority were married (73.2%) and had attained at least primary education (93.4%). K-means clustering was applied to the standardized ADL and IADL scores. The elbow method, visualized by a scree plot, indicated an inflection point at a 4-cluster solution, which was also clinically interpretable and aligned with common functional classifications used in China. The ratios of between-cluster to total sum of squares were 70.5%, 73.4%, and 75.6% for the 3, 4, and 5 cluster solutions, respectively. The 4 clusters were defined as: Healthy (n = 4245, 70.8%), Mildly Disabled (n = 969, 16.2%), Moderately Disabled (n = 463, 7.7%), and Severely Disabled (n = 320, 5.3%). ADL and IADL total scores differed significantly across all clusters (Figure 1).
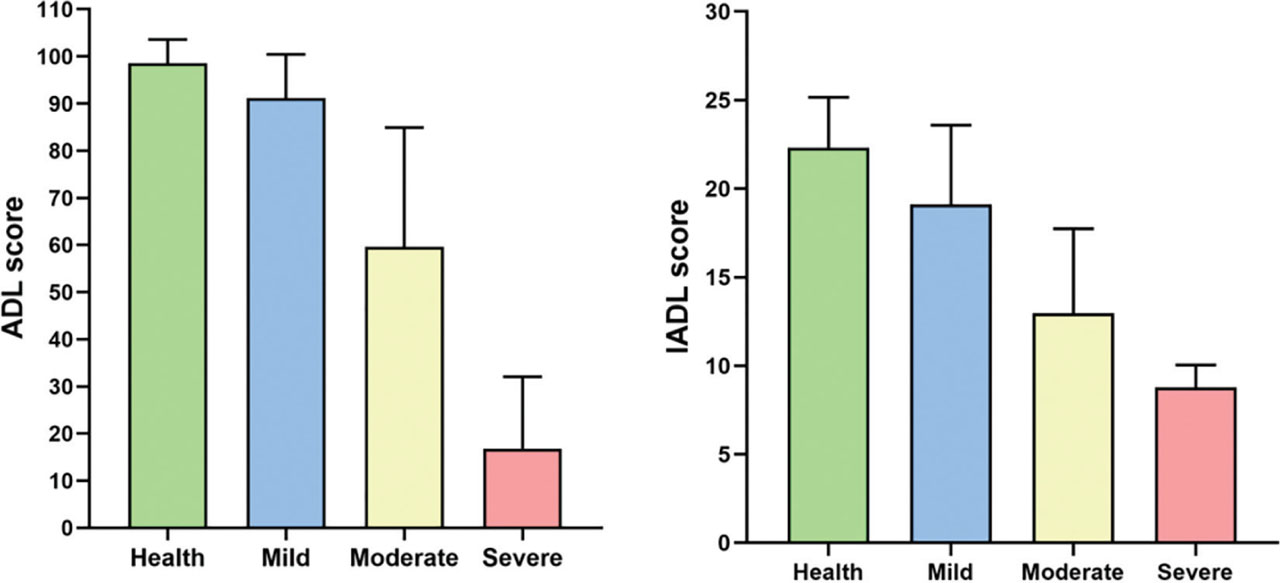
Figure 1.
ADL and IADL scores of 4 clusters of older people. ADL, activities of daily living.
As shown in Table 1, participants in the moderately and severely disabled clusters were significantly older than those in the healthy cluster (P < 0.01). Educational attainment was highest in the healthy group, with 78.8% having completed junior high school or above, compared to 71.9%, 60.2%, and 61.5% in the mild, moderate, and severe disability groups, respectively (P < 0.05). Interestingly, individuals in the severely disabled cluster reported a higher average monthly income than those in the other groups (P < 0.05). A higher proportion of married individuals was observed in the healthy and mildly disabled clusters compared to the groups with greater disability (P < 0.05).
Table 1.
Demographic characteristics of 4 clusters of older people (n = 5997), n (%).
| Variables | All (100%) | Health (n = 4243, 70.7%) | Mild (n = 969, 16.1%) | Moderate (n = 465, 7.7%) | Severe (n = 320, 5.3%) | P-value |
|---|---|---|---|---|---|---|
| Gender | <0.001a | |||||
| Female | 3624 (60.5) | 2583a, b (43.1) | 600a (10.0) | 262b (4.4) | 179a,b (3.0) | |
| Male | 2373 (39.5) | 1660a, b (27.7) | 369a (6.2) | 203b (3.4) | 141a,b (2.4) | |
| Age (years), mean (SD) | 78.8 (56.4) | 76.1b (47.6) | 82.9a,b (51.6) | 89.4a (85.4) | 92.0a (88.7) | <0.001c |
| Education | <0.001b | |||||
| Illiteracy | 395 (6.6) | 199c (4.7) | 87b (9.0) | 54b (11.6) | 55a (17.2) | |
| Primary | 1084 (18.0) | 700a (16.5) | 185b (19.1) | 131a,c (28.2) | 68c (21.3) | |
| Junior high | 1829 (30.4) | 1361b (32.1) | 304b (31.4) | 99a (21.3) | 65a (20.3) | |
| Senior high | 1376 (22.9) | 1031c (24.3) | 212b,c (21.9) | 86a,b (18.5) | 47a (14.7) | |
| Junior college | 720 (12.0) | 542a,c (12.8) | 83b (8.6) | 56c (12.0) | 39a,b,c (12.2) | |
| College and above | 593 (9.9) | 410b (9.7) | 98b (10.1) | 39b (8.4) | 46a (14.4) | |
| Income, mean (SD) | 4107 (3178) | 4061b (2965) | 4052b (2546) | 4288b (5335) | 4634a (3405) | <0.001c |
| Marriage | <0.001a | |||||
| Married | 4393 (73.2) | 3288c (77.5) | 650b (67.1) | 270a (58.1) | 185a (57.8) | |
| Unmarried | 1604 (26.8) | 955c (22.5) | 319b (32.9) | 195a (41.9) | 135a (42.2) | |
| Living district | <0.001b | |||||
| Xi Cheng District | 2705 (45.1) | 1695d (39.9) | 475c (49.0) | 289b (62.2) | 246a (76.9) | |
| Dong Cheng District | 653 (10.9) | 513c (12.1) | 97b,c (10.0) | 32b (6.9) | 11a (3.4) | |
| Hai Dian District | 63 (1.1) | 45a (1.1) | 14a (1.4) | 3a (0.6) | 1a (0.3) | |
| Chao Yang District | 1781 (29.7) | 1389d (32.7) | 259c (26.7) | 95b (20.4) | 38a (11.9) | |
| Feng Tai District | 759 (12.7) | 579c (13.6) | 116b,c (12.0) | 43a,b (9.2) | 21a (6.6) | |
| Other District | 36 (0.6) | 22a (0.5) | 8a (0.8) | 3a (0.6) | 3a (0.9) | |
| Nation | 0.328b | |||||
| Han nationality | 5670 (94.6) | 3999a (94.2) | 927a (95.7) | 442a (95.0) | 304a (95.0) | |
| Minority | 325 (5.4) | 244a (5.8) | 42a (4.3) | 23a (5.0) | 16a (5.0) | |
| Religion | 0.161b | |||||
| No religion | 5622 (93.7) | 3967b (93.5) | 912a (94.1) | 434a,b (93.3) | 309a (96.6) | |
| Have religion | 375 (6.3) | 276b (6.5) | 57a (5.9) | 31a,b (6.7) | 11a (3.4) |
Note: CCI included hypertension, Chronic Obstructive Pulmonary Disease (COPD), diabetes, CHD, stroke, OAD, and Parkinson disease; Polypharmacy means take 5 or more kind of drugs; Unmarried including single, divorced, widowed, separated, and other conditions; Different letter subscripts indicate significant differences in the proportion of columns; CHD, coronary heart disease; OHD, osteoarticular disease;
Physiological characteristics varied markedly by functional status in Table 2. The prevalence of underweight (BMI <18.5 kg/m2) was higher in the moderate and severe disability clusters, while overweight was more common in the healthy group (P < 0.05). The burden of chronic disease, measured by the Charlson Comorbidity Index (CCI), the number of medications used, and the rate of polypharmacy, increased significantly with the level of disability (P < 0.001). Notably, the prevalence of hypertension was higher in the mild and moderate disability groups, and bone/joint diseases were most frequent in the mildly disabled (P < 0.05). Sensory impairments (vision and hearing), a history of multiple falls, and longer daytime sleep duration were also strongly associated with greater functional decline (P < 0.001).
Table 2.
Physiological characteristics of 4 clusters of older people (n = 5997), n (%).
| Variables | All (100%) | Health (n = 4243, 70.7%) | Mild (n = 969, 16.1%) | Moderate (n = 465, 7.7%) | Severe (n = 320, 5.3%) | P-value |
|---|---|---|---|---|---|---|
| BMI (kg/m2) | <0.001b | |||||
| Skin | 210 (3.5) | 111b (2.6) | 33b (3.4) | 33a (7.1) | 33a (10.3) | |
| Normal | 2669 (45.5) | 1898a (44.7) | 447a (46.1) | 207a (44.5) | 147a (45.9) | |
| Overweight | 2342 (3.9) | 1717b (40.5) | 360a,b (37.2) | 168a,b (36.1) | 97a (30.3) | |
| Obesity | 746(12.4) | 517a (12.2) | 129a (13.3) | 57a (12.3) | 43a (13.4) | |
| Disease | ||||||
| Hypertension | 4168 (69.5) | 2942a, b (69.3) | 691b (71.3) | 334b (71.8) | 201a (62.8) | 0.023a |
| COPD | 160 (2.7) | 75c(1.8) | 36b (3.7) | 24a,b (5.2) | 25a (7.8) | <0.001b |
| Diabetes | 1725 (28.8) | 1117b (26.3) | 310a (32.0) | 173a (37.2) | 125a (39.1) | <0.001a |
| CHD | 1279 (21.6) | 805b (19.0) | 257a (26.5) | 141a (30.3) | 94a (29.4) | <0.001a |
| Stroke | 300 (5) | 103d (2.4) | 44c (4.5) | 66 b (14.2) | 87a (27.2) | <0.001b |
| OAD | 1397 (23.3) | 901a (21.2) | 299c (30.9) | 129b, c(27.7) | 68a, b(21.3) | <0.001a |
| Parkinson disease | 135 (2.3) | 38d (0.9) | 20c (2.1) | 28b (6.0) | 49a (15.3) | <0.001b |
| Charlson comorbidity index, mean (SD) | 1.81 (1.1) | 1.65c (0.9) | 1.99b (1.2) | 2.35a (1.3) | 2.63a (1.7) | <0.001c |
| Number of drugs, mean (SD) | 3.15 (2.5) | 3.02b (2.5) | 3.12b (2.3) | 3.75a (2.5) | 4.16a (2.9) | 0.003c |
| Polypharmacy | 742 (12.4) | 398c (9.4) | 134b (13.8) | 120a (25.9) | 90a (28.1) | <0.001a |
| Number of falls in the past 3 years, mean (SD) | ||||||
| 0 time | 4062 (67.7) | 3086a (72.7) | 593b (61.2) | 211c (45.4) | 172d (53.8) | <0.001b |
| 1 time | 932 (15.5) | 645b (15.2) | 171b (17.6) | 81b (17.4) | 35a (10.9) | |
| 2 times | 488 (8.1) | 292a (6.9) | 101b (10.4) | 68c (14.6) | 27a,b (28.4) | |
| 3 times and above | 515 (8.5) | 220c (5.2) | 104b (10.7) | 105a (22.6) | 86a (26.9) | |
| Vision mean (SD) | <0.001b | |||||
| Very clear | 3008 (50.1) | 2449d (57.7) | 395c (40.8) | 125b (26.9) | 39a (12.2) | |
| Clear | 1907 (31.7) | 1322b (31.2) | 370c (38.2) | 145b (31.2) | 70a (21.9) | |
| Unclear | 891 (14.8) | 427d (10.1) | 180c (18.6) | 150b (32.3) | 134a (41.9) | |
| Blind | 191 (3.1) | 45d (1.1) | 24c (2.5) | 45b (9.7) | 77a (24.1) | |
| Hearing, mean (SD) | <0.001b | |||||
| Very clear | 4327 (72.1) | 3438d (81.0) | 621c (64.1) | 197b (42.4) | 71a (22.2) | |
| Clear | 1210 (20.1) | 679c (16.0) | 270a (27.9) | 165b (35.5) | 96a,b (30.0) | |
| Unclear | 377 (6.2) | 115d (2.7) | 72c (7.4) | 85b (18.3) | 105a (32.8) | |
| Deaf | 83 (1.3) | 11c (0.3) | 6c (0.6) | 18b (3.9) | 48a (15.0) | |
| Hours of sleep in daytime | <0.001b | |||||
| 0 h | 1338 (22.3) | 1072b (25.3) | 198b (20.4) | 48a (10.3) | 20a (6.25) | |
| 1 h | 3085 (51.4) | 2355b (55.5) | 486b (50.2) | 178a (38.3) | 66a (20.6) | |
| 2–3 h | 1272 (21.2) | 728c (17.2) | 249b (25.7) | 168a (36.1) | 127a,b (39.7) | |
| 4 h and above | 302 (5.04) | 88c (2.07) | 36c (3.72) | 71b (15.3) | 107a (33.4) | |
Note: CCI included hypertension, COPD, diabetes, CHD, stroke, OAD, and Parkinson disease; Polypharmacy means take 5 or more kind of drugs; Unmarried including single, divorced, widowed, separated, and other conditions; Different letter subscripts indicate significant differences in the proportion of columns; CHD, coronary heart disease; OHD, osteoarticular disease;
Table 3 showed that psychological distress and social isolation were more prevalent among disabled older adults. The proportion of individuals reporting depressive symptoms or loss of interest in the past 2 weeks was significantly higher in the moderate and severe disability clusters (P < 0.05). Socially, a higher percentage of severely disabled older adults reported having no one to chat with (16.6% vs. 10.3% in the healthy group, P < 0.05). While perceived family support was high across all groups, communication with neighbors and perceived neighborly concern were substantially lower in the moderate and severe disability clusters (P < 0.05).
Table 3.
Psychological and social characteristics of 4 clusters of older people (n = 5997), n (%).
| Variables | All (100%) | Health (n = 4243, 70.7%) | Mild (n = 969, 16.1%) | Moderate (n = 465, 7.7%) | Severe (n = 320, 5.3%) | P-value |
|---|---|---|---|---|---|---|
| Feel depressed in the past 2 weeks | <0.001b | |||||
| Never | 4217 (70.3) | 3179c (74.9) | 625b (64.5) | 247a (53.1) | 166a (51.9) | |
| Occasionally | 1454 (24.2) | 919b (21.7) | 282a (29.1) | 159a (34.2) | 94a (29.4) | |
| Over half of time | 189 (3.15) | 92b (2.17) | 40a (4.13) | 34a (7.31) | 23a (7.19) | |
| Everyday | 137 (2.28) | 53c (1.25) | 22c (2.27) | 25b (5.38) | 37a (11.6) | |
| Lose interest in the past 2 weeks | <0.001b | |||||
| Never | 4760 (79.4) | 3571c (84.2) | 714b (73.7) | 298a (64.1) | 177a (55.3) | |
| Occasionally | 1031 (17.2) | 609b (14.4) | 217a (22.4) | 120a (25.8) | 85a (26.6) | |
| Over half of time | 118 (1.97) | 46c (1.08) | 25a (2.58) | 29b (6.24) | 18a,b (5.62) | |
| Everyday | 88 (1.47) | 17d (0.40) | 13c (1.34) | 18b (3.87) | 40a (12.5) | |
| Chat | 0.004b | |||||
| With someone to chat | 5342 (89.1) | 3807b (89.7) | 859a,b (88.6) | 409a,b (88.0) | 267a (83.4) | |
| Without someone to chat | 655 (10.9) | 436b (10.3) | 110a,b (11.4) | 56a,b (12.0) | 53a (16.6) | |
| Family care | . | |||||
| Family care about me much | 3350 (55.9) | 2356a (55.5) | 537a (55.4) | 259a (55.7) | 198a (61.9) | |
| Family care about me | 2364 (39.4) | 1698a (40.0) | 385a (39.7) | 176a (37.8) | 105a (32.8) | |
| Family care about me not much | 251 (4.19) | 172a (4.05) | 42a (4.33) | 24a (5.16) | 13a (4.06) | |
| Family didn’t care about me | 32 (0.53) | 17a (0.40) | 5a (0.52) | 6a (1.29) | 4a (1.25) | |
| Family support | <0.001b | |||||
| Family support me very support | 2858 (47.7) | 1950c (46.0) | 456b,c (47.1) | 245b (52.7) | 207a (64.7) | |
| Family support me | 1995 (33.3) | 1463b (34.5) | 308a,b (31.8) | 145a,b (31.2) | 79a (24.7) | |
| Family support me not much | 973 (16.2) | 712b,c (16.8) | 182c (18.8) | 57a,b (12.3) | 22a (6.88) | |
| Family doesn’t support me | 171 (2.85) | 118a (2.78) | 23a (2.37) | 18a (3.87) | 12a (3.75) | |
| Neighbor | <0.001b | |||||
| No neighbors care about you | 1479 (24.7) | 957c (22.6) | 229c (23.6) | 148b (31.8) | 145a (45.3) | |
| A little neighbors care about you | 1048 (17.5) | 731a (17.2) | 175a (18.1) | 90a (19.4) | 52a (16.2) | |
| Some neighbors care about you | 1486 (24.8) | 1054a (24.8) | 256a (26.4) | 109a (23.4) | 67a (20.9) | |
| Most neighbors care about you | 1984 (33.1) | 1501c (35.4) | 309b,c (31.9) | 118a,b (25.4) | 56a (17.5) | |
| Bothering | <0.001b | |||||
| Never told anyone | 1612 (26.9) | 1048c (24.7) | 240c (24.8) | 148b (31.8) | 176a (55.0) | |
| Told people if asked | 2706 (45.1) | 1975 b (46.5) | 456b (47.1) | 195b (41.9) | 80a (25.0) | |
| Told few people | 468 (7.80) | 311a (7.33) | 84a (8.67) | 48a (10.3) | 25a (7.81) | |
| Told people initiatively | 1211 (20.2) | 909c (21.4) | 189b,c (19.5) | 74a,b (15.9) | 39a (12.2) | |
| Help | <0.001b | |||||
| Often find help when troubled | 1989 (33.2) | 1440c (33.9) | 287b,c (29.6) | 119b (25.6) | 143a (44.7) | |
| Sometimes find help when troubled | 1219 (20.3) | 852a (20.1) | 205a (21.2) | 102a (21.9) | 60a (18.8) | |
| Rarely find help when troubled | 1116 (18.6) | 808b (19.0) | 206b (21.3) | 74b (15.9) | 28a (8.75) | |
| Never find help when troubled | 1673 (27.9) | 1143a (26.9) | 271a (28.0) | 170b (36.6) | 89a,b (27.8) | |
Note: CCI included hypertension, COPD, diabetes, CHD, stroke, OAD, and Parkinson disease; Polypharmacy means take 5 or more kind of drugs; Unmarried including single, divorced, widowed, separated, and other conditions; Different letter subscripts indicate significant differences in the proportion of columns; CHD, coronary heart disease; OHD, osteoarticular disease;
Multinomial logistic regression analysis, adjusted for age, sex, education, marital status, and income, identified key factors associated with disability clusters in Table 4. The odds of severe disability increased markedly with age (e.g., age 91–101 vs. 60–65, adjusted OR = 213.56, 95% CI: 64.47–707.41) and lower education (illiteracy vs. college, adjusted OR = 0.17, 95% CI: 0.12–0.26). Physiological factors showed strong graded relationships: underweight (adjusted OR = 6.34, 95% CI: 4.32–9.31 for severe disability), polypharmacy (adjusted OR = 3.09, 95% CI: 2.34–4.09), vision impairment (blindness, adjusted OR = 45.22, 95% CI: 31.04–62.99), and multiple falls (≥3 falls, adjusted OR = 6.98, 95% CI: 5.32–9.16) were all significantly associated with higher disability levels. Psychologically, loss of interest nearly every day was strongly linked to severe disability (adjusted OR = 40.00, 95% CI: 12.50–128.00). Socially, lacking neighborly concern (adjusted OR = 3.46, 95% CI: 1.99–3.99) and rarely seeking help when troubled (adjusted OR = 3.43, 95% CI: 2.18–5.40) were also associated with greater functional impairment.
Table 4.
Disordered multiple classification Logistic regression for physiological, psychological, and social characteristics among 4 clusters.
| Variables | Mild (ref = health) OR (95% CI) | Moderate (ref = health) OR (95% CI) | Severe (ref = health) OR (95% CI) | Mild (ref = health) Adjusted OR (95% CI) | Moderate (ref = health) Adjusted OR (95% CI) | Severe (ref = health) Adjusted OR (95% CI) |
|---|---|---|---|---|---|---|
| Gender | ||||||
| Male | ||||||
| Female | 1.017 (0.763–1.354) | 1.281 (0.992–1.654) | 1.226 (0.975–1.541) | / | / | / |
| Age (years) | ||||||
| 60–65 | ||||||
| 66–70 | 1.905** (1.375–2.639) | 1.468 (0.803–2.686) | 3.997* (1.209–13.206) | / | / | / |
| 71–75 | 2.048** (1.456–2.880) | 2.357** (1.288–4.313) | 4.717* (1.400–15.895) | / | / | / |
| 76–80 | 2.500*** (1.798–3.474) | 3.786*** (2.134–6.717) | 8.837*** (2.732–28.584) | / | / | / |
| 81–85 | 3.786*** (2.704–5.299) | 7.502*** (4.244–13.264) | 25.202*** (7.902–80.380) | / | / | / |
| 86–90 | 6.273*** (4.327–9.095) | 17.984*** (10.027–32.256) | 77.765*** (24.320–248.656) | / | / | / |
| 91–101 | 9.013* (5.404–15.033) | 48.904* (25.507–93.761) | 213.555* (64.469–707.410) | / | / | / |
| Education | ||||||
| Illiteracy | ||||||
| Primary | 0.605*** (0.448–0.816) | 0.690* (0.484–0.983) | 0.351*** (0.238–0.519) | / | / | / |
| Junior | 0.511*** (0.386–0.677) | 0.268*** (0.186–0.386) | 0.173*** (0.117–0.255) | / | / | / |
| Junior high | 0.470*** (0.351–0.630) | 0.307*** (0.212–0.446) | 0.165*** (0.109–0.251) | / | / | / |
| Senior | 0.350*** (0.249–0.493) | 0.381*** (0.253–0.572) | 0.260*** (0.167–0.405) | / | / | / |
| Collage and above | 0.547*** (0.391–0.764) | 0.351*** (0.225–0.547) | 0.406*** (0.265–0.622) | / | / | / |
| Income | ||||||
| Below 4000 4200 (70) | ||||||
| 4000–10,000 1748 (29.1) | 0.931(0.809–1.071) | 1.047 (0.957–1.145) | 1.543*** (1.216–1.957) | / | / | / |
| Over 10,000 49 (0.9) | 0.739(0.285–1.915) | 1.601 (0.616–4.165) | 5.425*** (2.605–11.299) | / | / | / |
| Marriage | ||||||
| Married | ||||||
| Unmarried | 1.689*** (1.451–1.967) | 2.488*** (2.040–3.031) | 2.513*** (1.990–3.172) | / | / | / |
| BMI (kg/m2) | ||||||
| Normal | ||||||
| Skin | 1.262 (0.845–1.887) | 2.726*** (1.801–4.125) | 3.839*** (2.514–5.861) | 1.093(0.724–1.649) | 2.046*** (1.305–3.207) | 2.536** (1.580–4.071) |
| Over weight | 0.890(0.764–1.038) | 0.897 (0.725–1.111) | 0.729* (0.560–0.950) | 0.961 (0.822–1.124) | 1.054 (0.842–1.319) | 0.895 (0.677–1.185) |
| Obesity | 1.060(0.851–1.319) | 1.011 (0.742–1.377) | 1.074(0.754–1.529) | 1.109 (0.887–1.388) | 1.187 (0.857–1.642) | 1.294 (0.886–1.891) |
| Comorbidities | ||||||
| 1 disease | ||||||
| 2–3 diseases | 1.089*** (1.007–1.693) | 2.633*** (1.759–3.941) | 2.642*** (2.136–3.266) | 1.472*** (1.268–1.709) | 2.536*** (2.031–3.167) | 1.799*** (1.381–2.343) |
| 4 and above | 3.335*** (2.537–4.384) | 6.233*** (4.436–8.760) | 7.386*** (5.169–10.554) | 3.129*** (2.370–4.133) | 5.777*** (4.040–8.260) | 6.342*** (4.320–9.310) |
| Polypharmacy | ||||||
| Without polypharmacy | ||||||
| With polypharmacy | 1.410* (1.015–1.959) | 2.768*** (2.031–3.774) | 3.331*** (2.562–4.332) | 1.178(0.947–1.464) | 2.236*** (1.736–2.881) | 3.092*** (2.337–4.090) |
| Vision | ||||||
| Very clear | ||||||
| Clear | 1.735*** (1.483–2.030) | 2.149*** (1.676–2.755) | 3.325*** (2.235–4.947) | 1.636*** (1.395–1.918) | 2.135*** (1.727–2.641) | 2.601*** (1.554–4.351) |
| Unclear | 2.614*** (2.131–3.205) | 6.882*** (5.314–8.914) | 19.705*** (13.596–28.560) | 1.957*** (1.516–2.526) | 4.605*** (3.492–6.072) | 12.292*** (7.647–19.760) |
| Blind | 3.307*** (1.992–5.488) | 19.591*** (12.485–30.744) | 107.442*** (66.146–174.521) | 3.149*** (2.103–4.714) | 13.914*** (9.427–20.537) | 68.031*** (40.744–113.594) |
| Hearing | ||||||
| Very clear | ||||||
| Clear | 2.201* (1.867–2.596) | 4.241* (3.395–5.299) | 6.846*** (4.983–9.406) | 1.851*** (1.559–2.197) | 2.656*** (2.220–3.556) | 2.604*** (3.285–6.378) |
| Unclear | 3.466* (2.551–4.711) | 12.901* (9.415–17.677) | 44.218*** (31.040–62.990) | 2.810*** (1.936–3.645) | 6.873*** (4.911–9.618) | 18.237*** (16.203–34.530) |
| Deaf | 3.017* (1.111–8.191) | 28.564* (13.309–61.305) | 211.347* (105.366–423.927) | 4.577(0.954–7.108) | 23.654*** (8.274–40.197) | 125.780*** (60.933–259.637) |
| Number of falls in the past 3 years | ||||||
| 0 time | ||||||
| 1 time | 1.380*** (1.141–1.669) | 1.837*** (1.402–2.406) | 0.974 (0.670–1.414) | 1.337** (1.102–1.622) | 1.744*** (1.318–2.309) | 0.889 (0.604–1.308) |
| 2 times | 1.800*** (1.412–2.295) | 3.406*** (2.527–4.591) | 1.659*** (1.087–2.533) | 1.647*** (1.287–2.109) | 2.863*** (2.091–3.921) | 1.336 (0.858–2.078) |
| 3 times and above | 2.460*** (1.918–3.157) | 6.981*** (5.323–9.155) | 7.014*** (5.234–9.399) | 2.120*** (1.646–2.732) | 5.512*** (4.141–7.338) | 5.361*** (3.915–7.340) |
| Hours of sleep in daytime | ||||||
| 0 h | ||||||
| 1 h | 1.117 (0.933–1.338) | 1.688* (1.217–2.341) | 1.502 (0.906–2.491) | 1.045 (0.868–1.257) | 1.370 (0.979–1.916) | 1.165 (0.695–1.951) |
| 2–3 h | 1.852*** (1.503–2.282) | 5.154*** (3.689–7.200) | 9.351*** (5.782–15.125) | 1.620*** (1.305–2.013) | 3.604** (2.544–5.106) | 5.980* (3.637–9.832) |
| 4 h and above | 2.215*** (1.461–3.359) | 18.020*** (11.771–27.588) | 65.179*** (38.571–110.140) | 1.765** (1.151–2.706) | 9.808** (6.234–15.432) | 32.881* (18.898–57.211) |
| Feel depressed | ||||||
| Never | ||||||
| Occasionally | 1.561*** (1.332–1.829) | 2.227*** (1.801–2.754) | 1.959*** (1.505–2.550) | 1.547*** (1.316–1.819) | 2.220*** (1.774–2.777) | 1.954*** (1.476–2.587) |
| Over half of time | 2.211*** (1.511–3.237) | 4.757*** (3.144–7.198) | 4.788*** (2.954–7.759) | 2.037*** (1.381–3.006) | 4.247*** (2.742–6.662) | 4.294*** (2.542–7.252) |
| Everyday | 2.111*** (1.275–3.496) | 6.072*** (3.709–9.939) | 13.368*** (8.541–20.923) | 1.927* (1.154–3.218) | 5.307*** (3.148–8.947) | 11.984*** (7.233–19.856) |
| Lose interest | ||||||
| Never | ||||||
| Occasionally | 1.782*** (1.497–2.122) | 2.361*** (1.879–2.968) | 2.816*** (2.144–3.698) | 1.779*** (1.490–2.124) | 2.358*** (1.855–2.997) | 2.895*** (2.172–3.859) |
| Over half of time | 2.718*** (1.659–4.453) | 7.554***(4.677–12.203) | 7.895*** (4.485–13.896) | 2.574*** (1.563–4.240) | 7.413*** (4.479–12.269) | 8.060*** (4.428–14.673) |
| Everyday | 3.825*** (1.849–7.910) | 12.689*** (6.471–24.879) | 47.474*** (26.390–85.402) | 3.320*** (1.593–6.920) | 10.071*** (4.963–20.436) | 37.919*** (19.951–72.070) |
| Chat | ||||||
| With someone | ||||||
| Without someone | 1.118(0.896–1.396) | 1.196 (0.889–1.608) | 1.733*** (1.270–2.366) | 1.006 (0.800–1.264) | 0.991 (0.725–1.355) | 1.488* (1.062–2.085) |
| Family care | ||||||
| Family care about me much | ||||||
| Family care about me | 0.995 (0.860–1.150) | 0.943 (0.771–1.153) | 0.736* (0.576–0.940) | 1.016 (0.876–1.178) | 1.008 (0.816–1.245) | 0.835 (0.644–1.083) |
| Family care about me not much | 1.071(0.755–1.520) | 1.269 (0.813–1.983) | 0.899 (0.502–1.610) | 1.049 (0.734–1.500) | 1.308 (0.819–2.090) | 0.939 (0.508–1.737) |
| Family didn’t care about me | 1.290 (0.474–3.512) | 3.210* (1.255–8.214) | 2.799 (0.933–8.400) | 1.134 (0.409–3.147) | 2.411 (0.861–6.750) | 2.074 (0.606–7.099) |
| Family support | ||||||
| Family support me very support | ||||||
| Family support me | 0.900 (0.767–1.056) | 0.789* (0.635–0.979) | 0.509** (0.389–0.665) | 0.909 (0.772–1.069) | 0.836 (0.666–1.049) | 0.551*** (0.415–0.731) |
| Family support me not much | 1.093 (0.902–1.325) | 0.637** (0.472–0.861) | 0.291*** (0.186–0.455) | 1.167 (0.958–1.422) | 0.765 (0.558–1.048) | 0.387*** (0.243–0.615) |
| Family doesn’t support me | 0.769 (0.447–1.322) | 0.984 (0.519–1.866) | 0.741 (0.339–1.620) | 0.768 (0.443–1.331) | 1.038 (0.530–2.033) | 0.788 (0.344–1.802) |
| Neighbor | ||||||
| Most neighbors care about you | ||||||
| Some neighbors care about you | 1.696*** (1.124–2.558) | 2.131*** (1.468–3.094) | 2.130*** (1.530–2.966) | 1.953*** (1.313–2.906) | 3.097*** (2.152–4.457) | 3.654*** (2.605–5.126) |
| A little neighbors care about you | 1.594** (1.089–2.333) | 2.419*** (1.722–3.399) | 2.383*** (1.761–3.225) | 1.578** (1.074–2.320) | 2.342*** (1.647–3.329) | 2.327*** (1.682–3.218) |
| No neighbors care about you | 2.064* (1.395–3.055) | 3.494** (2.456–4.971) | 4.061** (2.952–5.586) | 1.599* (1.054–2.425) | 1.822** (1.240–2.677) | 1.758** (1.235–2.503) |
| Bothering | ||||||
| Told people initiatively | ||||||
| Told few people | 2.898*** (2.063–4.071) | 4.180*** (3.075–5.682) | 4.146*** (3.150–5.456) | 2.238*** (1.998–3.985) | 3.285*** (2.683–5.063) | 3.456*** (1.998–3.985) |
| Told people when they were asked | 2.284** (1.343–3.882) | 2.464*** (1.514–4.011) | 2.090*** (1.349–3.237) | 2.350** (1.375–4.015) | 2.511*** (1.519–4.150) | 2.084*** (1.375–4.015) |
| Never told anyone | 2.256** (1.446–3.521) | 3.553** (2.392–5.279) | 3.914** (2.736–5.599) | 2.822* (1.427–3.509) | 3.685** (2.186–4.936) | 3.373** (1.427–3.509) |
| Help | ||||||
| Often find help when troubled | ||||||
| Sometimes find help when troubled | 2.043*** (1.368–3.051) | 1.072*** (1.199–2.418) | 1.410 (0.968–1.680) | 2.521*** (1.389–3.128) | 1.770*** (1.164–2.406) | 1.612 (0.987–1.927) |
| Rarely find help when troubled | 3.177** (1.930–5.228) | 3.667*** (2.355–5.710) | 2.867** (1.895–4.338) | 3.149*** (1.906–5.204) | 3.432*** (2.182–5.397) | 2.601** (1.690–4.003) |
| Never find help when troubled | 2.295*** (1.612–3.268) | 1.517*** (1.110–2.074) | 1.275** (1.031–1.929) | 2.085*** (1.758–3.616) | 1.674*** (1.277–2.452) | 1.379*** (1.196–2.174) |
Analysis of long-term care service needs revealed both universal demands and needs stratified by functional status in Figure 2. The desire for “health knowledge guidance” was consistently high across all clusters (19.3%–22.0%), indicating a universal priority for preventive education and health literacy among older adults regardless of their functional ability. Similarly, demand for “dining assistance” remained at a substantial and stable level across groups (13.8%–16.0%). In contrast, a clear gradient was observed for services directly related to personal care and support for daily living, with needs escalating significantly as functional status declined. For instance, demand for “home-based care services” increased from 10.2% in the healthy group to 28.1% in the severely disabled group. Needs for “caregiver guidance” (2.1%–16.3%), “bathing assistance” (1.2%–15.8%), “walking assistance” (1.2%–7.2%), and “rehabilitation services” (2.7%–15.6%) followed a similar steep positive gradient. Services such as “transportation,” “home modification,” “calling services,” and “emergency rescue” also showed significant, though less dramatic, increases with disability level. Notably, the need for “hospice care” was markedly elevated specifically in the severely disabled cluster (10.3%) compared to all others (<3.0%), representing a distinct requirement for end-of-life support within this specific subgroup. Conversely, interest in “legal support” was uniformly low (2.8%–4.4%) and did not demonstrate a clear functional gradient.
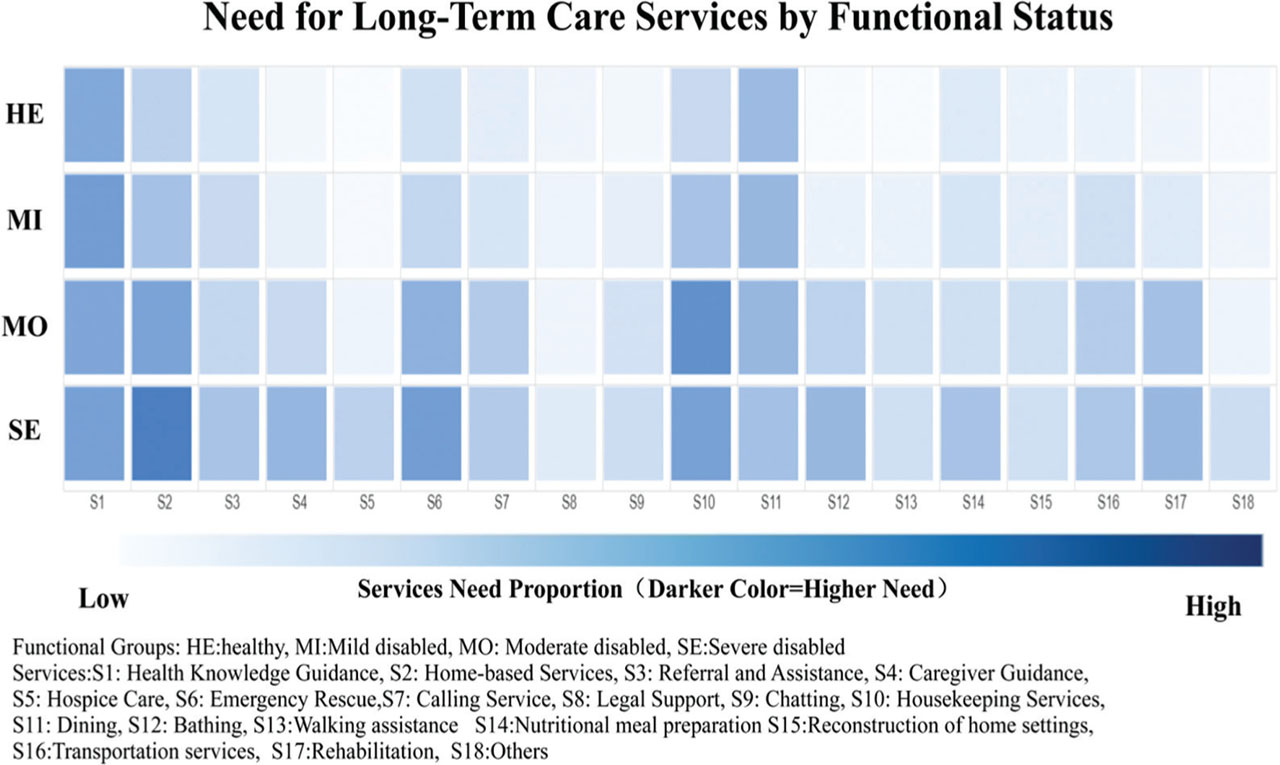
Figure 2.
The heatmap of need for long-term care services by functional status.
4. Discussion
In this cross-sectional study, we employed a clustering algorithm to segment community-dwelling older adults in Beijing into 4 distinct groups based on functional status, followed by a comprehensive comparison of their demographic, physiological, psychological, and social characteristics, as well as their expressed needs for LTC services. The primary aim was to identify differentiated LTC service demands that correspond to varying levels of functional ability among Chinese older adults. Given that ADLs and IADLs are widely adopted as core criteria for determining LTC service eligibility and intensity internationally, we utilized these standardized scores as the basis for clustering. To enhance generalizability beyond region-specific classification schemes, we applied a data-driven approach to uncover intrinsic groupings within the sample, thereby providing a functionally grounded segmentation framework that is both interpretable and transferable. To our knowledge, this is among the first studies in China to profile older adults using such a multidimensional clustering methodology within the context of LTC needs. While prior research has described functional differences in health or psychological domains, few have integrated physiological, psychological, social, and service-need variables into a unified classification model, especially with the explicit goal of informing LTC service design. Our findings therefore offer a structured and evidence-based typology that can assist policymakers and service planners in developing tiered, person-centered LTC packages under China’s expanding LTCI system.
Our findings further delineate distinct physiological profiles across functional clusters. Severely disabled older adults exhibited a higher burden of multimorbidity, polypharmacy, sensory impairments, and a history of falls compared to their healthier counterparts.19 These physiological challenges likely contribute to, and are exacerbated by, their functional decline, forming a complex cycle of vulnerability that underscores the need for integrated medical and supportive care. Interestingly, despite greater health needs, the severely disabled group reported a higher average monthly income. This may be attributed to their older average age, which encompasses a cohort that entered the workforce earlier and may include a higher proportion of veteran retirees who receive elevated pensions.20,21 This economic profile carries significant implications for China’s evolving LTCI system. Currently, LTCI financing in many pilot cities relies heavily on pooled medical insurance funds, with limited direct individual contributions. The substantial disposable income observed among some severely disabled individuals suggests an existing capacity to pay for enhanced care. Therefore, developing supplementary, market-oriented LTCI products with diversified service offerings appears financially viable.3 This segment, with both high care needs and relative purchasing power, could become primary beneficiaries of such commercial insurance schemes, while also alleviating pressure on the basic social insurance pool.
Older adults with disabilities in our study carried a significantly heavier burden of chronic conditions and a higher prevalence of polypharmacy. In China, chronic diseases are responsible for approximately 70% of disability-adjusted life-years (DALYs) lost, with cardiovascular diseases (13%), cancer (11%), and respiratory diseases (7%) being major contributors.22 Conditions such as dementia, stroke, and cancer are particularly potent drivers of long-term disability.23 Concurrently, polypharmacy, estimated to affect 42% of older adults, is a well-established risk factor for falls, cognitive and physical decline, and geriatric syndromes, thereby exacerbating functional impairment.24,25,26 These findings highlight a pivotal opportunity for LTCI systems. Integrating structured chronic disease and medication management into LTCI as reimbursable services is crucial for maintaining functional capacity and mitigating further disability progression among older adults. This integrated approach proactively addresses the underlying drivers of functional decline, optimizes treatment safety, and supports sustained independence, thereby reducing the long-term care burden.
Our findings underscore the importance of integrating targeted nutritional and weight management into LTC services. Low body weight (BMI <18.5kg/m2) was associated with increased disability risk, whereas being overweight (24 ≤BMI <28kg/m2) appeared relatively protective in this population. This aligns with evidence suggesting that all-cause mortality risk remains stable across a broad BMI range in older adults—approximately 20–28 kg/m2.27 However, our analysis further indicates that having a BMI above 28 or below 24 is more strongly associated with functional decline. Therefore, to help older adults maintain a weight within a favorable range and preserve functional capacity, LTC services should proactively combine tailored nutritional support, such as meal delivery or assisted dining, with structured health education on diet and physical activity.27
Sensory impairments is a significant risk factor for functional decline. Globally, over 180 million people aged 65 and above experience hearing loss that impedes normal conversation, which, if left unaddressed, can lead to communication barriers, social isolation, and loss of autonomy, and is often associated with anxiety, depression, and cognitive decline.28 Older adults with uncorrected hearing loss are often misperceived as cognitively slowed or impaired, a misconception that compounds social marginalization. Likewise, common visual impairments, such as presbyopia, cataract, and macular degeneration, not only limit mobility but also reduce social participation, elevate fall risk, and increase vulnerability to depression.29 These pathways illustrate how sensory impairment mediates the elevated risk of falls and psychological distress observed among disabled older adults. The World Health Organization (WHO) identifies sensory function as a core domain of “intrinsic capacity,” underscoring that its preservation is fundamental to maintaining quality of life in aging populations.8 Therefore, integrating regular sensory screening into preventive long-term care services is essential for early detection and intervention, forming a critical strategy to mitigate downstream disability and promote healthy aging.
Disability is closely linked to psychological distress and social isolation. As reported in the English Longitudinal Study of Aging, older adults with limitations in ADL face significantly higher odds of depression, anxiety, and loneliness compared to those without such limitations.30 This is partly attributable to reduced frequency of both in-person and remote social contact, which serves as a well-established risk factor for mental health decline.31,32 Our study further highlights that diminished neighborly interaction is a key manifestation of this social withdrawal. Such isolation can manifest as reluctance to share worries or seek help during difficulties. Sleep disturbances, also more common among those with ADL impairment, may explain the longer daytime sleep duration observed in our disabled groups, as poor nighttime sleep often leads to daytime compensatory sleep and lethargy.32 Therefore, psychological care and regular companionship should be formally incorporated into long-term care service packages, especially for older adults with severe functional impairment or pronounced psychosocial needs.
Consequently, integrating psychosocial support into LTC service packages is crucial. Informal caregivers, community volunteers, and structured peer-support models can effectively provide companionship and conversational support, helping to mitigate isolation and its associated mental health risks.33 Designing effective LTC services requires a nuanced understanding of needs across functional strata. Our findings demonstrate that service demands vary significantly by functional status. This aligns with the WHO’s conceptualization of healthy aging, which emphasizes the maintenance of functional ability—encompassing the capacity to meet basic needs, learn, make decisions, move, maintain relationships, and contribute to society. This framework argues for a shift from a reactive model, where services are provided only after significant function is lost, to a proactive, lifelong model that supports all older adults in maintaining their intrinsic capacity.8 Therefore, embedding comprehensive geriatric assessment (CGA) into LTC systems is essential to capture the full spectrum of an individual’s abilities and needs.34,35 This holistic assessment, combined with an understanding of the individual variation within functional groups, enables the design of more targeted, person-centered LTC packages.34,35
This study has several limitations. First, its cross-sectional design precludes causal inference regarding the relationships between functional status and other characteristics. However, our findings are consistent with longitudinal evidence from other large cohort studies. Second, the research was conducted only in Beijing; although we used a data-driven clustering approach to avoid reliance on local classification standards, further validation in other regions of China is warranted. Third, measures for several constructs like psychological status and sensory function relied on self-report or simplified items rather than full clinical scales, a choice made to limit respondent burden in a CGA.
5. Conclusions
This study segmented older adults into 4 functional clusters using a data-driven approach, revealing distinct profiles across health and social domains. To support healthy aging, LTC systems should prioritize integrating chronic disease management, medication review, nutritional monitoring, sensory screening, and psychosocial support into service packages.
The identified clusters and their associated needs provide an evidence-based reference for stratifying benefit design and refining eligibility criteria within China’s LTCI framework. Adopting such a functionally informed, tiered approach can enhance the precision and effectiveness of LTC delivery.