
Figure 1
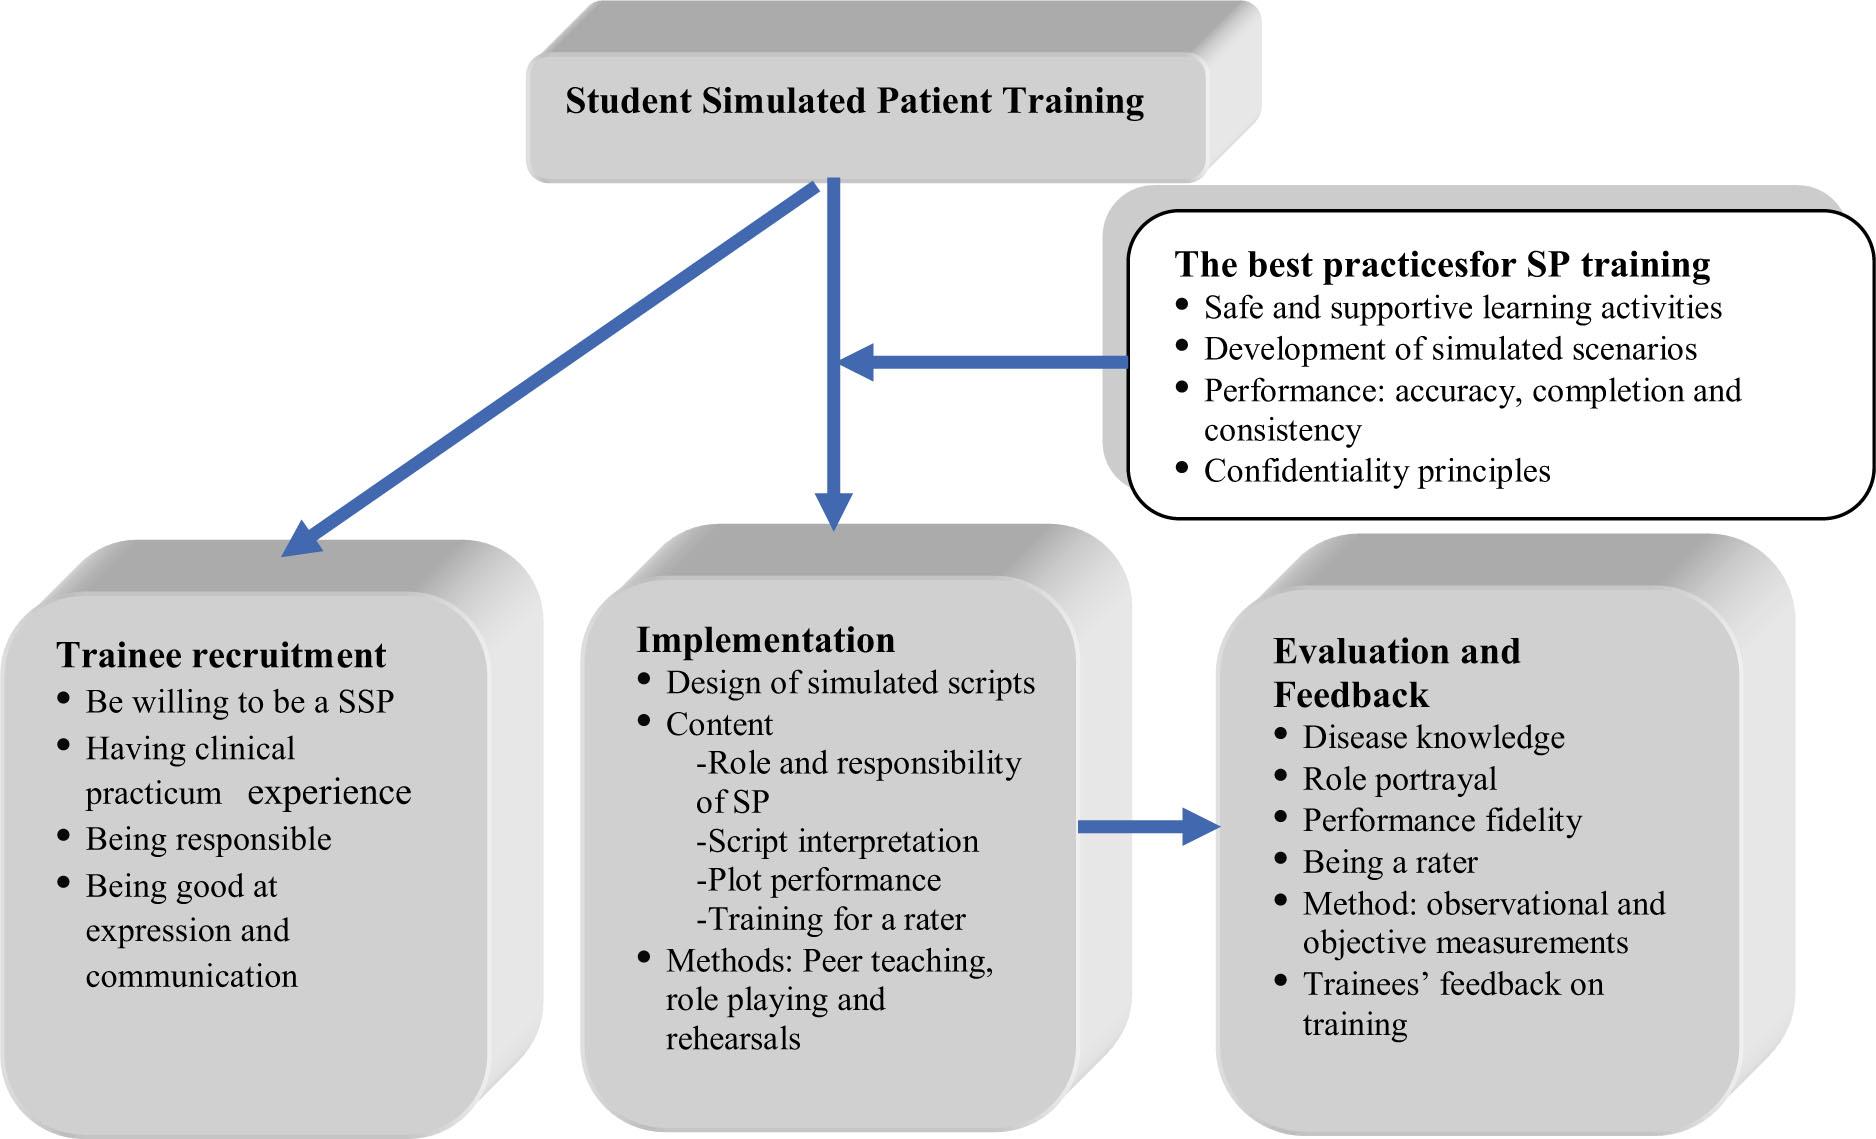
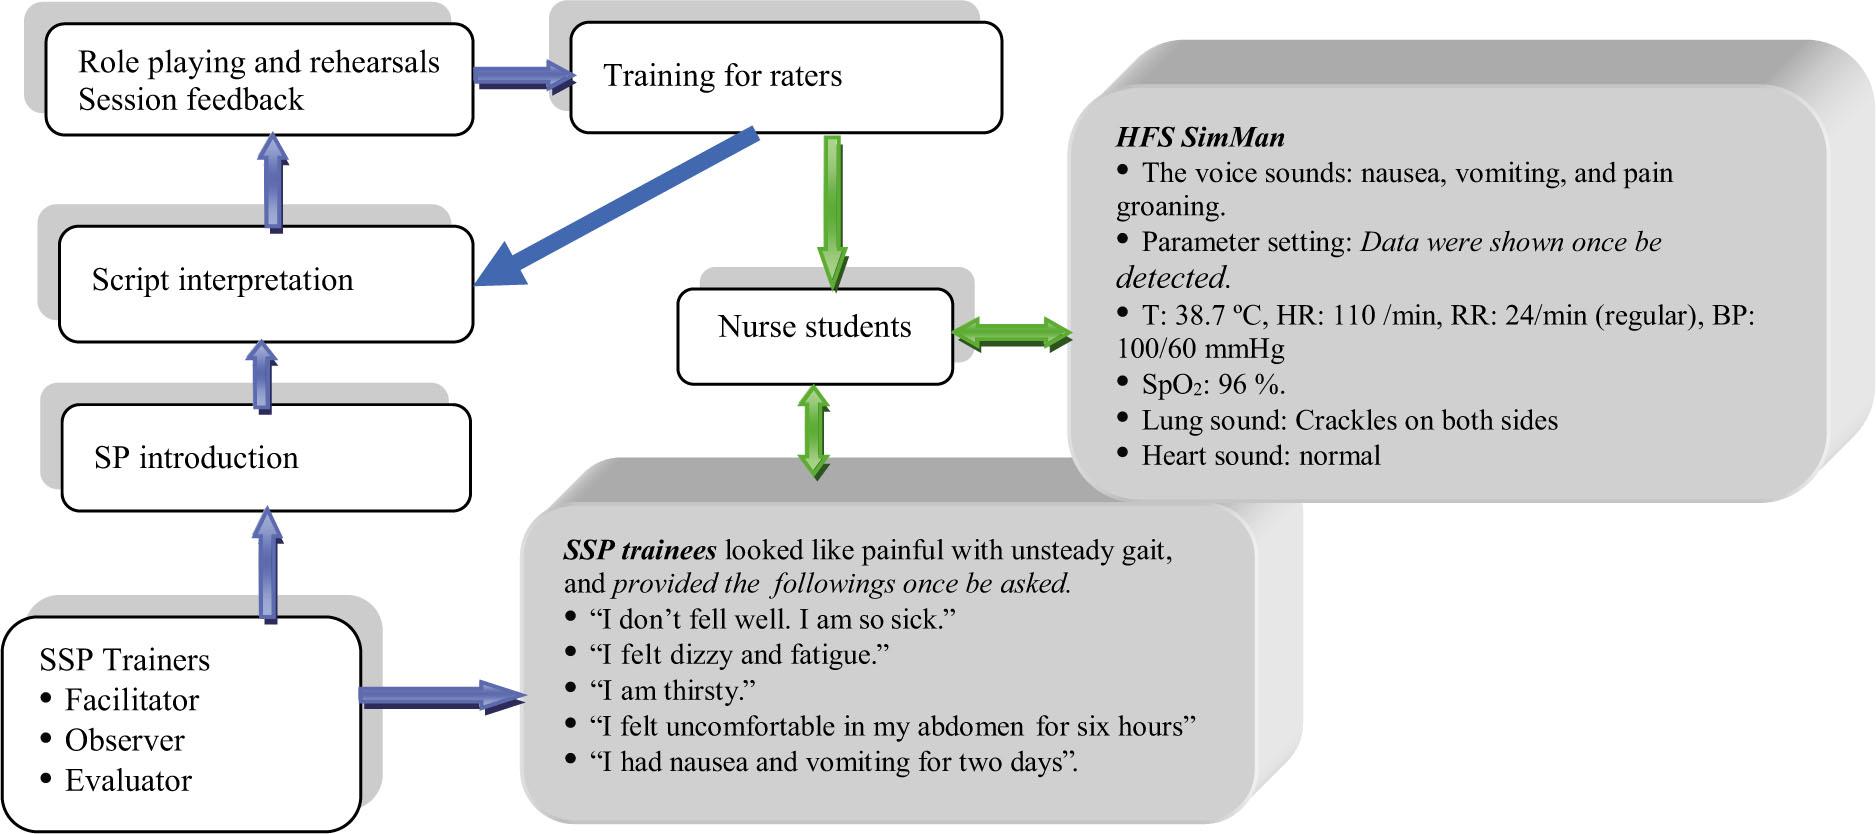
Figure 2
The weight of judgment basis (Ca)_
| Judgment basis | Large | Median | Small |
|---|---|---|---|
| Theoretical knowledge | 0.30 | 0.20 | 0.10 |
| Experience | 0.45 | 0.35 | 0.20 |
| References | 0.20 | 0.15 | 0.10 |
| Intuition | 0.05 | 0.05 | 0.05 |
Characteristics of participants in Delphi consultations (n = 20)_
| Characteristics | n | % | M ± SD |
|---|---|---|---|
| Age (years) | |||
| 30–39 | 3 | 15 | |
| 40–49 | 8 | 40 | |
| 50–59 | 9 | 45 | |
| Working area | |||
| Clinical nursing | 6 | 30 | |
| Nursing education | 10 | 50 | |
| Nursing management | 4 | 20 | |
| Academic degree | |||
| Bachelor of nursing science | 5 | 25 | |
| Master of nursing science | 8 | 40 | |
| Doctor of philosophy in nursing science | 7 | 35 | |
| Job title/classification | |||
| Senior registered nurse/senior lecturer | 5 | 25 | |
| Associate professors | 7 | 35 | |
| Professors | 8 | 40 | |
| Nursing administrator | 4 | 20 | |
| Nursing teacher/clinical preceptor | 16 | 80 | |
| Master supervisor | 9 | 45 | |
| Doctor supervisor | 5 | 25 | |
| Research expertise | |||
| Clinical nursing | 10 | 50 | |
| Nursing education | 16 | 80 | |
| Nursing management | 4 | 20 | |
| Years of experience in nursing | 25.55 ± 9.57 | ||
| 5–9 | 2 | 10 | |
| 9–19 | 3 | 15 | |
| 20–29 | 7 | 35 | |
| 30–40 | 8 | 40 | |
The descriptions of SSP evaluation indicators after expert consultations_
| Dimension | Indicator | Importance | Coefficient of variation | Weight | |
|---|---|---|---|---|---|
| Mean | SD | ||||
| 1. Disease knowledge | 3.87 | 0.63 | 0.16 | 0.211 | |
| 1.1. Symptoms and signs | 3.80 | 0.77 | 0.20 | 0.041 | |
| 1.2. Treatment and prognosis | 3.95 | 0.69 | 0.17 | 0.042 | |
| 1.3. Physical examinations, laboratory and imaging examinations | 3.85 | 0.75 | 0.19 | 0.043 | |
| 2. Role portrayal | 4.63 | 0.29 | 0.06 | 0.253 | |
| 2.1. Complete presentations of symptoms | 4.90 | 0.31 | 0.06 | 0.053 | |
| 2.2. Complete presentations of signs | 4.75 | 0.44 | 0.09 | 0.051 | |
| 2.3. Clear and fluent expression | 4.85 | 0.37 | 0.08 | 0.052 | |
| 2.4. Consistency with the script plot | 4.85 | 0.37 | 0.08 | 0.052 | |
| 2.5. Accurate and complete memory of plot lines | 4.85 | 0.37 | 0.08 | 0.052 | |
| 2.6. Accurate and complete memory of case data | 4.90 | 0.31 | 0.06 | 0.053 | |
| 2.7. Answer given only if be asked | 4.05 | 0.60 | 0.15 | 0.044 | |
| 2.8. Respond promptly | 3.90 | 0.85 | 0.22 | 0.042 | |
| 3. Performance fidelity | 4.83 | 0.35 | 0.07 | 0.264 | |
| 3.1. Mimicking symptoms | 4.95 | 0.22 | 0.05 | 0.054 | |
| 3.2. Mimicking signs | 4.85 | 0.37 | 0.08 | 0.052 | |
| 3.3. Mimicking tone and intonation | 4.75 | 0.55 | 0.12 | 0.051 | |
| 3.4. Mimicking facial features and expression | 4.80 | 0.52 | 0.11 | 0.052 | |
| 3.5. Mimicking postures and behaviors | 4.75 | 0.55 | 0.12 | 0.051 | |
| 3.6. Realistic psychological and emotional responses | 4.85 | 0.37 | 0.08 | 0.052 | |
| 4. Being a rater | 4.95 | 0.22 | 0.05 | 0.271 | |
| 4.1. Paying attention to students’ performance | 4.95 | 0.22 | 0.05 | 0.054 | |
| 4.2. Completion of assessment | 4.95 | 0.22 | 0.05 | 0.054 | |
| 4.3. Accuracy of assessment | 4.95 | 0.22 | 0.05 | 0.054 | |
The description of the coordination of expert consultations_
| Consultation | Item | Kendall’s Rank correlation test | |||
|---|---|---|---|---|---|
| Coordination coefficient (w) | Degrees of freedom | χ2 value | P value | ||
| First round | SSP training content | ||||
| Dimension | 0.377 | 4 | 30.159 | 0.000 | |
| Indicator | 0.326 | 16 | 104.400 | 0.000 | |
| SSP evaluation | |||||
| Dimension | 0.447 | 4 | 35.731 | 0.000 | |
| Indicator | 0.311 | 17 | 105.886 | 0.000 | |
| Second round | SSP training content | ||||
| Dimension | 0.918 | 3 | 55.091 | 0.000 | |
| Indicator | 0.548 | 16 | 175.351 | 0.000 | |
| SSP evaluation | |||||
| Dimension | 0.594 | 4 | 47.528 | 0.000 | |
| Indicator | 0.530 | 19 | 201.555 | 0.000 | |
The descriptions of SSP training content after expert consultations_
| Dimension | Indicator | Importance | Coefficient of variation | Weight | |
|---|---|---|---|---|---|
| Mean | SD | ||||
| 1. Role and responsibility of SP | 4.25 | 0.29 | 0.07 | 0.239 | |
| 1.1. SP concept | 3.95 | 0.60 | 0.15 | 0.053 | |
| 1.2. The performance is consistent with the plot of the play | 4.80 | 0.41 | 0.09 | 0.064 | |
| 1.3. Handling the events that may be encountered | 4.00 | 0.46 | 0.11 | 0.053 | |
| 1.4. Each performance is consistent | 4.65 | 0.59 | 0.13 | 0.062 | |
| 1.5. Punctuality and dedication | 3.85 | 0.49 | 0.13 | 0.051 | |
| 2. Script interpretation | 4.47 | 0.35 | 0.08 | 0.252 | |
| 2.1. Disease knowledge: symptoms, signs, treatment | 4.05 | 0.39 | 0.10 | 0.054 | |
| 2.2. The progress of script plot | 4.75 | 0.44 | 0.09 | 0.063 | |
| 2.3. Characteristics of patient | 4.85 | 0.37 | 0.08 | 0.065 | |
| 2.4. Health concerns | 4.70 | 0.57 | 0.12 | 0.063 | |
| 2.5. The relevant physical examinations, and laboratory and imaging examinations | 4.00 | 0.56 | 0.14 | 0.053 | |
| 3. Plot performance | 4.55 | 0.36 | 0.08 | 0.257 | |
| 3.1. Memory: medical history and health concerns | 3.75 | 0.69 | 0.17 | 0.049 | |
| 3.2. Demonstrations of symptoms | 4.80 | 0.41 | 0.09 | 0.064 | |
| 3.3. Demonstrations of signs | 4.80 | 0.52 | 0.11 | 0.064 | |
| 3.4. Demonstrations of psychological and emotional responses | 4.85 | 0.49 | 0.10 | 0.065 | |
| 4. Training for a rater | 4.45 | 0.44 | 0.10 | 0.251 | |
| 4.1. Assessment content | 4.80 | 0.52 | 0.11 | 0.064 | |
| 4.2. Scoring criteria for each indicator | 4.70 | 0.57 | 0.12 | 0.063 | |
| 4.3. Paying attention to students’ performance | 3.85 | 0.59 | 0.15 | 0.051 | |