

1. Introduction
In the contemporary business landscape, competition has become increasingly intense, compelling firms to innovate and pursue strategies that ensure long-term advantage. Strategic management research emphasizes a range of competitive pathways that organizations may adopt to improve their market standing (Abdulwase et al., 2020).
The acceleration of globalization, technological development, and volatile market dynamics has further underscored the importance of strong strategic frameworks. Among these, Porter’s (1980) generic competitive strategies (GCS) remain one of the most influential, outlining three essential approaches – cost leadership, differentiation, and focus. These strategies provide firms with structured options for positioning themselves in the market and enhancing their competitiveness (Porter, 1985; Marliyah et al., 2023).
Porter argued that firms must continuously adapt and refine their strategies to maintain advantage in turbulent environments characterized by shifting markets and rapid technological change (Charles and Benson Ochieng, 2023). Organizations may even combine strategies in pursuit of their goals and superior performance (Peter and Okello, 2023). In contrast, neglecting to adopt such approaches often leads to a weak or absent competitive advantage (CA) (Faraj et al., 2021). Strategic decisions are, therefore, closely tied to segmentation choices, internal capabilities, competitor behavior, and organizational responses (Daneshvar and Ramesh, 2010).
Competitive strategy emerges from deliberate managerial choices aimed at strengthening a firm’s position in crowded markets (Mohammed et al., 2017). Through the adoption of these strategies, firms can better withstand competition, achieve growth, and outperform rivals (Singh and Dhir, 2021; Zhu and Westphal, 2021). In the absence of sustainable advantage, companies are restricted to normal returns, comparable to the outcomes of other investments with similar risk profiles (Khan et al., 2021a, b).
While Porter’s framework has been applied in many industries worldwide, there remains a gap in understanding its impact in sector-specific contexts within developing economies. Egypt’s leather industry illustrates such a case: a sector that is economically significant yet rarely examined in academic research. The industry contributes to national development by supporting employment and exports, while simultaneously serving a large domestic consumer base fueled by the country’s substantial population. Nevertheless, the sector faces challenges such as international competition and quality-related constraints, highlighting the need for empirical investigation into how firms in this context deploy competitive strategies.
This study seeks to address this contextual gap by analyzing how Porter’s GCS shape CA in Egypt’s leather industry. Specifically, the objectives are to
Assess the impact of cost leadership on CA.
Evaluate how differentiation contributes to market positioning and CA.
Explore the role of focus strategies (both cost and differentiation focus) in driving advantage within niche markets.
By tackling these objectives, the study highlights strategic pathways available to firms in the leather sector to build and sustain CA. In addition to offering practical guidance for managers in aligning strategies with organizational goals and market realities, this research adds to the literature by situating Porter’s framework in a developing-country manufacturing context that has been relatively underexplored
2. Literature Review
2.1. GCS
Michael Porter’s GCS, first introduced in the early 1980s, continue to serve as a foundation in strategic management studies by offering structured approaches for achieving sustainable CA. Porter identified three fundamental strategies – cost leadership, differentiation, and focus – that allow firms to establish distinct competitive positions within their industries.
This framework is often viewed in connection with the resource-based view, which emphasizes internal resources and capabilities as essential for competitive success. According to Barney (1991), resources must be valuable, rare, inimitable, and non-substitutable to generate enduring advantage. From this perspective, organizational resources play a central role in supporting the effective execution of Porter’s strategies (Ray et al., 2004; Dixit et al., 2021).
The dynamic capabilities perspective further extends this view, stressing the importance of a firm’s ability to reconfigure and adapt resources in response to environmental turbulence (Teece et al., 1997). This complements Porter’s positioning framework by underscoring agility, learning, and innovation as key to maintaining long-term competitiveness.
Over time, Porter’s model has been applied across diverse industries as a means of categorizing competitive approaches (Akan et al., 2006). Its adaptability allows firms of varying size and scope to employ it successfully (Herbert and Deresky, 1987; Marliyah et al., 2023). When executed effectively, these strategies can result in superior performance, enabling organizations to exploit opportunities and outperform rivals (Romeo Magada and Oloko, 2018; Friesenbichler and Reinstaller, 2022).
Nevertheless, outcomes differ across industries. Manufacturing sectors often emphasize cost leadership because of the role of economies of scale and efficiency (Porter, 1998). Service providers tend to prioritize differentiation due to the importance of customer experience (Lovelock and Wirtz, 2019). Technology-based firms frequently combine differentiation with hybrid strategies to maintain competitiveness (Christensen et al., 2015). These variations highlight the continued relevance of Porter’s framework for firms navigating diverse competitive environments.
2.2. Cost Leadership Strategy (CLS) and CA
Cost leadership seeks to position the firm as the lowest-cost producer in its industry, enabling it to provide competitive prices without undermining quality. Zain et al., (2021) describes this strategy as a set of coordinated actions that deliver products more efficiently than competitors while meeting customer expectations. By doing so, firms can expand market share, improve distribution channels, and establish barriers to entry (Khan et al., 2021a).
Key levers include reducing production costs, exploiting economies of scale, and improving resource utilization (Porter, 2008a, b; Abdullah and Anwar 2021). With time, industry experience often enhances operational efficiency (Top and Ali, 2021). Practices such as lean management, supply chain optimization, and outsourcing non-core functions also reinforce cost leadership (Bhattarai, 2018; Johnson and Scholes, 2019).
Cost advantage allows companies to either set lower prices or maintain higher profit margins, leveraging their cost efficiency to stay competitive.
However, long-term success requires striking a balance between efficiency and quality. Sustainable cost leadership depends on continuous improvement, operational excellence, and maintaining acceptable quality standards (Porter, 1998; Jerab and Mabrouk, 2023). Properly implemented, this strategy can deliver enduring CA, particularly in production-intensive industries.
2.3. Differentiation Strategy (DS) and CA
Differentiation involves offering products or services with attributes that customers perceive as unique and valuable. Innovation, branding, design, and quality are central to this approach (Porter, 1985; Kim and Mauborgne, 2021). By emphasizing superior features or services, firms can command premium prices and foster stronger loyalty (Wheelen and Hunger, 2011; Grant, 2021).
This strategy also weakens buyer power and reduces the threat of substitutes, as loyal customers perceive added value beyond functional benefits (Haseeb et al., 2019; Thompson et al., 2020). Firms can pursue differentiation through brand identity, technological innovation, or targeted marketing (Akoi et al., 2021). Because such uniqueness is challenging to replicate, differentiation often provides sustainable advantages (Widuri and Sutanto, 2018).
Maintaining differentiation, however, requires ongoing innovation and responsiveness to market needs. Firms must continuously align their unique offerings with customer expectations to preserve competitive positioning (Singh and Dhir, 2021).
2.4. Focus Strategy (FS) and CA
Focus strategies concentrate on serving specific market segments more effectively than competitors, either through cost focus or differentiation focus (Aldehayyat and Anchor, 2008). By narrowing their scope, firms allocate resources efficiently and tailor offerings to niche customers (Camilleri, 2018; Ali and Anwar, 2021).
Successful implementation relies on strong segmentation and brand identity (Kotler and Keller, 2016). Cost focus strategies target price-sensitive groups with lower-cost solutions (Wanjogo and Mwathe, 2022), whereas differentiation focus emphasizes distinctive features for niche buyers (Knight and Cavusgil, 2018). Careful segment selection – large enough for growth, but unattractive to large competitors – is crucial (David, 2017).
Despite its advantages, the focus approach carries risks if niche markets decline or consumer needs shift. Firms must remain adaptive to sustain relevance (Islami et al., 2020). When effectively managed, focus strategies enable firms to build expertise, strengthen customer loyalty, and secure a long-term competitive edge.
2.5. Hypothesis Development
Based on the previous literatures, the hypotheses of the study can be expressed as follows:
(1) There is a statistically significant relationship between CLS and CA.
(2) There is a statistically significant relationship between DS and CA.
(3) There is a statistically significant relationship between FS and CA.
2.5.1. Conceptual framework
The aim of this study is to test the relationship between generic strategies and CA. Generic strategies are the independent variables that influences the firm’s CA, which is the dependent variable in this study. Figure 1 illustrates the research variables and the proposed estimation models.
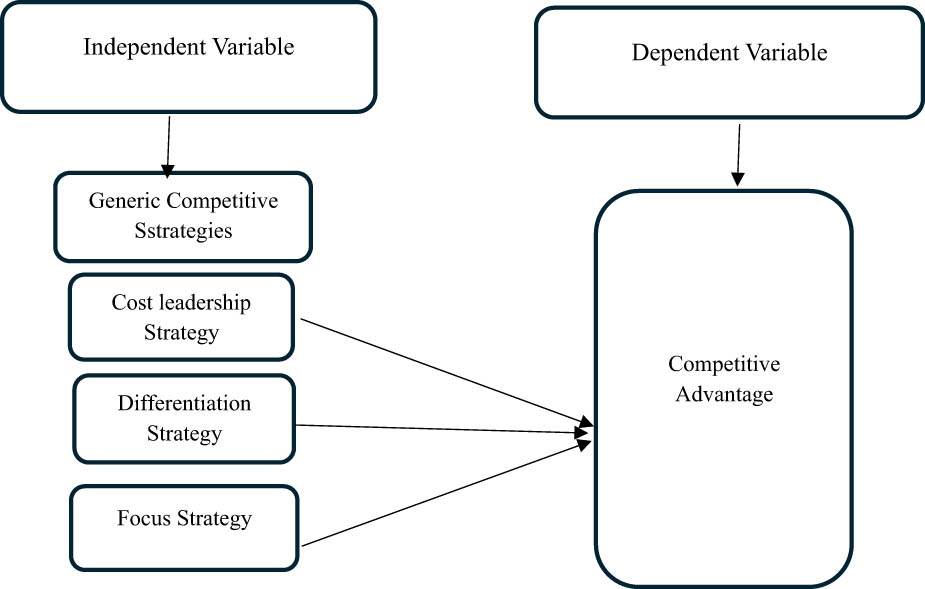
Figure 1
Research model, created by the researcher.
(Source: Author’s own research)
3. Research Methodology
3.1. Research Design
The study follows a quantitative design, examining GCS – cost leadership, differentiation, and focus – as independent variables, with CA as the outcome variable. A research framework and hypotheses were constructed to guide the analysis. Data were obtained using a structured questionnaire, adapted with minor modifications from established studies to reflect the Egyptian leather industry context. The survey instrument contained 36 items in total: 24 items related to the three competitive strategies and 12 items addressing CA.
3.2. Context, Sample, and Data Collection
Egypt’s leather industry was chosen as the research setting because of its economic importance and strategic relevance. The sector provides substantial employment opportunities, contributes to export growth, and meets strong domestic demand driven by Egypt’s large consumer base. Despite its significance, little empirical research has been carried out on how firms in this industry apply competitive strategies, which makes it a suitable context for extending Porter’s framework.
The target population comprised senior managers working in firms within Egypt’s leather sector, estimated at about 17,600 managers. The determination of the sample size was based on the following equation:
whereZ = the standard scores corresponding to the confidence level 95% used in social research, which is 1.96.
p = the percentage of individuals who are subject to study of the target population, which is 50%.
q = the complement of p 50%.
e = the allowable error of estimate in social research, which equals 4%.
n = the sample size.
N = the population size.
To ensure coverage and reliability, 650 questionnaires were distributed. After screening and excluding incomplete or inconsistent responses, 600 valid questionnaires were retained for analysis. These responses came from managers representing 116 firms, listed in the Appendix to ensure transparency.
A pilot test involving 80 participants was conducted to evaluate the clarity and relevance of the survey questions. Based on the feedback, revisions were made before the full distribution. The finalized questionnaire was divided into two parts: the first assessed the independent variables – GCS (cost leadership, differentiation, and focus) – while the second evaluated the dependent variable, CA.
3.3. Variables and Measurement
All study variables were measured using previously validated scales adapted from earlier research. Items were presented in the form of closed-ended statements on a five-point Likert scale. To prepare the data for statistical analysis, responses were aggregated into weighted means, converting ordinal-level measures into ratio-level data suitable for parametric tests. Analytical techniques such as Pearson’s correlation and multiple regression were applied. GCS were captured using 24 items adapted from Mohammed and Rugami (2019), while CA was measured with 12 items adapted from Vicky (2020).
4. Data Analysis and Results
The data were analyzed using STATA version 9.02, following a systematic sequence of statistical procedures:
Reliability testing: Cronbach’s alpha was employed to evaluate the internal consistency and reliability of the measurement items for each construct.
Normality assessment: Tests of normality were carried out on all study variables to verify compliance with the assumptions required for parametric analysis.
Correlation analysis: Karl Pearson’s correlation coefficient was calculated to examine the strength and direction of associations between the variables.
Regression modeling: Multiple regression analysis was then applied to identify the most appropriate model and determine the extent to which the independent variables explain variations in CA.
4.1. Reliability and Validity
Table 1 presents the values of Cronbach’s alpha and the validity coefficients for each of the constructs measured in the questionnaire.
Table 1
Reliability and validity coefficients of study variables.
| Variables and symbols | Cronbach’s alpha | Validity |
|---|---|---|
| Cost leadership strategy (CLS) X 1 | 0.989 | 0.990 |
| Differentiation strategy (DS) X 2 | 0.980 | 0.989 |
| Focus strategy (FS) X 3 | 0.989 | 0.995 |
| Generic competitive strategies (GCS) X | 0.978 | 0.989 |
| Competitive advantage (CA) Y | 0.977 | 0.995 |
| Minimum value | 0.977 | 0.989 |
(Source: Author’s own research)
As presented in Table 1, the lowest recorded Cronbach’s alpha value was 0.977, while the smallest validity coefficient reached 0.989. These high values indicate strong internal consistency and measurement validity. At the 95% confidence level, the results confirm that the dataset is both reliable and valid, allowing it to serve as a sound basis for further statistical analysis and hypothesis testing.
4.2. Normality Testing
To assess the distribution of the data, Levene’s test for equality of variances was applied. This procedure is considered more robust than many conventional tests, as it does not heavily rely on the assumption of perfect normality. The test operates by calculating the absolute deviation of each observation from its group mean, followed by conducting a one-way analysis of variance on these deviations.
The assumptions underlying this procedure are as follows:
The samples drawn from the populations under investigation must be independent.
The populations themselves should approximate a normal distribution.
Table 2 reports the normality assessment results for all variables along with their corresponding Levene’s test values.
Table 2
Shapiro–Wilk and Levene’s test results for normality and homogeneity.
| Tests of normality and equal variance | Shapiro–Wilk statistic | P-value |
|---|---|---|
| CLS X 1 | 0.997 | 0.059 |
| DS X 2 | 0.984 | 0.062 |
| FS X 3 | 0.993 | 0.342 |
| GCS X | 0.997 | 0.537 |
| CA Y | 0.987 | 0.532 |
| Levene’s test | 0.987 | 0.552 |
(Source: Author’s own research)
As presented in Table 2, all Shapiro–Wilk test p-values are above 0.050, confirming that the study variables follow a normal distribution with equal variance. Similarly, the Levene’s test p-value is greater than 0.050, indicating that the assumption of homogeneity of variances is satisfied across all variables.
4.3. Correlation Between Study Variables
To examine the hypotheses, Pearson’s correlation coefficients were computed for each pair of study variables. The results produced by the analysis are presented in Table 3.
Table 3
Correlation matrix of independent and dependent variables.
| Independent variables/dependent variable | CA Y | |
|---|---|---|
| CLS X 1 | R | 61.0% |
| Sig. value | <0.001 | |
| DS X 2 | R | 93.2% |
| Sig. value | <0.001 | |
| FS X 3 | R | 67.1% |
| Sig. value | <0.001 | |
(Source: Author’s own research)
Table 3 indicates that the significance (Sig.) values for the dependent variable and all independent variables fall below the 5% threshold. This result demonstrates, at the 95% confidence level, the presence of statistically significant and positive associations between the dependent and independent variables. Furthermore, Pearson’s correlation coefficients were computed to explore the strength and direction of the relationships between each of the independent variables and the dependent variable. The outcomes are presented in Table 4.
Table 4
Correlation matrix of the main independent and dependent variable.
| Variables | GCS X | |
|---|---|---|
| CA Y | R | 87.8% |
| Sig. | <0.001 |
(Source: Author’s own research)
Table 4 indicates a positive and statistically significant relationship between the main independent variable, GCS (X), and the dependent variable, CA (Y).
4.4. Regression Analysis
Regression analysis serves as a key statistical technique for examining the relationship between variables (Alan O. Sykes, 1993). Its primary purpose is to estimate how changes in one variable influence or predict variations in another. Table 5 summarizes the analysis of variance (ANOVA) results for the estimated regression models, with detailed outputs provided in Tables A1 and A2 in the appendix.
Table 5
ANOVA summary for regression models.
| Models | Dependent variable | Independent variables | R 2 | Sig. |
|---|---|---|---|---|
| Model 1: Y = f(X) | CA Y | GCS X | 77.2% | <0.001 |
| Model 2: Y = f(X 1) | CA Y | CLS X 1 | 37.2% | <0.001 |
| Model 3: Y = f(X 2) | CA Y | DS X 2 | 86.8% | <0.001 |
| Model 4: Y = f(X 3) | CA Y | FS X 3 | 45.1% | <0.001 |
(Source: Author’s own research)
From Table 5, the following findings were obtained:
Model 1: At the 95% confidence level, the results confirm that the overall independent variable, GCS, has a significant effect on the dependent variable, CA. The model achieved a coefficient of determination of 77.20%, with a significance value below 0.001.
Model 2: Evidence also shows that CLS significantly influences CA, explaining 37.20% of the variation. The significance value for this model was likewise below 0.001.
Model 3: The analysis indicates that DS exerts a strong and statistically significant impact on CA, with an R² of 86.80% and a significance level under 0.001.
Model 4: Finally, the results demonstrate that FS also contributes positively to CA, with a coefficient of determination of 45.10% and a significance value below 0.001.
The coefficients of the regression models, along with their standard errors, t-statistics, and 95% confidence intervals, are provided in Appendix Tables A1 and A2. Based on these results, the estimated regression models are summarized as follows:
5. Discussion
This study aimed to explore the impact of GCS on the CA of Egypt’s leather industry, utilizing Porter’s (1980) framework. This framework identifies cost leadership, differentiation, and focus as essential strategic approaches. The findings provide robust support for all three hypotheses, confirming that each strategy positively contributes to CA, albeit with varying degrees of impact. Notably, the DS emerged as the most influential, followed by CLS, with the FS having the least significant effect.
The results reveal strong statistical relationships between GCS and CA, corroborated by multiple regression analyses. Each independent variable, representing distinct aspects of GCS, shows a significant positive correlation with CA, evidenced by p-values below the 5% threshold. This reinforces the idea that the observed relationships are not coincidental. As illustrated in Table 5, all independent variables significantly impact CA at a 95% confidence level. Furthermore, Pearson’s correlation coefficient confirms these findings, showing a positive and significant association between GCS and CA.
The regression models presented in Table 5 offer critical insights into the effects of each strategy. Model 1 indicates that GCS collectively significantly influence CA, with a coefficient of determination (R²) of 77.20%. This statistic indicates that 77.2% of the variation in CA can be attributed to GCS, with a significance value (Sig. < 0.001) that enhances confidence in this model.
In Model 2, which focuses on the CLS, a significant effect on CA is identified, with an R² of 37.20%. While this impact is lower compared to other models, it underscores the necessity of adopting a CLS, particularly for firms in price-sensitive markets aiming to sustain or improve their competitive stance. This supports the findings of Jerab and Mabrouk (2023), who highlighted that cost leadership can be a powerful way for businesses to achieve CA.
Model 3, examining the DS, reveals the highest impact on CA, with an R² of 86.80%. This is in line with the research by Widuri and Sutanto (2018), which stated that the use of product DS becomes more sustainable, and it earns an organization more profits and an edge that is not easily duplicable by rivals This suggests that differentiation, characterized by the development of unique products or services, serves as an effective means for companies to achieve CA, aligning with Kim and Mauborgne (2021) who argued that continuous innovation is essential for creating customer value, which ultimately fosters CA. The strong statistical significance (Sig. < 0.001) reaffirms differentiation as a powerful strategy for enhancing competitiveness. Haseeb et al., (2019) also suggested that product differentiation enhances a firm’s competitiveness by making substitutes less attractive, as consumers perceive unique value in differentiated offerings.
Model 4 explores the FS, which shows an R² of 45.10%. Although its impact on CA is moderate, it remains a significant factor in competitive positioning. Companies employing this strategy, targeting niche markets, can gain CA, even though its influence is less pronounced compared to differentiation and overall GCS. Ali and Anwar (2021) emphasized that by narrowing their market scope, firms can concentrate their resources on delivering value to a well-defined audience, which in turn fosters CA.
Overall, the findings suggest that all independent variables – whether GCS as a whole or specific strategies like CLS, DS, and FS – positively and significantly affect CA. This supports the hypothesis that the adoption of GCS is crucial for firms aiming to enhance their competitive position. Moreover, the regression analysis quantifies the impact of each strategy, with high R² values for GCS and DS indicating that these strategies are essential drivers of competitive success.
It is important to recognize, however, that while regression models illustrate strong associations between variables, they do not establish direct causation. Future research could investigate additional factors influencing CA beyond the scope of this analysis, such as market dynamics and external environmental factors.
This study reinforces the importance of GCS in fostering CA within Egypt’s leather industry. It underscores that strategic alignment with market demands is crucial for organizational success, aligning with existing literature that highlights the significance of Porter’s generic strategies framework in achieving a competitive edge. By confirming the efficacy of GCS in the context of Egypt’s leather industry, this research contributes to the ongoing discourse on strategic management practices and their implications for industry performance.
6. Conclusion
This study investigated the influence of GCS on the CA of Egypt’s leather industry, applying Michael Porter’s (1980) framework. The findings show that all three strategies – CLS, DS, and FS – contribute significantly to CA, with differentiation exerting the strongest effect, followed by cost leadership and focus. Regression and correlation analyses confirm the strength of these relationships, emphasizing that firms adopting these strategies are more likely to secure and sustain superior performance.
The contributions of this research are both theoretical and practical. Theoretically, the results reaffirm core strategic management perspectives that highlight the role of competitive strategies in shaping organizational outcomes. Practically, the study offers valuable guidance for managers in the leather industry, demonstrating that carefully chosen strategies aligned with specific market conditions can strengthen competitive positioning and long-term success.
Looking ahead, firms are encouraged to integrate strategic choices with evolving market demands, technological advances, and consumer expectations, as this alignment is critical for maintaining competitiveness. Future research should also examine additional external and organizational variables that influence CA to build a more holistic understanding of strategic effectiveness in developing economies. By embracing adaptive and well-aligned strategies, organizations can better navigate competitive pressures and secure sustainable advantages in dynamic business environments.
Acknowledgements
Not applicable.
Funding Information
The research was not supported by any external funding.
Author Contributions
The author solely contributed to the conceptualization, methodology, formal analysis, investigation, data curation, writing – original draft preparation, writing – review and editing, visualization, and supervision of the study. The author has read and approved the final version of the manuscript.
Conflict of Interest Statement
The author states no conflict of interest.
Data Availability Statement
The datasets generated and analyzed during the current study are available from the corresponding author upon reasonable request.
Appendices
Appendix
Table A1
Coefficients of regression models, standard error (SE), t-statistic, 95% confidence intervals.
| Models | Coefficient | SE | T-statistic | Sig. | LL | UL |
|---|---|---|---|---|---|---|
| Intercept | −0.040 | 0.082 | −0.485 | 0.628 | −0.202 | 0.122 |
| GCS (X) | 1.031 | 0.023 | 44.965 | <0.001 | 0.986 | 1.076 |
| R-squared | 77.20% | |||||
| Model 2: Y = f ( X 1 ) | ||||||
| Intercept | 0.924 | 0.145 | 6.371 | <0.001 | 0.639 | 1.208 |
| CLS (X 1) | 0.724 | 0.038 | 18.824 | <0.001 | 0.648 | 0.799 |
| R-squared | 37.20% | |||||
| Model 3: Y = f ( X 2 ) | ||||||
| Intercept | 0.287 | 0.054 | 5.310 | <0.001 | 0.181 | 0.394 |
| DS (X 2) | 0.922 | 0.015 | 62.693 | <0.001 | 0.893 | 0.951 |
| R-squared | 86.80% | |||||
| Model 4: Y = f ( X 3 ) | ||||||
| Intercept | 1.729 | 0.088 | 19.691 | <0.001 | 1.557 | 1.902 |
| FS (X 3) | 0.571 | 0.026 | 22.154 | <0.001 | 0.521 | 0.622 |
| R-squared | 45.10% | |||||
(Source: Author’s contribution)
LL = Lower Limit of the 95% Confidence Interval; UL = Upper Limit of the 95% Confidence Interval.
Table A2
Analysis of variance of regression models for each independent variable.
| Source | DF | R² | Sum of squares | Mean square | F-ratio | Sig. |
|---|---|---|---|---|---|---|
| ANOVA model 1: Y = f ( X ) common model for the independent variables | ||||||
| Model | 1 | 77.20% | 211.988 | 211.988 | 2021.851 | <0.001 |
| GCS (X) | 1 | 77.20% | 211.988 | 211.988 | <0.001 | |
| Error | 598 | 22.80% | 62.699 | 0.105 | ||
| Total | 599 | 100.00% | 274.687 | |||
| ANOVA model 2: Y = f ( X 1 ) common model for the independent variables | ||||||
| Model | 1 | 37.20% | 102.206 | 102.206 | 354.355 | <0.001 |
| CLS (X 1) | 1 | 37.20% | 102.206 | 102.206 | <0.001 | |
| Error | 598 | 62.80% | 172.481 | 0.288 | ||
| Total | 599 | 100.00% | 274.687 | |||
| ANOVA model 3: Y = f ( X 2 ) common model for the independent variables | ||||||
| Model | 1 | 86.80% | 238.413 | 238.413 | 3930.400 | <0.001 |
| DS (X 2) | 1 | 86.80% | 238.413 | 238.413 | <0.001 | |
| Error | 598 | 13.20% | 36.274 | 0.061 | ||
| Total | 599 | 100.00% | 274.687 | |||
| ANOVA model 4: Y = f ( X 3 ) common model for the independent variables | ||||||
| Model | 1 | 45.10% | 123.822 | 123.822 | 490.808 | <0.001 |
| FS (X 3) | 1 | 45.10% | 123.822 | 123.822 | <0.001 | |
| Error | 598 | 54.90% | 150.865 | 0.252 | ||
| Total | 599 | 100.00% | 274.687 | |||
(Source: Author’s contribution)