

Figure 1.
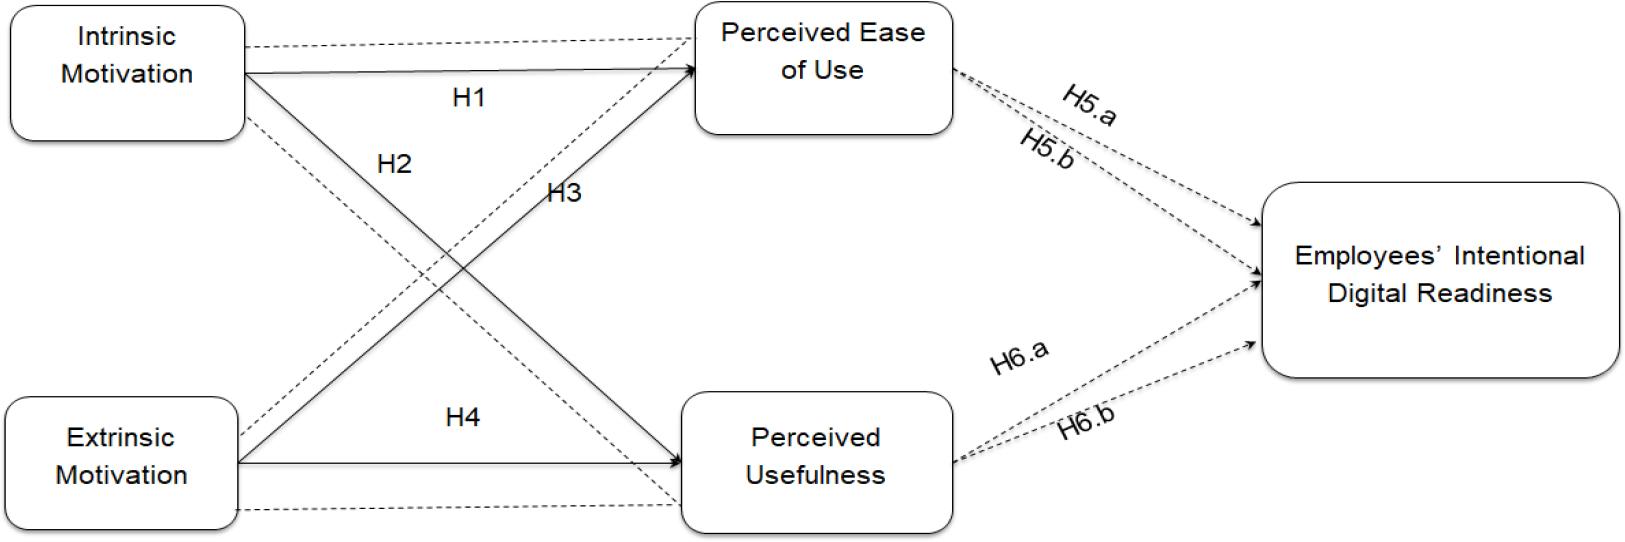
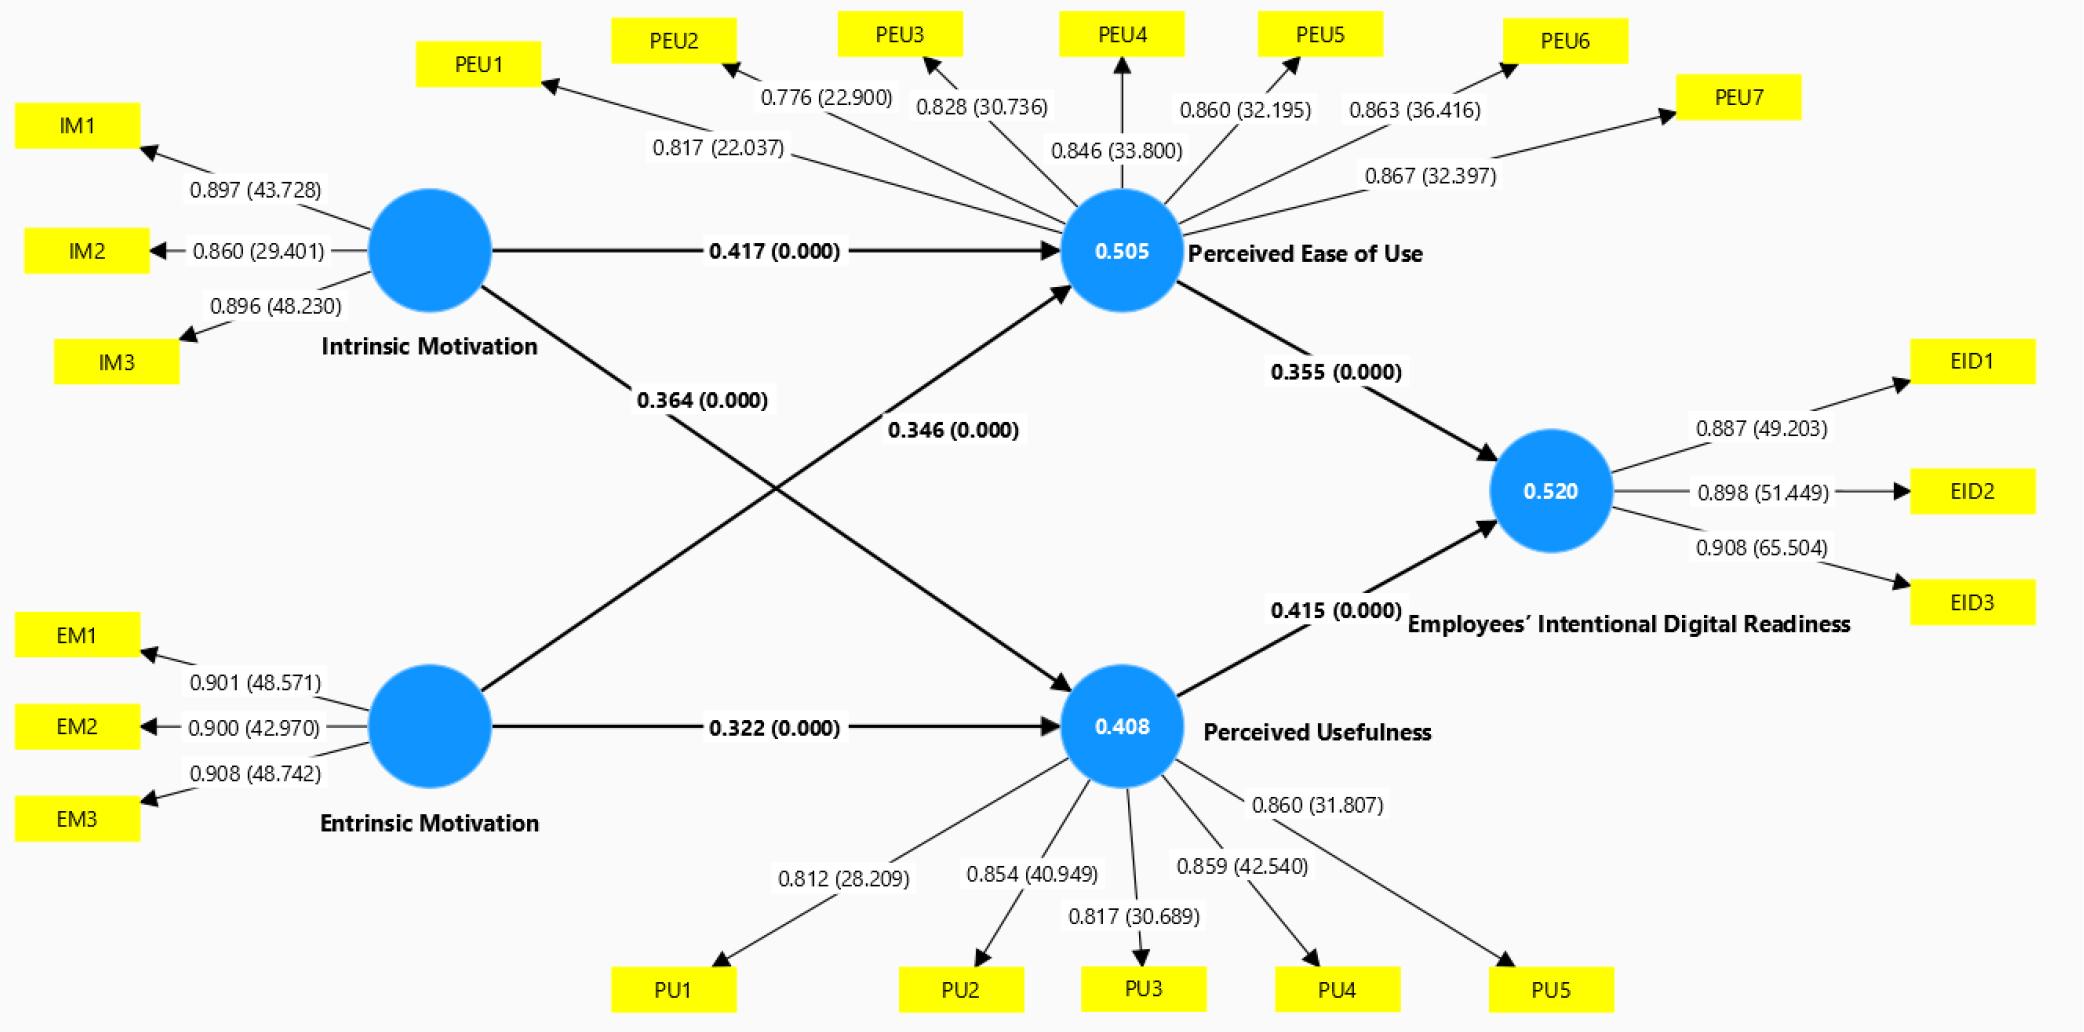
Figure 2.
Descriptive Statistics (Source: Respondents profile)
| Characteristics | Frequency | Percentage |
|---|---|---|
| Gender | ||
| Male | 140 | 59.07% |
| Female | 97 | 40.93% |
| Age (years) | ||
| 18 to < 25 | 63 | 26.58% |
| 25–34 | 101 | 42.62% |
| 35–44 | 57 | 24.05% |
| 45–54 | 16 | 6.75% |
| Job position | ||
| Back office | 112 | 47.26% |
| Frontliner | 125 | 52.74% |
| Work locations | ||
| Branches | 181 | 76.37% |
| Head offices | 56 | 23.63% |
| Length of services at work (years) | ||
| <2 | 41 | 17.30% |
| 2–5 | 101 | 42.62% |
| 6–10 | 51 | 21.52% |
| >10 | 44 | 18.57% |
Construct Validity and Reliability (Source: PLS-algorithm result, authors’ interpretation (1))
| Construct | Items | Outer loading | Cronbach’s alpha | Composite reliability (rho_a) | Composite reliability (rho_c) | Average variance extracted (AVE) |
|---|---|---|---|---|---|---|
| Intrinsic motivation | MI1 | 0.897 | - | - | - | - |
| MI2 | 0.860 | 0.862 | 0.873 | 0.915 | 0.783 | |
| MI3 | 0.896 | - | - | - | - | |
| Extrinsic motivation | ME1 | 0.901 | - | - | - | - |
| ME2 | 0.900 | 0.887 | 0.888 | 0.930 | 0.815 | |
| ME3 | 0.908 | - | - | - | - | |
| Perceived ease of use | PEU1 | 0.817 | - | - | - | - |
| PEU2 | 0.776 | - | - | - | - | |
| PEU3 | 0.828 | - | - | - | - | |
| PEU4 | 0.846 | 0.929 | 0.931 | 0.942 | 0.701 | |
| PEU5 | 0.860 | - | - | - | - | |
| PEU6 | 0.863 | - | - | - | - | |
| PEU7 | 0.867 | - | - | - | - | |
| Perceived usefulness | PU1 | 0.812 | - | - | - | - |
| PU2 | 0.854 | - | - | - | - | |
| PU3 | 0.817 | 0.896 | 0.900 | 0.923 | 0.707 | |
| PU4 | 0.859 | - | - | - | - | |
| PU5 | 0.860 | - | - | - | - | |
| Employees’ intentional digital readiness | EID1 | 0.887 | 0.880 | |||
| EID2 | 0.898 | 0.883 | 0.926 | 0.806 | ||
| EID3 | 0.908 | - | - | - |
Hypothesis Testing (Source: Bootstrapping result, authors’ interpretation)
| Relationship | Path Coef. | VIF-inner | T-statistics | P-value | R2 | f2 | Decision |
|---|---|---|---|---|---|---|---|
| IM > PEU | 0.417 | 2.131 | 5.191 | 0.000 | 0.505 | 0.165 | Supported |
| IM > PU | 0.364 | 2.131 | 4.028 | 0.000 | 0.408 | 0.105 | Supported |
| EM > PEU | 0.346 | 2.131 | 3.959 | 0.000 | 0.505 | 0.114 | Supported |
| EM > PU | 0.322 | 2.131 | 3.565 | 0.000 | 0.408 | 0.082 | Supported |
| IM > PEU > EID | 0.148 | 2.310 | 3.038 | 0.001 | 0.520 | - | Supported |
| EM > PEU > EID | 0.123 | 2.310 | 2.673 | 0.004 | 0.520 | - | Supported |
| IM > PU > EID | 0.151 | 2.310 | 3.193 | 0.001 | 0.520 | - | Supported |
| EM > PU > EID | 0.134 | 2.310 | 2.749 | 0.003 | 0.520 | - | Supported |
Discriminant Validity of the Heterotrait-Monotrait (Source: PLS-algorithm result, authors’ interpretation (2))
| Construct | Employee’ intentional digital readiness | Extrinsic motivation | Intrinsic motivation | Perceived ease of use | Perceived usefulness |
|---|---|---|---|---|---|
| Employees’ intention digital readiness | - | - | - | - | - |
| Intrinsic motivation | 0.555 | 0.827 | - | - | - |
| Extrinsic motivation | 0.504 | - | - | - | - |
| Perceived ease of use | 0.735 | 0.714 | 0.740 | - | - |
| Perceived usefulness | 0.764 | 0.654 | 0.671 | 0.821 | - |