

Taxation is the major source of government revenues around the world. Taxation is the bedrock upon which most government machinery thrives (Queku, et al., 2024). A dip in tax revenues means ineffective functioning of government policies and projects. Countries over the world continue to suffer a great deal of reduction in tax revenue. For example, Figure 1 shows that the average tax revenue (ATR) to gross domestic product (GDP) is around 41.1% in Europe—being the highest among the pack, around 38.3% in the Americas, around 34.3% in the Organization for Economic Cooperation (OECD), and around 16.1% average in the Sub-Sahara Africa in 2019 (OECD, 2020; Seidu, et al., 2021).
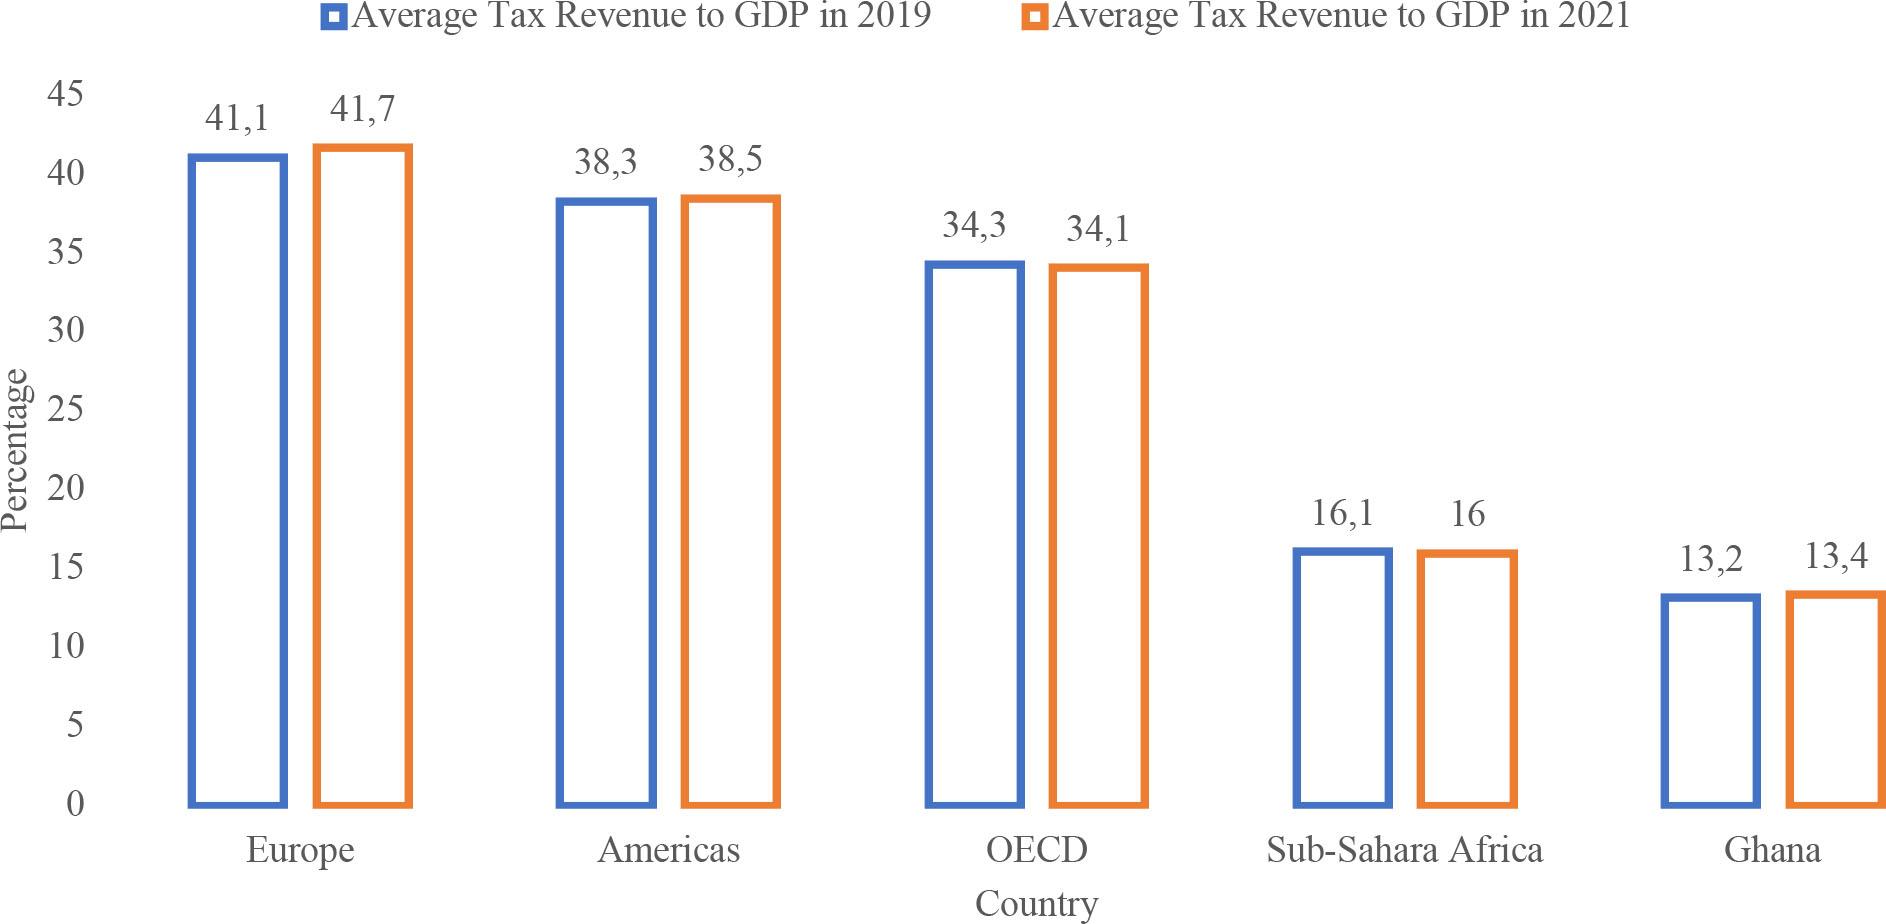
Tax revenue-to-GDP
(Source: OECD Revenue Statistics, 2022)
International Centre for Tax and Development proffers that low-income countries depend more on corporate income tax revenue than developed countries and their revenues are affected disproportionately by multinational tax avoidance. Corporate income tax collected by OECD has the lowest percentage (10%) apart from other taxes (8%) in the tax revenue structure of OECD countries. In Africa, corporate incomes form 19% of the entire tax revenue collected, ranking third on the tax revenue structure (OECD, 2020; Queku, et al., 2023). Ghana, just like other developing countries in Africa and Asia-Pacific, has corporate income tax revenue at 25%, which is the third highest in the overall tax revenue structure. Tax revenue mobilization has suffered a great deal tax shrinking due to relatively high unemployment, low tax revenue targets, ineffective and inefficient tax administration, complicated tax policies and tax laws, and above all absence of tax education.
In the Ghanaian tax environment, corporate institutions such as banks are major drivers. Banks in less developed economies serve as the beacons of hope for development, where both government and private sector, apart from tax revenues, also borrow from to finance their activities. Due to the emerging demands of governments, society, the proliferation of foreign competition, and the populace increase, the dynamics of operations including reporting and disclosures have changed, making the environment keener and highly competitive (Queku, 2016; 2020). Consequently, most banks have adjusted and adopted new methods of meeting the goals of their owners, resulting in employing varying strategies including tax liability targeting in order to survive. Now, banks are bent on taking advantage of all tax concessions available to them to reduce their tax obligation.
A competitive and efficient financial sector is a prerequisite for economic development and growth, especially in developing countries (Queku and Carsamer, 2016; Carsamer, Abbam and Queku, 2021), but banks, which dominate the financial sector, are often confronted with financial constraints. Presently, banks all over the world are faced with financial constraints more than ever. A bank is financially constrained when it experiences a rise in the cost of external financing or an increased difficulty in accessing desired levels of external funds. Seidu, et al. (2021) argue that when banks are bedeviled with financial constraints, there is a high propensity to maximize their operating financial capacities through practical firm-level management. One dimension of financial constraint which is critical for the banking sector is liquidity constraint.
A liquidity-constrained banks would not only breed mistrust and panic withdrawals among customers but also could cause the entire economy through increased cost of borrowing, loss of investment, lack of adequate funds for viable investment, and economic downturn (Carsamer, et al., 2021; Seidu, et al., 2021; Gong, et al., 2025), resulting in challenges for wealth creation and maximization (Queku, 2017). This explains the reason liquidity-constrained banks would go to every length to survive including tax liability targeting. It has been documented that as tax authorities consistently assess tax policies and enact measures to enhance tax revenue collection, taxpayers are also seeking ways to avoid taxes in order to reduce their tax burden. This behavior could lead to the adoption of tax liability targeting. From the taxpayer's viewpoint, tax liability targeting is a result of tax planning efforts that provide opportunities to lower tax obligations within the boundaries of tax regulations by setting a specific liability target with adjustments to achieve it. The concept of tax liability targeting may have contributed to the declining tax compliance in Ghana (Seidu, et al., 2021; Boateng, et al., 2022) and becomes more pronounced in the face of liquidity constraints. This is significant considering the aggressive tax enforcement in the Ghanaian economy, coupled with reports of a strained relationship between tax officials and businesses. Therefore, alongside a hostile tax administration, liquidity constraint may deepen tax-targeting activities.
Developing and applying tax avoidance schemes to target tax liabilities can serve as a beneficial strategy to enhance cash savings amidst liquidity constraints. The quest to increase tax savings in the face of liquidity constraints through tax liability targeting aligns with the assumptions of the extended parallel process model (EPPM). Drawing from EPPM, firms are expected to take measures to mitigate the impact of liquidity constraints when they acknowledge the severity of the threat and the likelihood of its occurrence (Leventhal, 1970; Witte, 1992), which may include engaging in tax avoidance strategies.
These assumptions of EPPM, therefore, suggest that although liquidity constraints can drive tax liability targeting through tax planning, the nature of the tax planning schemes and the extent of aggressiveness in the midst of liquidity challenges are dependent on how severe the perceived risk is (i.e., the severity of the consequence of the liquidity constraints) and the likely of experiencing such perceived consequences. This makes the theoretical relevance of EPPM in explaining the nexus an empirical issue. Evidence of persistence in the target, the slowness of the delay to target, or high speed to target would not only present direction for tax policy and practice but also provide empirical case EPPM assumption (Murray-Johnson, et al., 2004; Yoo, et al., 2022).
The growing interest in the empirical literature exploring the taxation-financial constraints nexus may have been influenced by these theoretical reasons and assertions. However, the focus of these empirical investigations has mainly been on developed economies and non-financial firms, with relatively few studies within the financial sector. Tax avoidance activities and the associated motivations are likely to be heterogeneous rather than homogeneous across countries and sectors of an economy. Therefore, it is important to extend the literature to the financial sector, particularly banking in Ghana, as the country continues to search for remedies for troubling tax revenue.
The study takes cognizance of both country and sectorspecific orientations and opines that there exist differences in tax laws and policies among sectors and countries. Therefore, this study investigates the liquidity constraints and tax liability targeting nexus of banks in Ghana. The analysis in this study differs considerably from the prior studies in terms of the estimation of adjustment of tax liability targets to liquidity constraints. This study seeks to broaden the existing literature on asymmetric adjustment patterns by focusing on tax liability targeting, thereby deepening the implications of asymmetric adjustment to the pattern of tax liability targeting.
Moreover, the sustainability of tax targeting under a liquidity constraint scenario is primarily dependent on the persistence in the target and the delay to the target (or speed of adjustment). Evidence of persistence in target would not only provide reasonable assurance of enduring cash savings to cushion the banks under constraints but also define how the target could respond to shocks, externalities (including regulatory interventions), or other changes. The integration of delay to target captures the dynamics of the relationship and provides insight into how fast or slow a constrained bank could benefit from a tax-targeting scheme. Thus, by estimating the persistence, and the delay to target in the relationship, the paper provides a deeper understanding and insight of the relationship between liquidity constraints and tax liability targeting.
Additionally, this study follows a novel methodology to estimate the speed at which these banks offset or rectify or adjust deviations from the tax liability target in contrast to the partial adjustment model that is frequently employed in the existing literature (Drobetz, et al., 2016; Rehman, Wang and Yu, 2016; Seidu, et al., 2022). This paper employs the delay model introduced by McQueen, Pinegar and Thorley (1996) and the halflife approach as an alternative method to address the challenges with PAM. This approach to SOA or convergence (i.e., the distance to target) originated from natural science and has been adopted in corporate finance literature (Bae, et al., 2012; Queku, Gyedu and Carsamer, 2020).
Consequently, the estimation of the SOA to the target involves two steps. Initially, the study develops a delay measure to determine how quickly information of liquidity constraint scenarios is integrated into the tax liability target. Subsequently, the paper computes the time needed for half of the distance to the tax target to decompose. The paper, thus, provides significant contributions to the literature through its thematic focus. It is the first to disaggregate financial constraint and specifically zeroing the liquidity constraint dimension to interrogate the consequence of such constraint on taxliability targeting. Additionally, it examines the level of persistence at each liquidity level and the sequence of a transition through the levels. Lastly, the study explores the speed of convergence or adjustment of distance to tax liability targets amidst liquidity constraint scenarios.
Liquidity remains an anchor for the sustainability and continuity of any financial sector. A strong banking sector is highly liquid to provide its intermediary role. However, there has been a significant decrease in liquidity across the industry, raising concerns among stakeholders. This section provides insight into the liquidity dynamics of the Ghanaian banking sector emphasizing the ratio of liquid funds to total deposits, the ratio of liquid funds to total assets of a bank, and the ratio of banks’ liquid funds to total interest-bearing liabilities.
From Table 1, the ratio of liquid funds to total deposits decreased by 16%, dropping from 93% in 2021 to 77% in 2022. This decrease is attributed to a 40% reduction in the industry's liquid funds, falling from GH 113.5 billion in 2021 to GH 68.4 billion in 2022. The observed significant decrease in liquid assets is linked to the considerably high impairment losses experienced by all banks in Ghana due to the Government of Ghana domestic debt exchange program (DDEP).
Analysis of Liquidity Funds/Total Deposits
(Source: Ghxana Banking Survey Report, 2023)
| Banks | 2022 | R | 2021 | R | 2020 | R | 2019 | R | 2018 | R | 2017 | R |
|---|---|---|---|---|---|---|---|---|---|---|---|---|
| FBN | 1.31 | 1 | 1.00 | 9 | 0.98 | 7 | 1.32 | 3 | 1.78 | 2 | 1.10 | 5 |
| BOA | 1.04 | 2 | 1.40 | 1 | 0.95 | 10 | 1.05 | 7 | 0.74 | 14 | 0.79 | 19 |
| ABG | 0.97 | 3 | 1.10 | 5 | 1.02 | 5 | 0.94 | 10 | 0.93 | 9 | 0.87 | 11 |
| FBL | 0.95 | 4 | 1.27 | 2 | 0.98 | 8 | 1.46 | 2 | 1.17 | 5 | 1.03 | 6 |
| FNB | 0.90 | 5 | 1.14 | 4 | 1.16 | 1 | 1.65 | 1 | 2.81 | 1 | 1.89 | 3 |
| SCB | 0.90 | 6 | 0.99 | 10 | 0.95 | 9 | 0.93 | 11 | 0.98 | 8 | 0.86 | 14 |
| UBA | 0.89 | 7 | 0.92 | 11 | 0.93 | 11 | 0.97 | 9 | 1.33 | 4 | 0.87 | 12 |
| PBL | 0.88 | 8 | 0.90 | 13 | 0.79 | 15 | 0.59 | 17 | 0.57 | 19 | 0.70 | 21 |
| ABSA | 0.82 | 9 | 1.16 | 3 | 1.02 | 6 | 1.25 | 5 | 1.13 | 6 | 0.69 | 22 |
| OBL | 0.82 | 10 | 0.92 | 12 | 0.73 | 19 | 0.00 | - | 0.00 | - | 0.88 | 10 |
| ZBL | 0.81 | 11 | 1.07 | 8 | 1.12 | 2 | 1.26 | 4 | 1.34 | 3 | 0.96 | 7 |
| CBG | 0.75 | 12 | 1.09 | 7 | 1.04 | 4 | 1.10 | 6 | 0.00 | - | 0.00 | - |
| GCB | 0.75 | 13 | 0.90 | 14 | 0.87 | 13 | 0.79 | 14 | 0.8 | 12 | 0.85 | 15 |
| GTB | 0.75 | 14 | 0.76 | 16 | 0.90 | 12 | 1.03 | 8 | 1.05 | 7 | 0.96 | 8 |
| SBG | 0.71 | 15 | 0.68 | 20 | 0.74 | 18 | 0.58 | 18 | 0.66 | 17 | 0.83 | 17 |
| CAL | 0.70 | 16 | 1.10 | 6 | 1.07 | 3 | 0.89 | 12 | 0.77 | 13 | 0.79 | 18 |
| RBL | 0.69 | 17 | 0.71 | 19 | 0.70 | 20 | 0.69 | 15 | 0.72 | 15 | 0.66 | 23 |
| UMB | 0.67 | 18 | 0.00 | - | 0.54 | 23 | 0.00 | - | 0.00 | - | 0.86 | 13 |
| SG-GH | 0.66 | 19 | 0.76 | 17 | 0.62 | 21 | 0.45 | 19 | 0.65 | 18 | 0.53 | 26 |
| EBG | 0.64 | 20 | 0.73 | 18 | 0.74 | 17 | 0.59 | 16 | 0.71 | 16 | 0.76 | 20 |
| ADB | 0.63 | 21 | 0.77 | 15 | 0.79 | 14 | 0.83 | 13 | 0.89 | 10 | 0.84 | 16 |
| FABL | 0.58 | 22 | 0.62 | 21 | 0.77 | 16 | 0.00 | 1 | 0.88 | 11 | 0.89 | 9 |
Banks’ Liquid Funds/Total Assets
(Source: Ghana Banking Survey Report, 2023)
| Banks | 2022 | R | 2021 | R | 2020 | R | 2019 | R | 2018 | R | 2017 | R |
|---|---|---|---|---|---|---|---|---|---|---|---|---|
| FBN | 0.76 | 1 | 0.65 | 11 | 0.66 | 8 | 0.74 | 6 | 0.89 | 1 | 0.82 | 3 |
| ABG | 0.73 | 2 | 0.76 | 4 | 0.73 | 3 | 0.65 | 9 | 0.67 | 8 | 0.63 | 9 |
| SCB | 0.72 | 3 | 0.75 | 5 | 0.69 | 4 | 0.69 | 8 | 0.71 | 7 | 0.63 | 10 |
| CBG | 0.71 | 4 | 0.84 | 1 | 0.87 | 1 | 0.91 | 1 | 0.00 | - | 0.00 | - |
| ZBL | 0.70 | 5 | 0.77 | 3 | 0.81 | 2 | 0.85 | 2 | 0.83 | 2 | 0.72 | 8 |
| OBL | 0.69 | 6 | 0.70 | 7 | 0.63 | 11 | 0.00 | - | 0.00 | - | 0.62 | 12 |
| UBA | 0.69 | 7 | 0.71 | 6 | 0.68 | 7 | 0.77 | 4 | 0.79 | 4 | 0.61 | 14 |
| FBL | 0.68 | 8 | 0.78 | 2 | 0.69 | 5 | 0.73 | 7 | 0.75 | 6 | 0.76 | 4 |
| GCB | 0.63 | 9 | 0.68 | 9 | 0.68 | 6 | 0.62 | 10 | 0.63 | 11 | 0.62 | 13 |
| BOA | 0.59 | 10 | 0.65 | 10 | 0.55 | 19 | 0.57 | 13 | 0.47 | 16 | 0.52 | 22 |
| GTB | 0.59 | 11 | 0.56 | 17 | 0.66 | 9 | 0.75 | 5 | 0.76 | 5 | 0.75 | 7 |
| SBG | 0.58 | 12 | 0.55 | 18 | 0.59 | 17 | 0.45 | 17 | 0.48 | 15 | 0.56 | 18 |
| PBL | 0.57 | 13 | 0.59 | 15 | 0.49 | 21 | 0.39 | 18 | 0.42 | 18 | 0.47 | 25 |
| FNB | 0.57 | 14 | 0.61 | 12 | 0.59 | 16 | 0.82 | 3 | 0.81 | 3 | 0.75 | 6 |
| RBL | 0.56 | 15 | 0.54 | 19 | 0.53 | 20 | 0.53 | 14 | 0.55 | 13 | 0.54 | 19 |
| EBG | 0.55 | 16 | 0.60 | 14 | 0.60 | 13 | 0.49 | 15 | 0.53 | 14 | 0.60 | 16 |
| ABSA | 0.54 | 17 | 0.60 | 13 | 0.56 | 18 | 0.59 | 12 | 0.62 | 12 | 0.53 | 20 |
| CAL | 0.51 | 18 | 0.69 | 8 | 0.60 | 14 | 0.49 | 16 | 0.45 | 17 | 0.47 | 24 |
| UMB | 0.50 | 19 | 0.00 | - | 0.38 | 23 | 0.00 | - | 0.00 | - | 0.56 | 17 |
| ADB | 0.50 | 20 | 0.58 | 16 | 0.59 | 15 | 0.62 | 11 | 0.64 | 10 | 0.60 | 15 |
| FABL | 0.49 | 21 | 0.52 | 20 | 0.62 | 12 | 0.00 | - | 0.65 | 9 | 0.76 | 5 |
| SG-GH | 0.43 | 22 | 0.47 | 21 | 0.42 | 22 | 0.32 | 19 | 0.41 | 19 | 0.38 | 26 |
Banks’ Liquid Funds to Total Interest Bearing Liabilities
(Source: Ghana Banking Survey Report, 2023)
| Banks | 2022 | R | 2021 | R | 2020 | R | 2019 | R | 2018 | R | 2017 | R |
|---|---|---|---|---|---|---|---|---|---|---|---|---|
| FBN | 1.29 | 1 | 0.99 | 2 | 0.96 | 3 | 1.28 | 2 | 1.78 | 2 | 1.01 | 4 |
| UBA | 0.89 | 2 | 0.92 | 6 | 0.93 | 4 | 0.97 | 6 | 1.00 | 5 | 0.77 | 12 |
| ABG | 0.87 | 3 | 0.95 | 4 | 0.92 | 5 | 0.79 | 10 | 0.83 | 9 | 0.76 | 13 |
| SCB | 0.87 | 4 | 0.93 | 5 | 0.91 | 6 | 0.86 | 7 | 0.92 | 6 | 0.84 | 10 |
| OBL | 0.80 | 5 | 0.87 | 8 | 0.69 | 18 | 0.00 | - | 0.00 | - | 0.75 | 14 |
| ZBL | 0.80 | 6 | 1.03 | 1 | 1.05 | 1 | 1.08 | 3 | 1.04 | 4 | 0.88 | 9 |
| BOA | 0.75 | 7 | 0.87 | 9 | 0.82 | 8 | 0.81 | 8 | 0.59 | 16 | 0.63 | 22 |
| GTB | 0.74 | 8 | 0.75 | 14 | 0.88 | 7 | 1.03 | 5 | 1.04 | 3 | 0.94 | 6 |
| FBL | 0.73 | 9 | 0.88 | 7 | 0.80 | 11 | 0.81 | 9 | 0.85 | 8 | 0.88 | 8 |
| CBG | 0.71 | 10 | 0.98 | 3 | 1.01 | 2 | 1.08 | 4 | 0.00 | - | 0.00 | - |
| GCB | 0.71 | 11 | 0.84 | 10 | 0.81 | 9 | 0.75 | 12 | 0.77 | 11 | 0.75 | 15 |
| SBG | 0.71 | 12 | 0.68 | 19 | 0.73 | 14 | 0.57 | 17 | 0.65 | 15 | 0.80 | 11 |
| FNB | 0.68 | 13 | 0.81 | 11 | 0.81 | 10 | 1.56 | 1 | 2.81 | 1 | 1.89 | 2 |
| ABSA | 0.68 | 14 | 0.76 | 13 | 0.73 | 15 | 0.73 | 13 | 0.76 | 12 | 0.69 | 18 |
| RBL | 0.68 | 15 | 0.68 | 18 | 0.67 | 19 | 0.65 | 14 | 0.67 | 14 | 0.64 | 21 |
| EBG | 0.64 | 16 | 0.73 | 15 | 0.74 | 13 | 0.58 | 15 | 0.70 | 13 | 0.74 | 16 |
| PBL | 0.63 | 17 | 0.73 | 16 | 0.60 | 20 | 0.49 | 18 | 0.52 | 19 | 0.55 | 25 |
| FABL | 0.58 | 18 | 0.62 | 21 | 0.77 | 12 | 0.00 | - | 0.88 | 7 | 0.89 | 7 |
| SG-GH | 0.57 | 19 | 0.65 | 20 | 0.56 | 22 | 0.43 | 19 | 0.56 | 17 | 0.51 | 26 |
| CAL | 0.56 | 20 | 0.80 | 12 | 0.71 | 16 | 0.57 | 16 | 0.54 | 18 | 0.58 | 24 |
| ADB | 0.56 | 21 | 0.70 | 17 | 0.71 | 17 | 0.76 | 11 | 0.80 | 10 | 0.71 | 17 |
| UMB | 0.56 | 22 | 0.00 | - | 0.47 | 23 | 0.00 | - | 0.00 | - | 0.66 | 19 |
| TCB | 0.00 | - | 0.00 | - | 0.00 | - | 0.00 | - | 0.00 | - | 20.29 | 1 |
| NIB | 0.00 | - | 0.00 | - | 0.57 | 21 | 0.00 | - | 0.00 | - | 0.00 | - |
| BOB | 0.00 | - | 0.00 | - | 0.00 | - | 0.00 | - | 0.00 | - | 1.12 | 3 |
| PRB | 0.00 | - | 0.00 | - | 0.00 | - | 0.00 | - | 0.00 | - | 0.97 | 5 |
| ECB | 0.00 | - | 0.00 | - | 0.00 | - | 0.00 | - | 0.00 | - | 0.65 | 20 |
| BSIC | 0.00 | - | 0.00 | - | 0.00 | - | 0.00 | - | 0.00 | - | 0.60 | 23 |
| TRB | 0.00 | - | 0.00 | - | 0.00 | - | 0.00 | - | 0.00 | - | 0.26 | 27 |
Similarly, the study presents the position of liquid funds using total assets as the benchmark. A liquidity fund-total asset ratio is an important measure that indicates the percentage of a bank's total assets held in a readily available cash or near cash form. This ratio is used to evaluate the ability or capacity of the banks to meet their short-term obligations. It also showcases banks’ liquidity risk. On an industry level, the liquid funds to total assets ratio have shown steady growth over the past 5 years. However, in 2022, there was a 6% decline in this ratio. The decline or decrease was caused by an overall decrease in borrowings, dropping by 16% from GH₵16.7 billion in 2021 to GH₵13.9 billion in 2022.
The Ghanaian banking sector has also witnessed some downturn in the liquid funds to total interest-bearing liabilities ratio. This ratio reflects the bank’s capacity to meet its interest-related liabilities using readily available funds. Over the last 3 years, the increase in liquidity compared to interest-bearing liabilities has been modest, averaging a growth rate of 3% annually. Nevertheless, during the 2022 financial period, the Ghanaian banking sector saw a significant decrease in this ratio, falling from 82% to 70% between 2021 and 2022.
This reduction is primarily due to a rise in deposits coupled with a decrease in liquid assets, particularly money market securities, which were significantly impaired as a result of the DDEP in Ghana. The primary components of interest-bearing liabilities are shortterm customer deposits, which represent 91.6% of the overall total. These deposits increased by 35% from GH₵121.8 billion in 2021 to GH₵164.4 billion in 2022. Other interest-bearing liabilities, including borrowings and lease liabilities, make up 7.8% and 0.6%, respectively. The decline in the ratio of liquid funds to total interest-bearing liabilities puts banks at a disadvantage when it comes to settling their interest-related obligations in both the short term and the long term. Insufficient liquidity can hinder banks’ ability to manage day-to-day.
One fundamental theory underpinning the study is the extended parallel process model (EPPM). Although several theories may be helpful in drawing relationships, not all are suitable for liquidity constraint-tax planning targeting comparison. This study follows the EPPM to provide theoretical arguments to support the proposed relationship between liquidity constraints and tax liability targeting (Leventhal, 1970; Witte, 1992). The EPPM stipulates that, for individuals to take protective action, they must (1) feel threatened by the consequences of a particular behavior and, at the same time, (2) feel able to take the necessary action to avoid that threat and believe that the action will be effective in mitigating.
The EPPM explains the reaction of individuals, firms, organizations, and businesses when faced with fear-inducing scenarios. The model identifies four outcomes of behavior depending on the perceived threat and perceived efficacy. The degree to which people feel threatened by an issue or situation will determine their motivation to act. Action will not occur unless people’s confidence in their ability to take protective measures is high, and they believe that those actions will actually be effective in reducing risk. This implies that when there is a belief that the threat is harmful and that one is at risk, people would take protective action to avoid or reduce the threat. Messages that are fear-appealing have been effective in behavioral change since they draw attention to the risk(s) a person faces for performing or not performing a particular action (Murray-Johnson, et al., 2004). Thus, an individual, firm-level, or management decision is based on their risk profile: analyzing the likelihood of its occurrence and its impact on the organization.
When banks observe whether or not they stand susceptible to a recognized threat and also whether that threat is severe, they are likely to react. This is to say the first process involves perceived susceptibility where the level to which an individual or bank feels that they stand at risk for some particular threat. Perceived severity is the level to which an individual sees a threat as being serious. The EPPM also provides that fear is a factor that triggers an individual or bank’s behavioral change to the recommended action (Yoo, et al., 2023). Generally, if it is perceived that the threat is irrelevant or trivial, they overlook the message of risk as well as the advice to perform the needed action. Relatedly, liquidity constraint as severe risk factor which can lead to mistrust, panic withdraw, and even collapse of banks can cause management of these banks react swiftly to minimize the exposure through internal reorganization to improve cash flow situation.
Applying this analogy in liquidity-constrained instances, when banks assess their risk severity profile and realize that the risk is high and the probability of occurrence is also high, it generates fear among management. In this circumstance, management is likely to take a decision out of danger control. In line with the high severity is high, they would be bent on doing anything that will sustain them including engaging in tax planning activities to reduce their tax liability. The motivation is that it is likely going to take the banks a shorter period to readjust to convergence after embarking on such tax planning activity to save cash. Banks would always prefer using revenue meant for the tax to sustain their operations rather than pay tax to the government because it offers not only a cheap source of finance but also an opportunity to make cash savings. Conversely, with the banking sector highly regulated, management may also be afraid of being exposed of the aberrant tax activities and therefore minimize the aggressiveness of the tax liability targeting. This suggests that the nature of liquidity constraint-tax liability targeting relationship may be dependent on the management orientation of risk.
Nevertheless, liquidity-constrained banks are likely to cause fear and panic among customers, which could trigger panic withdrawal resulting in cancellation or suspension of bank license. It is, thus, anticipated that liquidity-constrained banks will employ tax planning as a source of funds for many reasons. First, reducing taxes is less likely to adversely affect the bank’s operation, unlike many other cost-cutting techniques. Second, most available literature suggests that banks have additional opportunities to generate current cash tax savings through deferral-based tax planning activities. Third, anecdotal evidence suggests that “cash is supreme” in times of constraint and that constrained banks are receptive to using tax planning as a source of cash (Edwards, Schwab and Shevlin, 2016).
Based on the theoretical arguments from the EPPP and the literature, the study operationalizes its framework by envisaging that liquidity-constrained banks will target tax liability to increase internally generated funds due to many lessons learned from the review of the literature. Drawing from these theoretical lessons, the paper summarizes its direction and scope of analysis in the framework specified in Figure 2. The framework specifies a direct relationship between liquidity constraints and tax liability targeting, including the persistence and the delay to target. The liquidity constraints are operationalized from essential metrics for measuring liquidity of banks. It is the limitation or inability of a bank to meet its liquidity needs, including difficulty in accessing liquid funds or in buying or selling liquid assets.
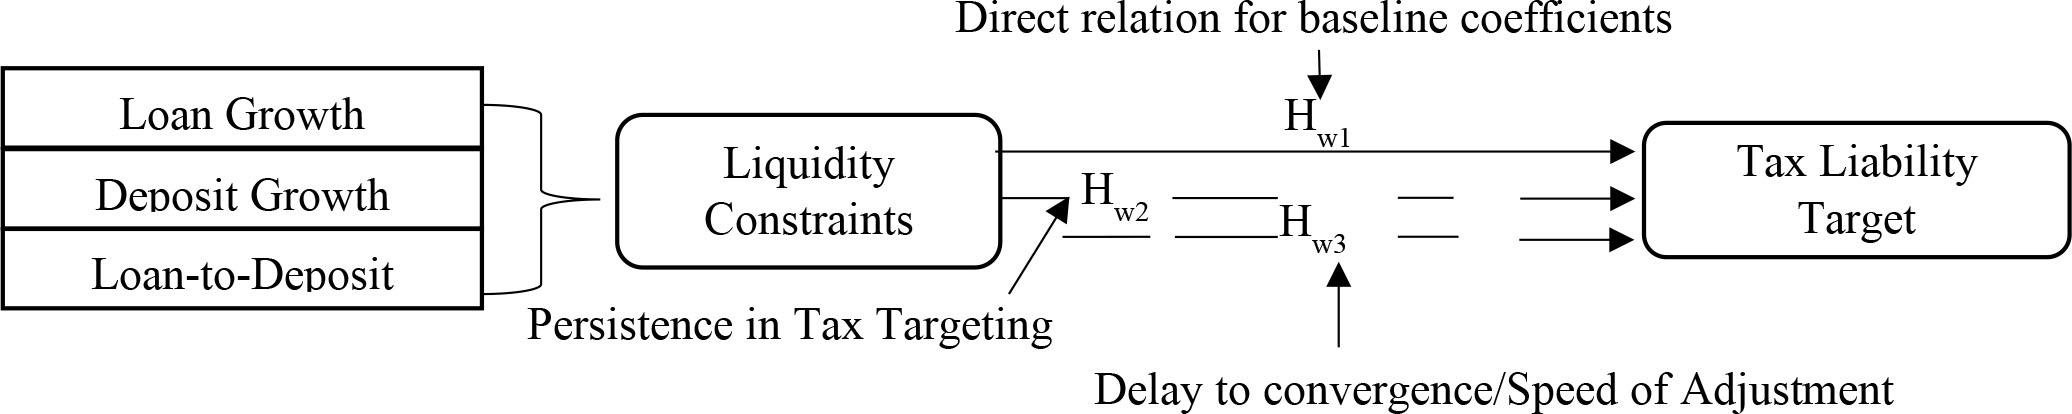
Framework for liquidity constraint-tax liability targeting, persistence, and delay to convergence
(Source: Authors’ Construct Developed from the Literature)
Following the literature, this paper conceptualizes liquidity as loan growth, deposit growth, and loan-deposit ratio (Berger and Bouwman, 2009; Satria, Harun and Taruna, 2016; Edem, 2017; Fungáčová, Weill and Zhou, 2017; Adesina, 2019; De Vuyst and Rotsaert, 2019; Polizzi, Scannella and Suárez, 2020; Adenuga, et al., 2021; Seidu, et al., 2021; Limodio and Strobbe, 2023).
Loan growth is identified loan growth as a critical metric of liquidity position of banks. A growing quality loan portfolio defines sustainable liquidity through the ability to increase cash flow from revenue streams (Berger and Bouwman, 2009; Adesina, 2019). Therefore, a constrained loan growth imposes liquidity risk. Additionally, deposit growth is an essential metric for bank’s liquidity. A growing deposit base provides banks with a stable source of funding, which can help them meet their liquidity needs (Edem, 2017; Fungáčová, et al., 2017). A constrained deposit growth disrupts banks’ liquidity and weaken the ease of meeting customers’ withdrawals. Moreover, loan-deposit ratio is a widely used metric for assessing the liquidity position of banks. It measures the proportion of loans to deposits and provides insights into a bank's ability to fund its loan portfolio (Satria, et al., 2016; Seidu, et al., 2021). These metrics provide insights into a bank's ability to generate sustainable cash flow from new business or revenue streams, manage its funding base, and meet its short-term obligations.
In Figure 2, it can be observed that these three metrics have been used as liquidity-constrained constructs with direction relation projecting to tax liability target. Bank-level tax liability targeting involves setting a target for tax liabilities as a percentage of bank's profits or a specific level of tax liabilities (Shackelford and Shevlin, 2001). The bank then adjusts its tax planning strategies, such as optimizing tax deductions, credits, and exemptions, to achieve the targeted tax liability. Since the focus of this tax liability targeting is to increase cash savings, cash-effective tax rate is used as the baseline for the target. The direct relationship also reflects the working hypothesis 1 (Hw1). This does not only provide a coefficient-based analysis but also provide baseline coefficients needed for further analysis in Hw2 as shown in the broken arrow between liquidity constraints and tax liability target. Hw2 reflects the determination of persistence in the tax target. This has implications for mean reversion. The study also explores the delay to convergence or speed of adjustment of the tax target to liquidity constraint scenario. This is also captured in Hw3.
There is a growing interest in tax planning resulting varying streams of empirical literature linking tax liability reduction strategies to some relevant outcome variables, such as a firm's equity compensation (Rego, et al., 2019), institutional ownership (Khan, Srinivasan and Tan, 2017), analyst cash flow forecast (Ayers, et al., 2018), profitability (Lee and Yoon, 2020; Razali, et al., 2018), transfer pricing (Taylor and Richardson, 2014; Muhammadi, Ahmed and Habib, 2016; Hopland, et al., 2018), cost of equity (Goh, et al., 2016), and the term structure of debt (Platikanova, 2017).
Financial constraints, as an incentive for tax liability targeting, is evolving as another stream of studies (Edwards, et al., 2016; He, Ren and Taffler, 2020; Seidu, et al., 2021; Boateng, Omani-Antwi and Queku, 2024) found companies financially constrained to participate in more tax liability reduction activities. Law and Mills (2015) also observed that financially constrained companies follow more aggressive tax liability reduction strategies both present and in the future. Financially constrained companies increase internally generated funds through tax planning (Edwards, et al., 2016; Seidu, et al., 2021). Wu (2018) explored the dynamics of financial constraints and corporate tax avoidance and found a positive association between financial constraints and tax avoidance. Wu (2018) found the association to be significantly stronger for companies with high tax liability reduction strategies. Similar evidence is also found in Alm, et al. (2019) linking financial constraints to tax. Seidu, et al. (2021) specifically focused on the Ghanaian banking sector and also provided evidence to the effect that financial constraints and tax planning activities are positively related. Tao, Gol, Zheng and Le (2023) examined the impact of cash tax avoidance of banks and observed that banks which are financially constrained exhibit a lower cash effective tax rate. Campbell, et al. (2023) also examined the financial constraints-tax nexus and concluded, contrary to earlier findings, that outside United States of America (USA), the relationship between financial constraints and tax planning is negative. Campbell, et al. (2023) relied on 31 firms from countries outside United States. Mulamula, Zakaria and Mohamad (2023) also contributed to this relationship by investigating the moderating effect of audit quality on the relationship between tax planning and financial constraints. Although Mulamula, Zakaria and Mohamad (2023) did not find evidence of significant moderating effect of audit quality on financial constraints-tax planning nexus, there was evidence of aggressive tax planning arising from financial constraints.
As noted earlier, the growing interest in the empirical literature exploring the taxation-financial constraints nexus may have been influenced by the theoretical reasons espoused in EPPM. However, the focus of these empirical investigations has mainly been on developed economies and non-financial firms, with relatively few studies within the financial sector (Seidu, et al., 2021; Tao, et al., 2023; Boateng, Omani-Antwi and Queku, 2025). Tax avoidance activities and the associated motivations are likely to be heterogeneous rather than homogeneous across countries and sectors of an economy. Therefore, it is important to extend the literature to the financial sector, particularly banking in Ghana, as the country continues to search for remedies for troubling tax revenue. Moreover, other than Seidu, et al. (2021), financial constraints have been unitary operationalized; however, Seidu, et al. (2021) provided classification uniquely positioned within the banking through liquidity and solvency. The present study, therefore, draws this lesson and narrows the investigation into the liquidity constraint dimension.
Nevertheless, this study departs from Seidu, et al. (2021), in that it extends the scope of investigation to determine the persistence of the relationship and speed of adjustment or distance to target through tax targeting. Thus, the analyses in this study differ considerably from the prior studies in terms of the estimation of adjustment of tax liability targets to the liquidity constraints. This study seeks to extend the asymmetric adjustment pattern literature to tax liability targets in response to the gaps in the literature. This study also employs an alternative approach to estimating how fast firms correct or offset deviations from the tax liability target contrary to the partial adjustment model commonly used in the literature (Drobetz, et al., 2016; Rehman, Wang and Yu, 2016; Seidu, et al., 2022).
Besides the lessons to situate the novelty of the study and gap analyses, the lessons from the literature suggest that in both theoretical and empirical literature, tax savings is viewed as a source of internal financing (Edwards, et al., 2016; Wu, 2018; He, et al., 2020). Therefore, it is argued that banks may rely on generating inflows through tax liability targeting when those taxbased funds are the inexpensive available source of funds to the constrained bank (Seidu, et al., 2021; Tao, et al., 2023). Hence, liquidity constraint is expected to cause banks to change their tax response. This implies that banks that might not have considered tax planning opportunities during the non-constraints’ periods are more inclined to exercise them during constrained times by altering their tax response. Based on the literature and the lessons learned, the paper, therefore, presents its working hypothesis (Hw) as follows:
Hw1. Liquidity constraints have a significant influence on the tax liability targeting of banks in Ghana.
An evaluation of the literature shows that the growing interest of researchers is about the relationship between financial constraints and tax. Although this trend has contributed to the understanding of the nexus with strong implications for theory, policy, and practice, determining the persistence of the target and the speed of adjustment to the target is critical. Determining the persistence would provide evidence about whether or not the achieved tax liability target arising from the constrained may be permanent or temporary, and the degree of the persistence or how much an impact of a shock remains over time (Barros, Gil-Alana and Prez, 2016; Fallahi, 2020). This dimension of the analyses is virtually absent. The persistence of targeting and the speed of adjustment impact the frequency of tax leakages and the sustainability of tax savings for banks. Estimating the persistence and the speed of adjustment of tax liability in relation to liquidity constraints is not only a valuable contribution to theory but also has practical implications for tax policy and practice. The study, therefore, formulates its second and third working hypotheses as follows:
Hw2: There is a significant persistence in the tax liability target of liquidity-constrained banks Hw3: There is a high speed of adjustment of tax liability targeting (low delay to convergence) in response to liquidity constraints of banks in Ghana.
For the empirical analyses, the paper extracted and converted annual data to monthly data from the universal banks. The data were converted to ensure observable seasonal patterns and to capture more frequent short-term fluctuations, which are required for estimating variation in targeting, pattern of persistence, and delay to target. To ensure that the converted data significantly reflect the nuances of the original annual data, the study used Denton procedure. Denton procedure minimizes distortions in the new high-frequency data including artificial trends and seasonality and preserves the nuances of the annual data (Denton, 1971; Rashid and Jehan, 2013; Sax and Steiner, 2013; Farhadi and Ramazani, 2024). In all, there are 23 universal banks in Ghana. The paper employs the census approach as the sampling technique. The selection criterion for the sample frame is that the bank should:
have been licensed by the Bank of Ghana,
be operating as a universal bank, and
be in operation from 2008 to 2022.
Banks with missing data are excluded from the analysis. Using the above selection criterion, the paper generated a sample size of 20 banks. Three universal banks, namely, First National Bank Ghana Limited (2015), OmniBSIC Bank Ghana Limited (2019), and Consolidated Bank Ghana Limited (2018), were not selected due to the non-availability of data. The paper collected annual data from the audited financial statements of the sampled firms. The use of 2008 as the starting point for data management is informed by the fact that it is that period that Ghana adopted a new financial reporting regime, International Financial Reporting Standards (IFRS) (Queku, 2017; 2020), and 2022 as the ending period due to data availability. The choice of the universal banks is a result of uniformity in the minimum capital requirement of GHC400m set by the Bank of Ghana and the uniformity in the presentation of financial statements. The change in financial reporting standards is likely to affect the financial data. Hence, for consistency, the paper relied on data within the same financial reporting regime. The choice of 2022 is due to readily available data.
The paper used financial statements sourced from the banks’ websites, Bank of Ghana and Ghana Stock Exchange websites. The data were used to measure the variables of interest: liquidity constraints and tax liability targeting variables. Farre-Mensa and Ljungqvist (2016) reveal how difficult it is to classify firms as unconstrained and constrained. In this regard, this paper employs a simulation approach to develop a constrained scenario to observe the consequence of tax liability targeting activities of the selected banks (Edwards, et al., 2016).
The paper uses this approach to employ three proxies to measure liquidity constraints: negative deposit growth, loan growth, and loan-to-deposit (Bernanke and Gertler, 1995; Seidu, et al., 2021). The paper proposes that banks would have liquidity constraints when their current and near cash inflows, such as good loans, cash, and cash equivalent, are not significant to pay their current debt obligations including deposits. The selected proxies are discussed in the following section.
Consistent with the literature, tax liability is operationalized as tax planning. Although there are various proxies for measuring tax planning, the choice is often dependent on the focus and purpose of the investigation (Hanlon and Heitzman, 2010; Edwards, et al., 2016). One proxy has been selected for the empirical investigation: cash effective tax rate (CETR). This paper employs CETR because the interest of this investigation is to determine how banks respond to liquidity constraints resulting in the need to generate additional cash. Another justification for the appropriateness of CETR is that CETR is the most direct measurement of banks’ cash tax savings.
However, when it comes to empirical specifications of targeting, the literature often follows two main approaches: unobservable and observable target levels (Opler, et al., 1999; Seidu, et al., 2022). The unobservable approach estimates a target from the residuals of selected firm-specific attributes, which are often criticized as not exhaustive or arbitrary (Garcia-Teruel and Martinez-Solano, 2008). According to Seidu, et al. (2022), this approach renders the target inherently unstable, especially with the introduction of new firmspecific variables, as this could change the target level. Therefore, this study follows an observable approach by measuring tax liability targets using the actual level of CETR (Opler, et al., 1999; Seidu, et al., 2021). With this approach, the mechanism for adjusting the target reflects how the actual level of CETR is restored to the target level.
Liquidity constraint has three proxies: deposit growth, loan growth, and loan-to-deposit. Seidu, et al. (2021) observe that an increase in the levels of bank deposits may decrease the bank risk profile and liquidity constraints and could lower the banks’ marginal cost of capital and eventually could induce additional lending. Hence, deposit growth may denote unconstrained bank. The study simulates the liquidity constraint scenario by rendering deposit growth as negative by multiplying the deposit growth by a negative one.
Banks engaged primarily in the traditional business of deposit taking and loan making. The banks earn their profits mainly from an increase in lending through spreads between loans and deposits. A primary lesson learned from the literature is that banks that are financially constrained are prone to liquidity risk, and this could lead to tax liability targeting (Covitz and Downing, 2007; Cornett, et al., 2011). To induce liquidity constraint, this paper also negates both loan growth and loan-to-deposit. This captures the scenario of liquidity constraints.
The study also follows the existing literature control for bank size measured by the natural log of total assets, bank leverage measured by the ratio of long-term debts to total assets, age and tangibility measured by the book value of property, plant and equipment (Mills, Erickson and Maydew, 1998; McGill and Outslay, 2004; Mills and Newberry, 2004; Wilson, 2009; Lisowsky, 2010; Seidu, et al., 2021). The summary of the measurement is provided in Table 4.
Variable Description and Measurement
(Source: Authors’ construct developed from varying literature)
| Variables | Description | Measurements |
|---|---|---|
| TLT | Tax liability targeting | |
| CETR | Cash effective tax rate | |
| NLG | Negative loan growth | Loan growth rate multiplied by -1 |
| NDG | Negative deposit growth | Deposit growth rate multiplied by -1 |
| NLD | Negative loan deposit | Loan-to-deposit rate multiplied by -1 |
| BS | Bank size | Log of total assets |
| BA | Bank age | Age of bank |
| BT | Bank tangibility | Carrying balance on PPE |
| BL | Bank leverage | Long-term liability to assets |
Cash effective tax rate is adjusted by extraordinary items
The first working hypothesis (Hw1) of this paper tests the direct relationship between liquidity constraints and the tax liability targeting of banks in Ghana. To test this hypothesis, the study follows panel model specifications as the data for the investigation exhibit both cross-sectional and time series characteristics. The study follows the existing literature to specify the generalized panel model as follows:
“Y,” “X,” and “C” are the dependent, independent, and control variables, respectively. The dependent variable is the tax liability target, while the independent variable is the liquidity constraint. The vector of controls is captured in the variable description.
“it” captures panel specifications with “i” and “t” denoting cross section and time series dimensions, respectively.
“∝” is the intercept of the model.
“π” and “δ” are the coefficients of the independent and control parameters, respectively.
“ε” is the error term.
Moreover, the test of speed of adjustment requires the presence of cointegration or long-run estimates as baseline. This imposes restriction on the choice of the estimation approach. The study employs dynamic ordinary least squares (DOLSs) to test the relationship specified in equation (Eqn) 1. DOLS is a cointegration approach proposed by Stock and Watson (1993). It is a robust single-equation technique and utilizes leads and lags to address the endogeneity issues of regressors. It effectively handles small sample sizes and dynamic sources of bias. By using DOLS, the originality of the data is preserved, avoiding the problem of losing it due to stationarity through differencing series (Stock and Watson, 1993; Queku and Carsamer, 2016; Queku, et al., 2020; Seidu, et al., 2022). DOLS estimation also addresses simultaneity bias and introduces a dynamic specification of the OLS estimation model (Stock and Watson, 1993).
Furthermore, DOLS allows for the inclusion of lagged variables in the estimation, which helps capture the dynamic nature of the relationship between the variables. This is particularly useful in economic and financial time series data, where variables may exhibit longterm relationships and persistence over time. It provides efficient estimates of the cointegrating vectors and the adjustment coefficients, allowing for a more accurate understanding of the long-run equilibrium relationship between the variables. This is crucial for policy analysis and forecasting, as it provides insights into the long-term behavior of the variables and their interdependencies. The equation of DOLS specification is given by
CETRit is the dependent variable, Xit is the vector of all the explanatory variables (independent and control variables), and Δ is the lag operator.
By expansion, the empirical equation can be derived from Equation (2) as follows:
where π0 is the intercept of the model, π1 to π6 are the coefficients of the independent and control variables, (1) and (-1) are the lead and the lag operators, respectively, and εit is the residual error of the regression.
To confirm the presence of cointegration, the study tests the residuals of the estimation in Eqn (3) using Fisher Augmented Dickey Fuller (ADF). Where the residuals are stationary, then there is a cointegration relationship providing the bases for the further analyses of the speed of adjustment and delay. Prior to this postestimation test, the study conducts pre-diagnostic test for stationarity using Augmented Dickey Fuller (ADF) and the Phillip Perron (PP) unit root tests. These tests provide evidence of stationary properties for the longrun relationship of panel variables. The traditional ADF test is based on the model and used in the literature (Queku and Carsamer, 2016) in Eqn (4):
Where:
Δ is the first difference operator,
Xit is the series,
α0 is the intercept constant,
k is the dependent variable’s optimum numbers of lags, and
εt is pure white noise error term.
The null hypothesis for this estimation is that α1 coefficient is equal to zero for the series which are non-stationary series otherwise when the series are stationary. PP test model is also specified as follows:
The PP unit root test is also based on t-statistics.
The second working hypothesis requires the measurement of persistence in the tax liability target. To determine persistence in the target, the study uses both stationarity test and impulse response function. It is important to determine the stationarity or non-stationarity of the tax liability target, as it is a baseline to determine whether tax target, when reached, will persist indefinitely or will dissipate over time (Barros, Gil-Alana and Prez, 2016; Fallahi, 2020).
The study follows the widely used Augmented Dickey-Fuller (ADF) to test the stationarity of the tax target. Where the tax target is stationary (i.e., integrated order of 0), then persistence will be temporary and shocks from liquidity constraints including other transitory shocks will dissipate over time. However, where it is non-stationary, then persistence will be permanent (or in relative time, it will be very difficult to reverse the effect in the tac target). The ADF estimation follows specifications in Eqn (4).
Following Keating (1991), persistence is not a binary but rather an issue of continuum. It is about the degree of the persistence. Therefore, it is important to determine how much an impact of a shock remains over time. The stationarity test only provides evidence of persistence. Therefore, consistent with the literature, to determine the degree of persistence, the study conducts further analysis using impulse response function (Fallahi, 2020; Queku, et al., 2024) with the specification expressed as in Eqn (6):
Where:
β is the vector for k-dimension,
δ is the sequence of a serially uncorrelated random vector,
π are the matrices, and
πit is the impulse response function of the ϑit, when the coefficient associated with π is the influence of δ on the future observations of ϑit+1. The Cholesky decomposition Σ = δ PP' is applied to obtain the uncorrelated innovations: wit = p−1δit.
The third hypothesis requires the estimates of delay and speed of adjustment. The delay and the speed of adjustment (SOA) are estimated by employing both the half-life estimation approach and the delay model. The concept of half-life originates from the natural sciences, where it represents the time taken for radioactivity to decrease by half (Queku, et al., 2020; Seidu, et al., 2022). This method has been adopted by researchers in corporate finance and economics to determine how long it takes for the impact of innovation to diminish by half. Instead of the commonly used partial adjustment model (PAM), the paper explores the half-life and delay approaches (Drobetz, et al., 2016; Rehman, et al., 2016).
One unique characteristics of half-life approach is its capacity to quantify SOA in time units. Unlike PAM, half-life does not necessitate a strict sequence of adjustment or dissipation, aligning with the dynamics of firms' movement between stages and periods. To technically implement the half-life approach in the delay measure, the study followed the methods of Bae, et al. (2012), Queku, et al. (2020), and Seidu, et al. (2022b).
First, the study developed a delay measure based on estimates from the estimation between tax liability target and liquidity constraints as specified in Eqn (3) so as to reveal how quickly banks reverse deviations in tax liability targets due to liquidity constraints.
Second, the study estimated the time required for half of the distance to target to decompose which defines the speed of adjustment or distance to target.
The delay measurement and estimation follow McQueen, et al. (1996)’s model, and it is expressed in Eqn (7):
d is the delay,
e is the constant, and
d range is given as 0 =< d =< 1.
Following Queku, et al. (2020) and Seidu, et al. (2022a), the half-life is estimated by further substitution of the final estimates from Eqn (7) into half-life model specified in Eqn (9). This is expressed as follows:
μ was the half-life and
q is the final estimate from Eqn (7).
Figure 3 shows the trend of cash-effective tax rate (CETR). It can be observed from Figure 3 that the mean CETR has never been zero (0). In the 15-year trend, it can be observed that for most of the years, the tax contribution has been above the 25% average. However, after 2018, the average CETR has been fallen, even though it is still positive. The relatively sharp downward trend in the post-2018 periods reflect the Ghanaian banking crisis in 2017–2018. Thus, the uncertainty arising from liquidity may have triggered a downward trend.
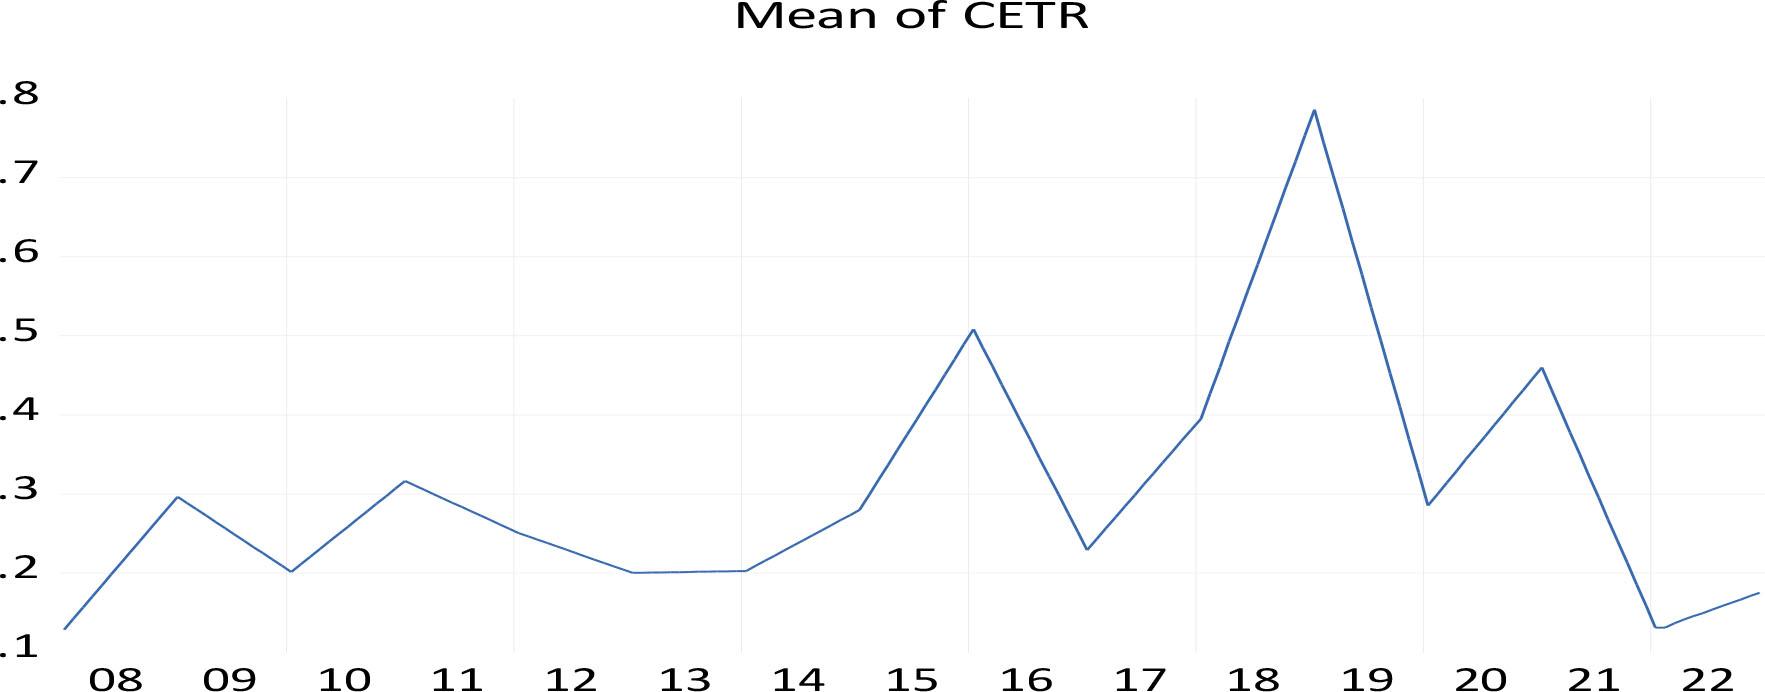
Time-Varying Mean Trend of Cash Effective Tax Rate (CETR) of Banks in Ghana
(Source: Generated from Eviews version 12.0)
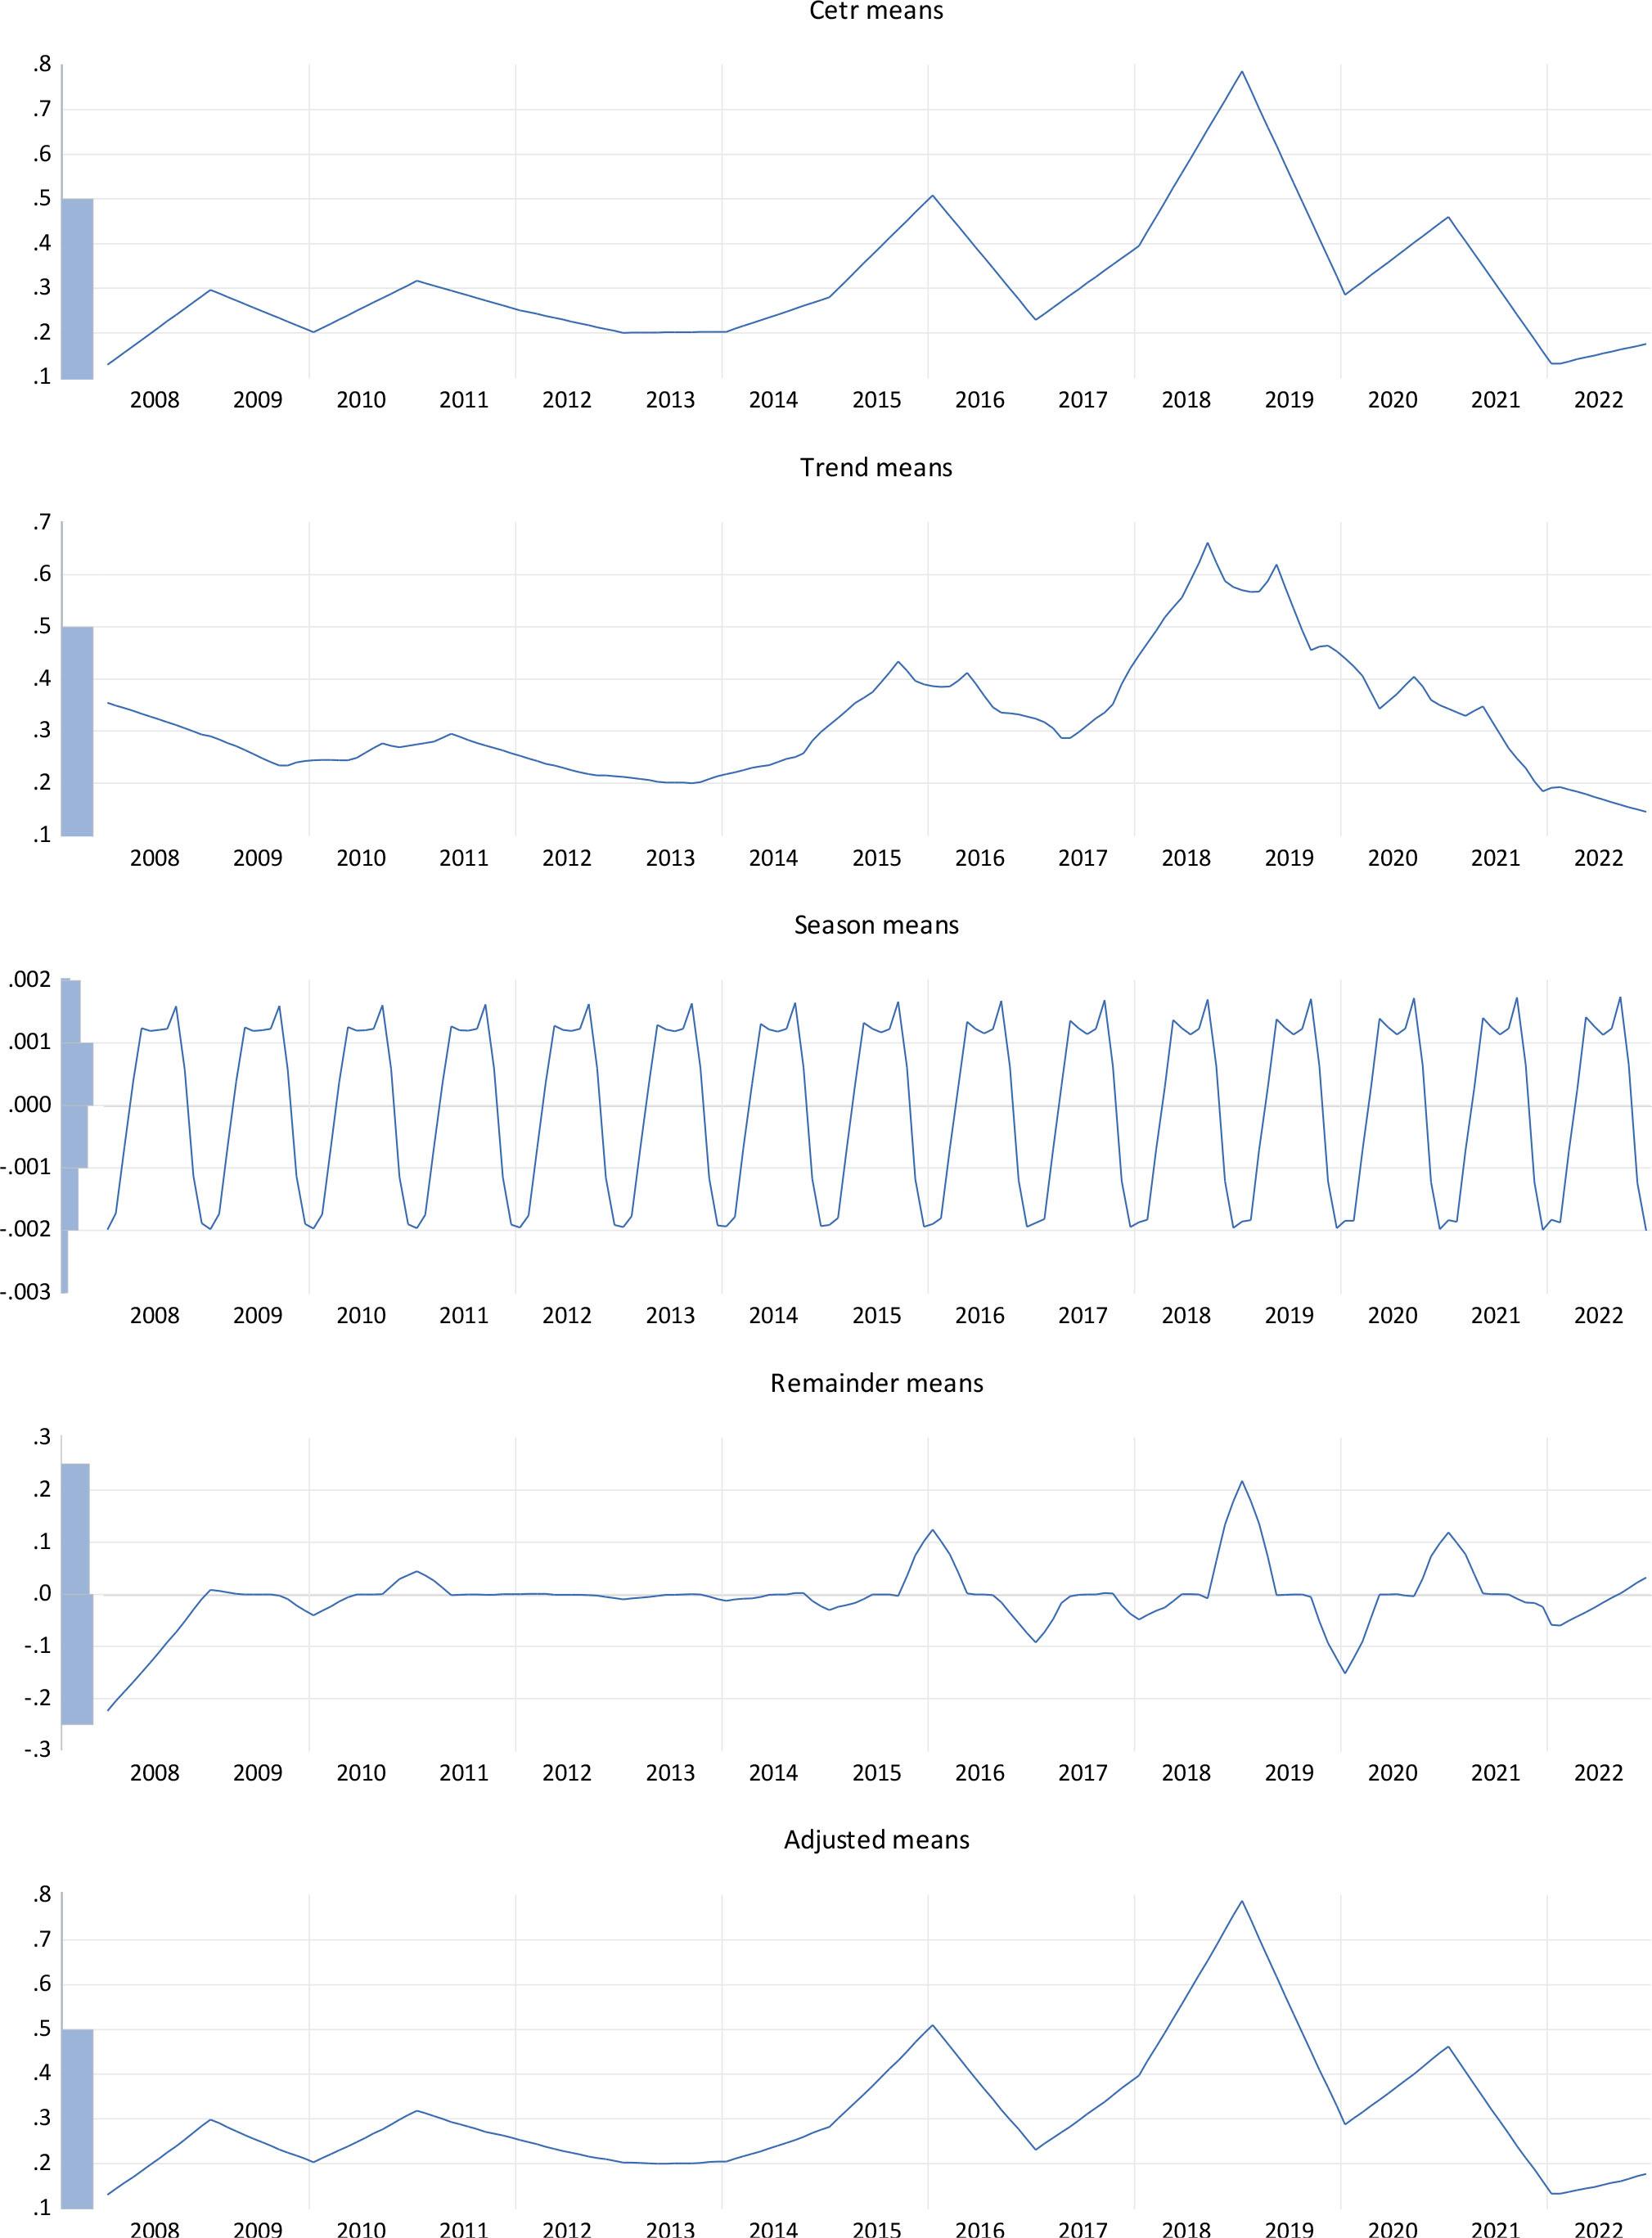
Disaggregated Observable Patterns in the CETR
(Source: Generated from Eviews version 12.0)
The preliminary estimations include the descriptive analyses and the correlation matrix. The results of the estimation of the descriptive properties are captured in Tables 5 and 6. Table 5 presents the statistics of the variables of interest, while Table 6 captures the control variables. It can be observed from Table 5 that the average cash effective tax rate (CETR) of the banks within the study periods stands at 0.3129 (i.e., about 31.29%). This is greater than the corporate tax rate of 25%. Despite this good tax response, there is a notable dispersion in the individual data points, as indicated by the high standard deviation in comparison to the mean. The coefficient of variation (CoV) stands at 2.05, demonstrating disturbing volatility. Nonetheless, the high mean value confirms the substantial contribution of the banking sector to tax revenue in Ghana. This means that the sector could be a tax audit target when tax authorities observe a downward or irregular trend, suggesting a possible high tax risk. Therefore, management of these banks may match the severity of any potential liquidity constraints against possible tax risk in responding the consequence liquidity constraints.
Descriptive Analyses of Tax and Liquidity Constraint Variables
(Source: Generated from Eviews version 12.0)
| CETR | NDG | NLG | NLD | |
|---|---|---|---|---|
| Mean | 0.3129 | -0.4182 | -0.2427 | -1.2871 |
| Median | 0.2686 | -0.2230 | -0.1673 | -0.6010 |
| Maximum | 10.8066 | 0.9891 | 0.8773 | 0.0000 |
| Minimum | -1.9509 | -10.3252 | -3.2301 | -18.0997 |
| Std. Dev. | 0.6416 | 0.8575 | 0.3738 | 2.1419 |
| CoV | 2.0505 | 2.0505 | 1.5402 | 1.6641 |
| Observations | 3600 | 3600 | 3600 | 3600 |
Descriptive Analyses of Control Variables
(Source: Generated from Eviews version 12.0)
| AGE | BL | BS | |
|---|---|---|---|
| Mean | 31.2800 | 0.0899 | 3570000000 |
| Median | 23.2083 | 0.0601 | 2340000000 |
| Maximum | 126.0000 | 0.6289 | 25800000000 |
| Minimum | 1.0000 | 0.0000 | 0.000000 |
| Std. Dev. | 25.5988 | 0.0809 | 3790000000 |
| CoV | 0.8184 | 0.9019 | 1.0616 |
| Observations | 3600 | 3600 | 3600 |
The trend analysis in Figure 3 also portrays the sector's strong culture of tax compliance. It is apparent from the figure that the mean of CETR has never dropped to zero. Nevertheless, post-2018, there has been a decline in the average CETR, although it remains positive. The sharp decrease in the post-2018 period is a reflection of the banking crisis experienced in Ghana during 2017–2018. Therefore, the uncertainties surrounding liquidity may have influenced this downward trend.
The study further disaggregated the mean graph of CETR to verify whether the observed trend in Figure 3 is influenced by time-varying outliers and seasonality. The results as captured in Figure 4 suggest that the trend is bank specific and not accounted for by any industrial outliers and seasonality. The seasonality trend remains similar throughout the period. The trend mean and the adjusted mean graphs are observably similar.
The mean values of these proxies showcase their expected negative scores. In absolute terms, Table 5 shows that industrial performance has been relatively good with deposit growth, loan growth, and loan-deposit ratio of 41.82%, 24.27%, and 128.71%, respectively.
Table 6 presents the descriptive statistics of the control variables. The results show that the average age of Ghanaian banks is 31 years. The average leverage referencing long-term liability stands at 8.99% of their total assets, while the bank size is averagely 35.7 billion Ghana cedis. There is some volatility in the observations; however, the degree is lower than tax and constraint variables.
With multiple predictors estimated concurrently, the study checks the presence of possible multicollinearity problem to avoid spurious regression. The results as reported in Table 7 show that there is no multicollinearity problem.
Correlation Matrix of Explanatory Variables
(Source: Generated from Eviews version 12.0)
| CETR | NDG | NLG | NLD | AGE | BL | BS | |
|---|---|---|---|---|---|---|---|
| CETR | 1 | ||||||
| NDG | -0.0251 | 1 | |||||
| NLG | -0.0092 | 0.1114 | 1 | ||||
| NLD | 0.0573 | -0.0059 | 0.0010 | 1 | |||
| AGE | -0.0419 | 0.1322 | 0.2217 | 0.1136 | 1 | ||
| BL | -0.0188 | 0.0505 | 0.1141 | -0.1124 | -0.0036 | 1 | |
| BS | -0.0206 | 0.1087 | 0.0985 | 0.2355 | 0.2332 | 0.0887 | 1 |
The paper estimates the relationship between liquidity constraints and tax liability targeting using the DOLS approach. The estimation of DOLS requires the determination of lag length for optimal lags and leads. This study follows Akaike's information criterion (AIC) to determine the optimal lag as it is widely recognized to exhibit the correct optimal lag even under a small sample size. The study employs this criterion to estimate the cointegration or long-run relationship between tax liability targeting and liquidity constraint with the results captured in Table 8. The results test the null hypothesis of the hypothesis 1 which can be restated as follows:
H01. Liquidity constraints have no significant influence on the tax liability targeting of banks in Ghana.
Tax Liability Targeting and Liquidity Constraints: DOLS Estimation
(Source: Generated from Eviews version 12.0)
| Variable | Coefficient | Std. Error | t-Statistic | Prob. |
|---|---|---|---|---|
| NDG | -1.6031 | 0.0852 | -18.8198 | 0.0000 |
| NLD | -0.3608 | 0.2022 | -1.7842 | 0.0800 |
| NLG | 0.9731 | 0.1344 | 7.2383 | 0.0000 |
| LAGE | 0.6805 | 0.4541 | 1.4987 | 0.1398 |
| LBS | -0.6407 | 0.1796 | -3.5677 | 0.0008 |
| BL | 0.5050 | 0.7868 | 0.6418 | 0.5237 |
| R-squared | 0.9894 | Mean dependent var | 0.2953 | |
| Adjusted R-squared | 0.9683 | S.D. dependent var | 0.2044 | |
| S.E. of regression | 0.0364 | Sum squared resid | 0.0716 | |
| Long-run variance | 9.35E-05 |
It can be seen from Table 8 that the explanatory variables explain significant portion of the variation in the tax liability. All the liquidity constraint proxies have significant coefficients of 90%–99% confidence level. This means that the null hypothesis on all the three proxies of liquidity constraints is rejected. Implying that all the liquidity constraints have significant influence on tax liability targeting.
Specifically, other than the constrained loan growth that exhibits positive influence, the other two variables, constrained deposit growth and loan-deposit ratio, are deleterious or undermine a positive tax response or tax target. This implies that liquidity constraints could lead to aggressive tax planning and regressive tax liability target. The positive coefficient of constrained loan growth may be attributed to free cash arising from holding up of mobilization rather than high loanable funds.
Constrained deposit growth is the most important driver of tax liability target contributing to 1.6031 in achieving minimal tax liability target for a percentage increase in the constrained scenario. This result reflects the fundamental role of deposit in the banks’ intermediary role, and it is core to their fund base so shrink from it or imposed limitation will require a strong response. Loan-deposit constrained is the second most important deleterious to tax liability and a driver of minimal tax liability target. However, constrained loan growth rather provides reverse effect on minimal tax liability target.
The second hypothesis seeks to determine persistence in tax liability target. The hypothesis is recalled in its null form as follows:
Hw2: There is no significant persistence in the tax liability target of liquidity-constrained banks.
The study first determines the nature of the persistence, whether a permanent or temporary persistence. The results are captured in Table 9. It can be seen that tax liability target is stationary at even 1% in composite terms. This means that the persistence is not infinite rather it is temporary persistence. This means that when the liquidity situation improves, it can easily dissipate over time. It also implies that policy intervention by government including liquidity support could dissipate the observable minimal tax liability target of the constrained banks. In terms of the individual cross-sectional analysis, all the banks exhibit temporary persistence other than ADB, FNB Bank, and UBA. This suggests that the persistence is infinite for these banks, thus difficult to dissipate.
Persistence Analysis: Composite and Cross-Sectional Unit Root Test
(Source: Generated from Eviews version 12.0)
| Method | Statistic | Prob.** |
|---|---|---|
| ADF, Fisher chi-square | 226.312 | 0.0000 |
| ADF, Choi Z-stat | -11.1493 | 0.0000 |
Probabilities for Fisher tests are computed using an asymptotic chi-square distribution. All other tests assume asymptotic normality.
| Intermediate ADF test results: individual cross sections | ||||
|---|---|---|---|---|
| Cross section | Prob. | Lag | Max Lag | Obs |
| ADB | 0.3684 | 2 | 2 | 177 |
| ABSA | 0.0028 | 2 | 2 | 177 |
| ACCESS | 0.0049 | 2 | 2 | 177 |
| BoA | 0.0016 | 2 | 2 | 177 |
| CAL BANK | 0.0016 | 2 | 2 | 177 |
| ECOBANK | 0.0035 | 2 | 2 | 177 |
| FNBBANK | 0.1193 | 2 | 2 | 177 |
| FIRST ATLANTIC | 0.0018 | 2 | 2 | 177 |
| NIB | 0.0643 | 2 | 2 | 177 |
| GT BANK | 0.0002 | 2 | 2 | 177 |
| PRUDENTIAL | 0.0002 | 2 | 2 | 177 |
| REPUBLIC | 0.0005 | 2 | 2 | 177 |
| STANBIC | 0.0005 | 2 | 2 | 177 |
| STANDARD CHARTERED | 0.0036 | 2 | 2 | 177 |
| UMB | 0.0003 | 2 | 2 | 177 |
| ZENITH | 0.0029 | 2 | 2 | 177 |
| FIDELITY | 0.0011 | 2 | 2 | 177 |
| SOCIETE G. | 0.0143 | 2 | 2 | 177 |
| GCB | 0.0002 | 2 | 2 | 177 |
| UBA | 0.9016 | 2 | 2 | 177 |
Having determined the nature of the persistence, the study employs impulse response function (IRF) to determine the degree of the persistence. Figure 5 presents the results of the impulse response. Figure 5 shows that the tax liability target (i.e., maximum tax target) is about 0.18 (i.e., the peak of the response). This is very low as it accounts for about only 58% of tax liability without liquidity-constrained scenario (refer to Table 6 for comparison). It can also be observed from the graph that it would take about 17 months for half of the tax liability target in response to the liquidity to dissipate and 34 months for a complete dissipating. This shows a very high persistence.
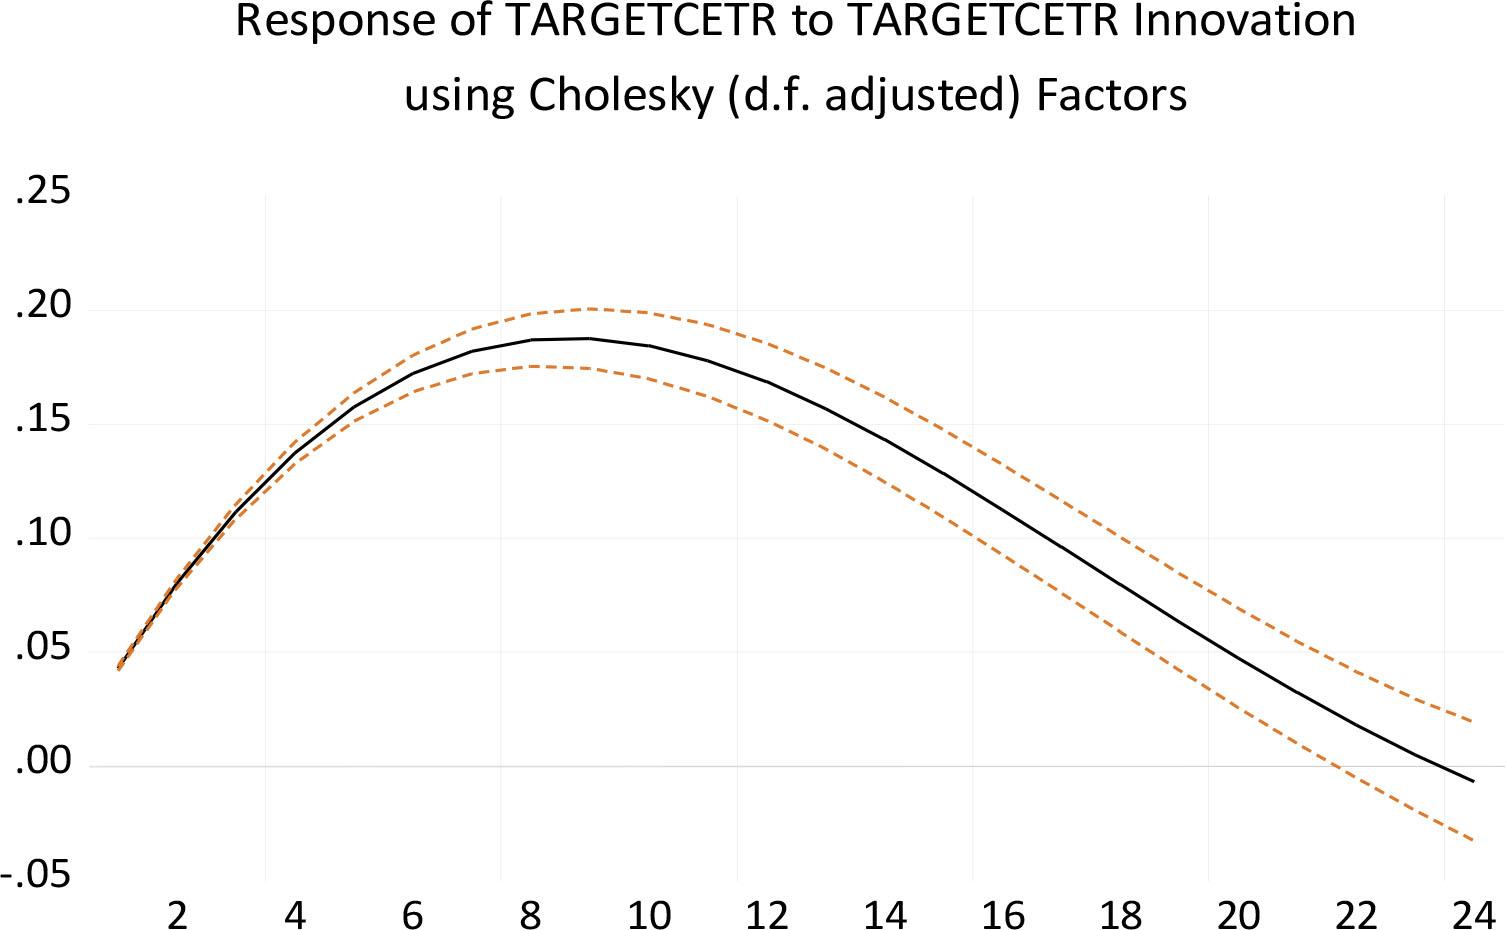
Impulse Response: Degree of Persistence in Tax Liability Target
(Source: Generated from Eviews version 12.0)
Having demonstrated that liquidity constraint scenario within the Ghanaian can lead to negative tax liability pattern or targets and evidence of high persistence, it is important to determine the delay in response or the speed to adjust to the new tax liability targets for tax savings. This is the focus of the third hypothesis. It is also recalled as follows:
Hw3: There is a high speed of adjustment of tax liability targeting (low delay to convergence) in response to liquidity constraints of banks in Ghana.
This hypothesis is quite relevant as the coefficientbased cointegration alone is not enough to determine the full extent of the impact of these liquidity constraints on tax targeting and policy. The severity of the negative effects of liquidity constraints on tax liability targeting depends on how quickly banks can leverage these constraints to generate tax savings that account for tax and regulatory risks (Alm, et al., 2019; Seidu, et al., 2021). This implies that evaluating the implications of liquidity constraints in achieving tax targets (such as savings) should consider the timing or speed of the tax liability target response to the liquidity constraint scenario, which affects predictability. Therefore, a thorough analysis of the speed of adjustment (SOA) is essential. This study goes beyond just examining cointegration by focusing on SOA.
The SOA follows the delay measure, which is also built from the long-run estimates. This would require the presence of cointegration in the DOLS estimates. The study tests this cointegration using the commonly used residual-based approach with the results captured in Table 10. The residual-based cointegration via ADF is not analyzed in a standalone manner but is instead compared to the critical values. Similar to all estimations in this investigation, the EViews computation followed the inherent probability values obtained from the MacKinnon response surface simulation findings. It is noticeable that the null hypothesis is rejected as the p-values fall below 1%. This indicates that the residuals from DOLS do not exhibit a unit root; thus, the coefficients in Table 10 serve as cointegration estimates.
Unit Root of the Residuals
(Source: Generated from Eviews version 12.0)
| Method | Statistic | Prob.** |
|---|---|---|
| Im, Pesaran and Shin W-stat | -7.11459 | 0.0000 |
| ADF, Fisher chi-square | 138.826 | 0.0000 |
| PP, Fisher chi-square | 164.969 | 0.0000 |
The estimates of DOLS is used as baseline values to estimate the delay-to-tax target using the delay model. Subsequent to the delay-to-tax target, the study applies half-life model to estimate the half-life and eventually the speed of adjustment. The results are presented in Table 11. It is evident from the findings that under liquidity constraint scenario, it would take just 12 days for the banks to infuse constrained deposit growth information to achieve half of the tax liability target, while it would also take about 16 days to achieve the same tax target with constrained loan-deposit. Moreover, it would take 23 days for half of the loan growth constraint information to be integrated to achieve convergence to banks’ tax targets.
Delay Measure, Half-Life, and Speed of Adjustment
(Source: Generated from Eviews version 12.0)
| Variable | Coefficient | Delay | Half-Life | *SOA Rate per Month | Distance to Target in Month |
|---|---|---|---|---|---|
| NDG | -1.6031 | 0.1675 | 0.3880 | 257.73% | 12 days |
| NLD | -0.3608 | 0.4108 | 0.7791 | 128.36% | 23 days |
| NLG | 0.9731 | 0.2743 | 0.5358 | 186.64% | 16 days |
Speed of adjustment rate per month of half-life
The results from the estimations indicate slow rate of delay to tax liability target and therefore higher speed of adjustment to convergence of tax liability tax under liquidity-constrained scenario. Besides the SOA, there is high persistence of the evolving tax liability target arising from the constraint as evidenced by the similarities in all the three liquidity constraint scenarios in the speed of achieving the tax target. Thus, with SOA rate of 128.36%–257.73% per month, there is a strong persistence in the liquidity constraint-tax target convergence. This implies that if no preventive and constraint support policy is taken by the government, and Bank of Ghana, the banks will not be fully ready for a sustained positive tax response, leading to aggressive tax targeting when confronted with liquidity constraint.
The results show that under a liquidity constraint scenario, the banks would be quick to engage in aggressive tax-saving activities to achieve a minimal tax liability target. This is not only consistent with the study a priori but also supports the assumptions of the extended parallel process model or theory (EPPM). An important theoretical implication emanating from EPPM is that since liquidity constraints may lead to panic withdrawals and threaten business continuity, banks will engage in aggressive cash retention and cash-savings interventions, including tax-savings scheme to minimize the impact of the risk.
Empirically, the evidence in this study disaffirms the conclusion reached in Campbell, et al. (2023). Contrary to the findings in this study, Campbell, et al. (2023) concluded that outside United States of America (USA), the relationship between financial constraints and tax planning is negative. Nevertheless, the findings in this study corroborate the general financial constraint literature that provides that financially constrained firms are more likely to engage in aggressive tax avoidance as an alternative cash savings to minimize the exposure for respite (Edward, et al., 2016; He, et al., 2020; Seidu, et al., 2021). Consistent with the evidence in this study, Law and Mills (2015) also observed that financially constrained companies follow more aggressive tax liability reduction strategies both present and in the future. This implies that constrained banks could increase internally generated funds through tax planning (Edwards, et al., 2016; Seidu, et al., 2021).
The strong tax-targeting response from liquidity constraints observed in this paper reflects Ghana's relatively underdeveloped capital market that makes external funding costly, particularly for financially constrained firms. As a result, one practical implication of the findings is that Ghanaian banks often view tax savings achieved through tax avoidance strategies as an attractive means of addressing liquidity needs.
Evidence of increasing tax liability targeting (i.e., minimal tax payment) arising from liquidity constraints further implies that liquidity constraints could magnify the current troubling contraction effect on the government of Ghana’s tax revenue. This could also have spillover effect on other sectors of the Ghanaian economy due to obvious lending constraints to other sectors and ultimately decreasing tax revenue base.
The findings also show that the tax liability target from liquidity constraints is sticky as evident in the high degree of persistence. This implies that practically Ghanaian banks exhibit foresight for potential liquidity constraints and they proactively implement interventions or strategies, including tax avoidance tactics, to bolster cash reserves during periods of liquidity stress through tax targeting. The high persistence implies that a tax target when achieved will be difficult to revert to the original mean trend of tax liability or it will take a long period to dissipate.
Given the evidence of high persistence in the tax liability target of Ghanaian banks, policymakers must exercise caution in tax administration and policy aimed at aggressive tax revenue mobilization. The consequences of such tax administration and policy can have far-reaching impacts on the banks’ response, especially when the banks feel threatened or overburdened by such policy. Conversely, tax interventions targeting improved tax revenue or stabilization of revenue with a favorable disposition from taxpayers (including banks) can yield prolonged benefits due to the persistent effects on tax target trajectories.
The persistence of the tax liability target is seen in a positive light for the banks and negative for the government in terms of threats to meeting the tax revenue target in the midst of a banking crisis. However, this persistence in tax behavior (i.e., tax target) also implies that when the shock to tax liability is favorable, it will take a long time for the positive effect to be reversed or dissipated.
The analysis of delay to target or speed of adjustment shows that the tax response to meeting half of the minimal tax liability target for all three liquidity constraint proxies has an average of 17 days with the fastest rate to target being 12 days and the maximum of 23 days. The findings have theoretical implications in respect of the extended parallel process model or theory (EPPM). The slowness of the delay to target and the evidence of the high speed of adjustment to the tax liability target affirms the EPPM assumption that when the severity of risks and the likelihood of occurrence is high, individuals and firms would be quick to take protective action to avoid or reduce the threat (Murray-Johnson, et al., 2004; Yoo, et al., 2022). This is not surprising as liquidity constraint is viewed as a severe risk factor which can lead to mistrust, panic withdraw, and even collapse of banks. Therefore, when this risk is perceived or observed, management of these banks will react swiftly to minimize the exposure through internal reorganization to improve the cash flow situation.
The high fast rate of adjustment to tax liability target implies that practically, banks that might not have considered tax planning opportunities during the non-constraints’ periods are more inclined to exercise them during constrained times by altering their tax response. This also suggests that if no preventive and constraint support policy is instituted by the government, and Bank of Ghana, banks will not be fully ready for a sustained positive tax response leading to aggressive tax targeting when confronted with liquidity constraints and leading to poor tax revenue from these important taxpayers.
The results also contribute to the existing tax literature and highlight the importance of expanding firm-level targeting models in this field (i.e., banking literature). The discovery of significant convergence (i.e., reduced delay) in the analysis suggests the presence of deliberate hidden tax activities among Ghanaian banks, raising concerns about tax policies. This aligns with the substantial tax losses observed in the banking sector in 2022, following the threat of domestic debt restructuring in Ghana.
The dynamics to convergence persist across the three liquidity constraint scenarios and evolving. This indicates a continued focus on tax liability management in light of liquidity constraints. While this may benefit banks (i.e., taxpayers), it also highlights the potential impact on government tax revenue, necessitating a proactive regulatory approach to mitigate revenue losses. The liquidity constraint poses challenges for tax revenue generation by the government and influences risk-adjusted tax savings for banks in Ghana. Given banks’ role as a significant taxpayer and concerns about liquidity risks, the government is expected to adjust its overall policy framework to promote stability in the Ghanaian banking industry and optimize tax revenue outcomes.
The evidence of high speed to tax target convergence (i.e., aggressive tax activities) may be extrapolated to suggest that aggressive tax planning may be a symptom for a financially constrained firms (i.e., liquidity constraint). Investors and financial analysts could, therefore, use the tax liability trend as a baseline to identify stressing scenarios, including liquidity constraints.
This paper examined the dynamics of tax liability targeting and liquidity constraints of banks in Ghana. Monthly data extracted and converted from audited annual reports spanning from 2008 to 2022 using Denton procedure and dynamic ordinary least square, impulse response function (IRF), delay, and half-life were used for the empirical analysis. Data were converted from low frequency to high frequency for more accurate volatility estimation and precision. The results indicate that liquidity constraint scenario may prompt aggressive tax planning to reduce vulnerability to the liquidity risks. Consequently, the presence of liquidity constraints in the Ghanaian banking sector could have negative implications for government tax revenue, as banks might resort to tax liability targeting to achieve tax savings adjusted for risk.
This research also shows that the tax liability target from liquidity constraints is sticky as evident in the high degree of persistence. The high persistence implies that a tax target when achieved will be difficult to revert to the original mean trend of tax liability or it will take a long period to dissipate. It further highlights the rapid adjustment or alignment with tax targets in response to liquidity constraints, underscoring the banks’ perceived severity of the impact of regulatory penalties and the survival of banks. The study suggests that liquidity constraints play a crucial role in tax liability targeting. The observed high convergence rate (i.e., minimal delay) in the analysis suggests the existence of deliberate hidden tax activities among Ghanaian banks, posing a significant tax policy challenge.
It is recommended that the government of Ghana and the Bank of Ghana should collaborate with the banks to institute preventive and constraint support policies for the banks. This is critical as the banks will not be fully ready for a sustained positive tax response, leading to aggressive tax targeting when confronted with liquidity constraints and leading to poor tax revenue from these important taxpayers. The recommended liquidity support and the ease of access are highly recommended to maintain or improve the current positive tax response of the Ghanaian banks as the fear of liquidity constraint may cause banks that might not have considered tax planning opportunities during the nonconstraint periods to be more inclined to exercise them during constrained times by altering their tax response. This could address uncertainties that could jeopardize liquidity and essentially prevent harmful tax-targeting strategies. Tax authorities should conduct regular stress tests on anticipated tax revenue collection under liquidity constraint scenarios across various industries to identify and mitigate potential risks.
Following the evidence of persistence in tax liability target, negative shocks (i.e., liquidity constraints) in the banking sector could have far-reaching impacts on the banks’ response, especially when the banks feel threatened or overburdened by such policy. However, tax interventions targeting improved tax revenue or stabilization of revenue with a favorable disposition from taxpayers (including banks) can yield prolonged benefits due to the persistent effects on tax target trajectories. It is, therefore, recommended that the government of Ghana and tax authorities should be cautious of this implication when introducing new tax policies.
This study has provided comprehensive insight into liquidity constraints and tax liability targeting dynamics, including persistence in tax liability target and delay to target or speed of adjustment. However, the study setting is the Ghanaian banking sector, which is a fraction of the Ghanaian financial sector. It is, therefore, suggested that future studies should extend the implications to other financial sectors including the Ghanaian insurance sector.
Additionally, this paper and its contributions are limited to liquidity constraints in relation to tax liability targeting. Future studies may replicate the methodologies and consider extending the scope to capture solvency constraints, which is one of the two primary metrics for the banking sector.
This study is a micro-level study. Another potential extension of this study for future research would be to employ the subsampling confidence interval approach to investigate the persistence and delay to target dynamics of liquidity constraints and tax liability targeting at macro-level at various spatial scales, such as cross-country level and subregional level analyses. This extension would contribute to a deeper understanding of the complex dynamics driving tax revenue targeting and inform the development of more effective tax mitigation strategies at various spatial scales.