
Table 1.
The summary of the treatments used in this experiment.
| Treatments | Heating | LED lighting | Light intensity (μmol · m−2 · s−1) |
|---|---|---|---|
| T0 (control) | No heating | No LED supplementary | Natural light |
| T1 (heating) | Heating from 17:00 to 08:00, maintaining a minimum air temperature of 25°C | No LED supplementary | Natural light |
| T2 (heating + LED) | Heating from 17:00 to 08:00, maintaining a minimum air temperature of 25°C | Supplementary LED (red: blue = 70:30) between 16:00–22:00 and 06:00–10:00 | Natural + 600 |
| T3 (LED) | No heating | Supplementary LED (red: blue = 70:30) between 16:00–22:00 and 06:00–10:00 | Natural + 600 |
| T4 (continuous high-intensity LED with optimised temp.) | Optimised temperature, maintained throughout cultivation | High-power LED providing a 13-hr photoperiod (06:00–19:00) | Supplementary LED only |
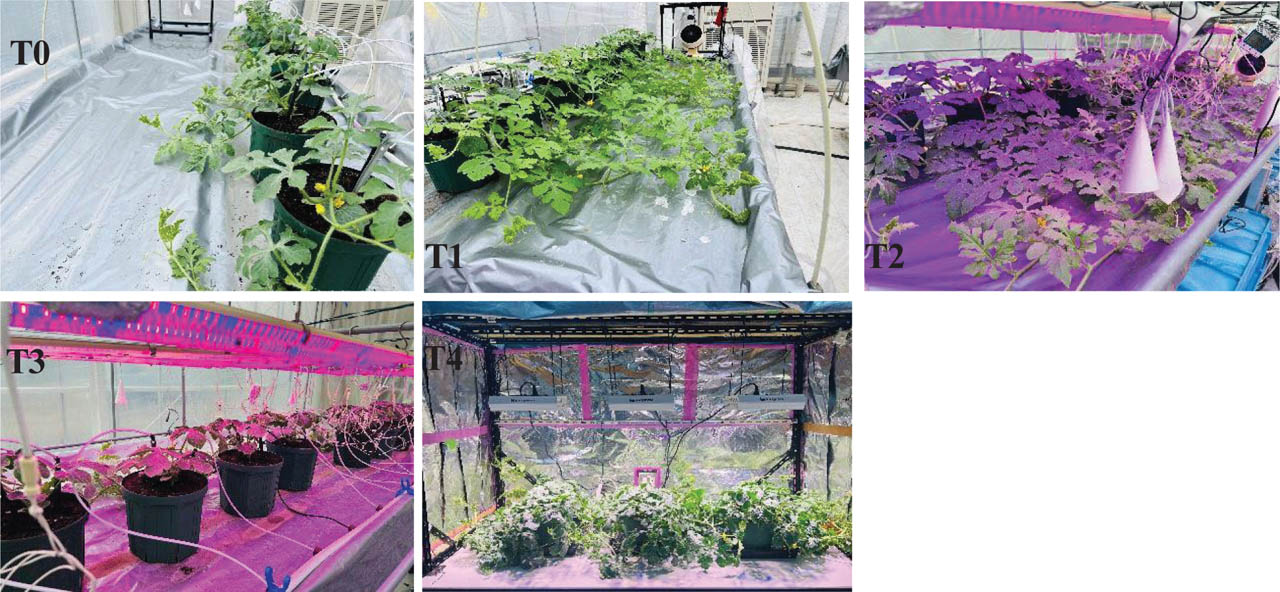
Figure 1.
Schematic diagram of the heating and lighting treatments. For temperature management, temperature sensors were placed centrally within the canopy region to ensure precise control of each treatment zone. The sensor was connected to the small circulating fan heater and set at 25°C. When the temperature dropped below this range, the heater started automatically and maintained a minimum temperature of 25°C, from 17:00 to 8:00. Two types of LEDs were used in this experiment: fluorescent light with red-to-blue ratio of (70:30), and high-power LED light supplied by the W-MAX 2000, with dimensions of 310 mm (L) × 210 mm (W) × 46 mm (H) (SMARUP brand, Shenzhen uplighting technology, Co., Ltd., Shenzhen, China). Here, T0 = control, T1 = heating, T2 = heating + LED, T3 = LED, T4 = continuous bright sunshine hours through a high-power LED with optimised temperature. LED, light-emitting diode.
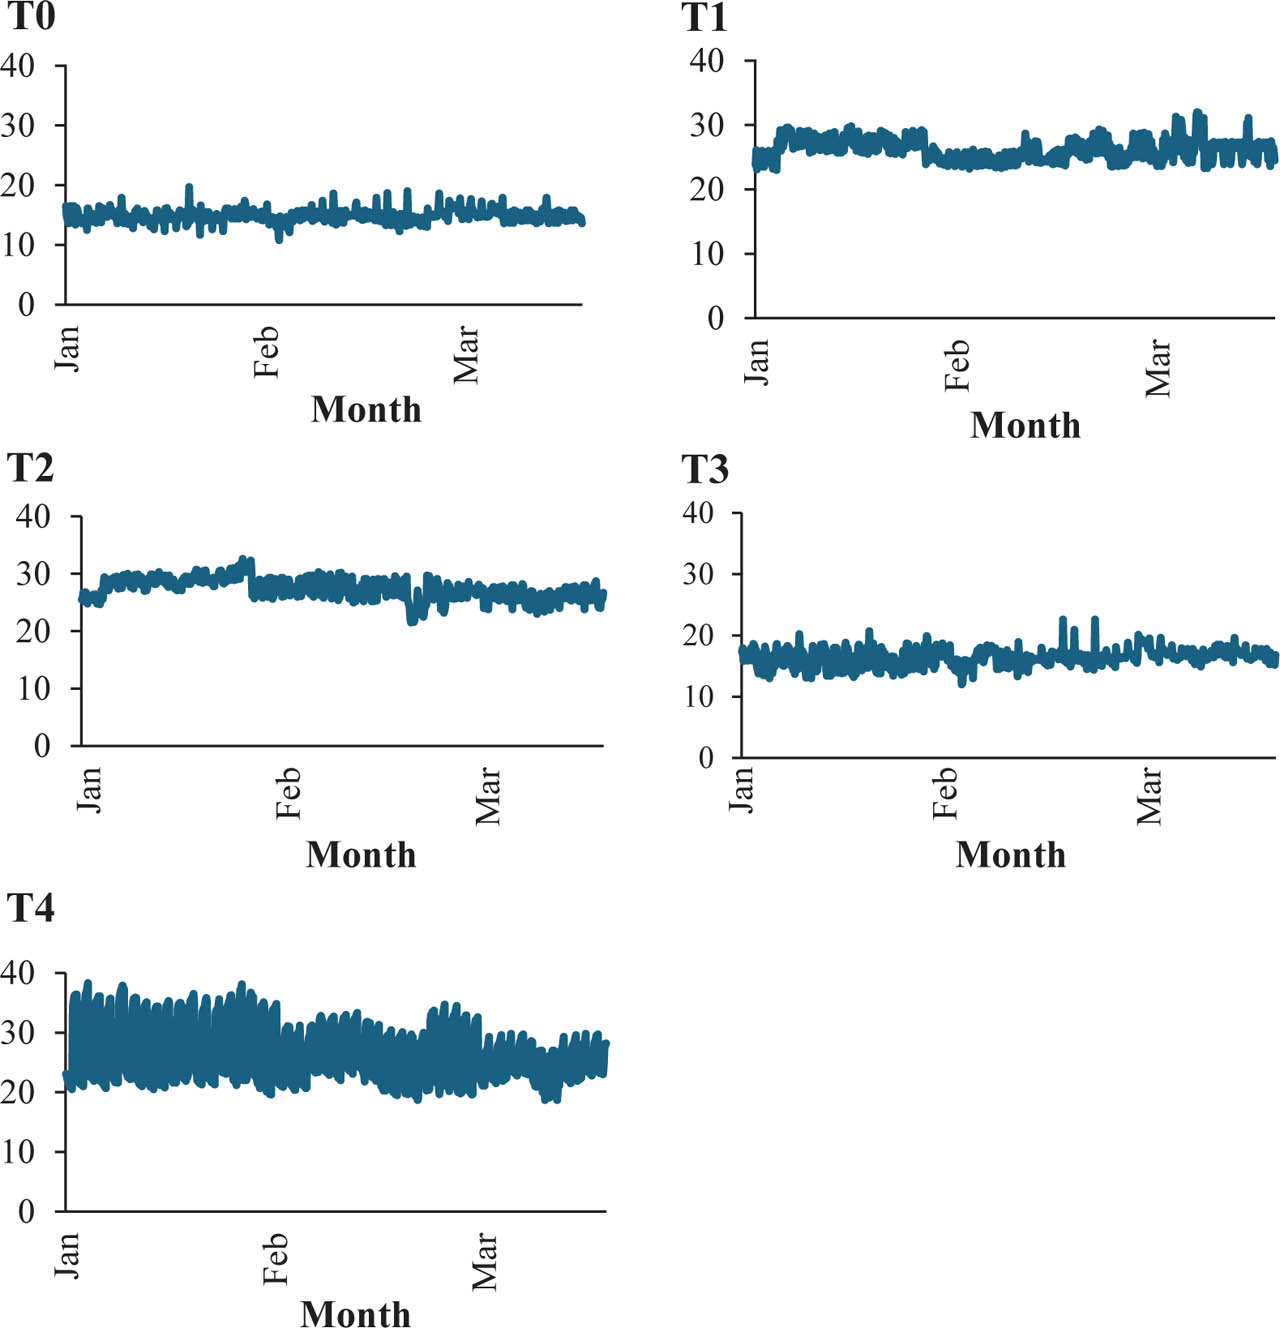
Figure 2.
Temperature manipulation in the canopy zone for each treatment. Temperature was recorded in each treatment separately with a wireless thermos recorder, RTR503B (T & D Corporation, Matsumoto, Japan), during the growing season.
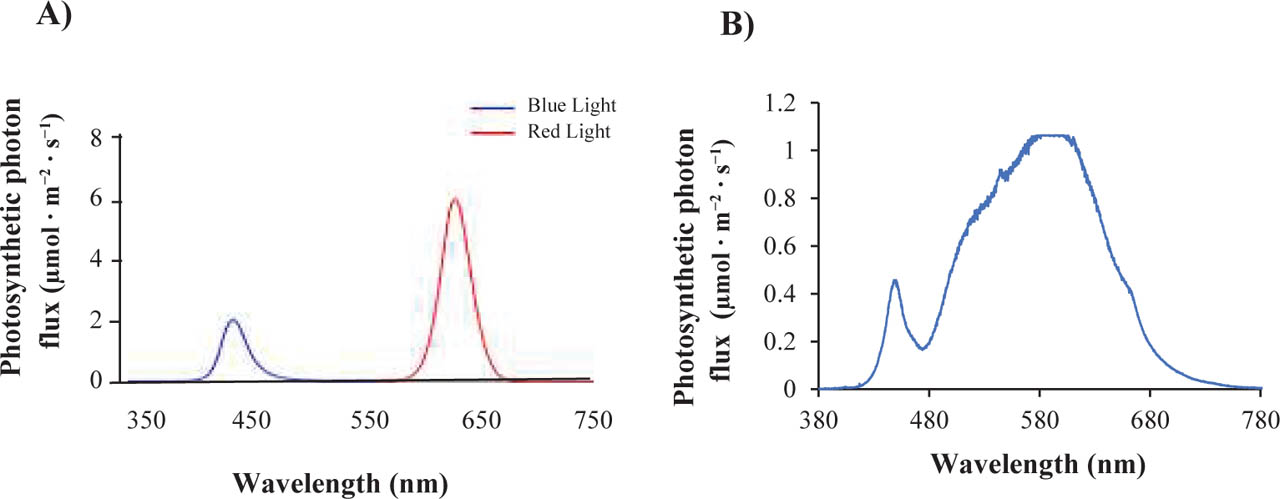
Figure 3.
The spectral photon flux distribution corresponding to each lighting treatment was analysed. (A) The applied red:blue light (70:30) PPF values were 600 μmol · m−2 · s−1 and (B) the applied high-power LED light PPF values were 1500 μmol · m−2 · s−1. Spectral scans of the LED sources were conducted at 1 m beneath the panels. LED, light-emitting diode; PPF, photosynthetic photon flux.
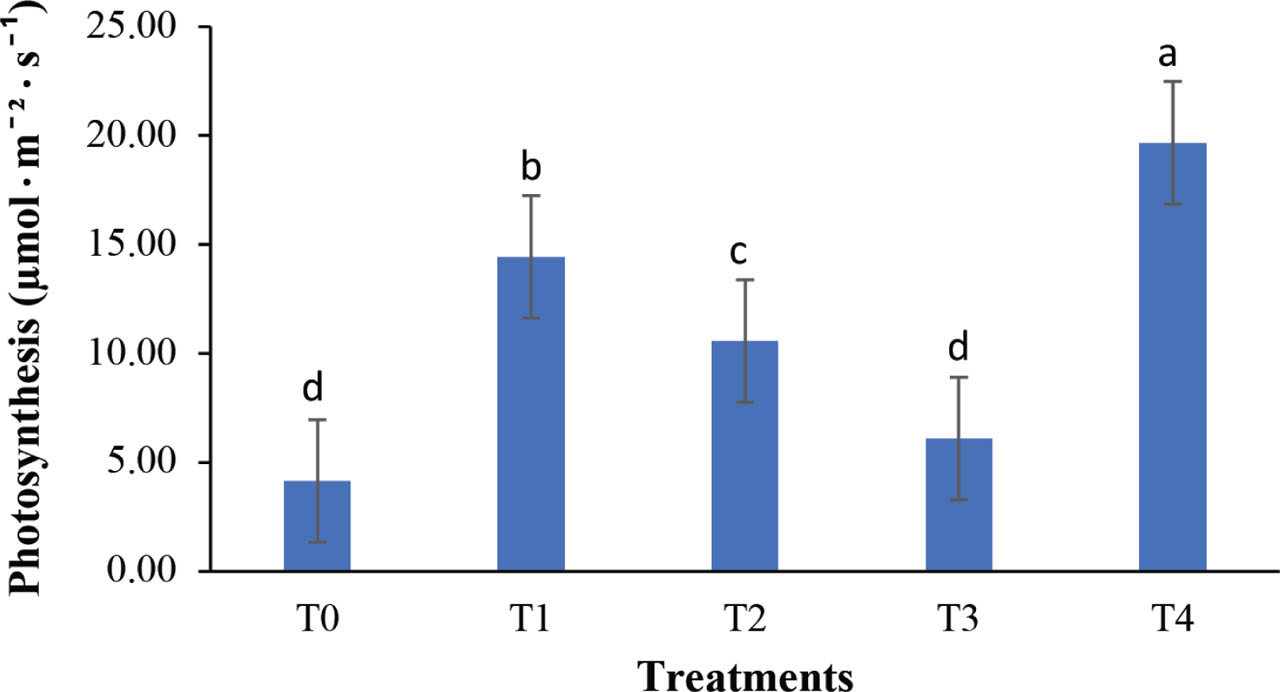
Figure 4.
The photosynthesis rate of plants was influenced by different treatments. Different letters indicate a significant difference (p < 0.05; Tukey's HSD test). Values are the mean ± SD, n = 8. Measurements were taken at 20 DAT. DAT, days after transplanting; HSD: honestly significant difference.
Table 2.
Effects of LED and temperature on contents of SPAD, CO2, chlorophyll a, b and carotenoids in watermelon plant leaves under different treatments.
| Treatments | Chlorophyll index (SPAD) | CO2 (μmol · m−2 · s−1) | Chl a (mg · g−1 FW) | Chl b (mg · g−1 FW) | Carotenoid (mg · g−1 FW) |
|---|---|---|---|---|---|
| T0 | 82.832 c | 425.0 c | 1.41 a | 0.42 b | 0.34 ab |
| T1 | 92.306 b | 429.9 c | 0.99 b | 0.27 c | 0.22 b |
| T2 | 103.507 b | 421.1 c | 1.49 a | 0.42 b | 0.40 a |
| T3 | 97.658 b | 444.6 b | 1.50 a | 0.45 ab | 0.34 ab |
| T4 | 108.132 a | 472.6 a | 1.69 a | 0.58 a | 0.40 a |
Table 3.
Vegetative growth of the plant was influenced by different lighting and temperature conditions among the treatments.
| Treatments | Plant height (cm) | Leaf area (cm2) | Leaf length (cm) | Leaf width (cm) | Node number | Fresh weight (kg · plant−1) |
|---|---|---|---|---|---|---|
| T0 | 40 d | 82.8 b | 12.0 b | 13.8 c | 6.0 d | 0.6 c |
| T1 | 68 c | 94.0 b | 13.0 b | 17.3 b | 10.5 c | 0.5 c |
| T2 | 91 b | 127.7 a | 16.0 a | 19.3 ab | 17.0 b | 0.9 a |
| T3 | 44 d | 88.4 b | 12.5 b | 14.4 c | 7.0 d | 0.8 b |
| T4 | 136 a | 122.1 a | 15.5 a | 19.9 a | 21.6 a | 0.6 c |
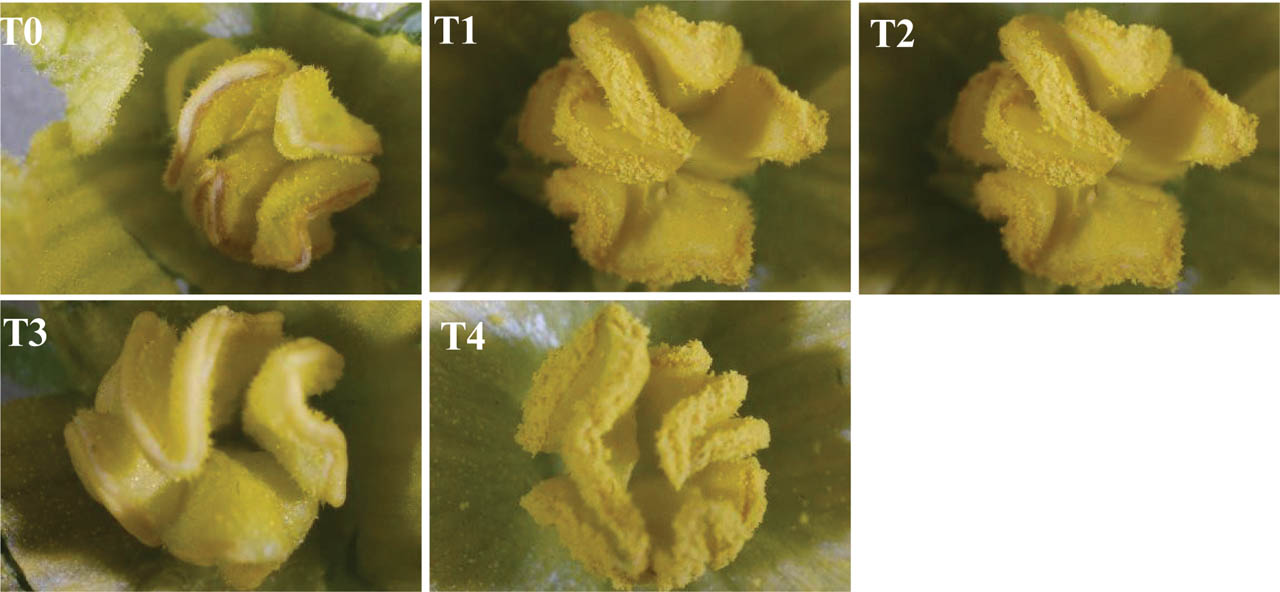
Figure 5.
Effect of different treatments on anther dehiscence and pollen that comes out. The pictures were taken using a binocular microscope with a magnification level of 100×.
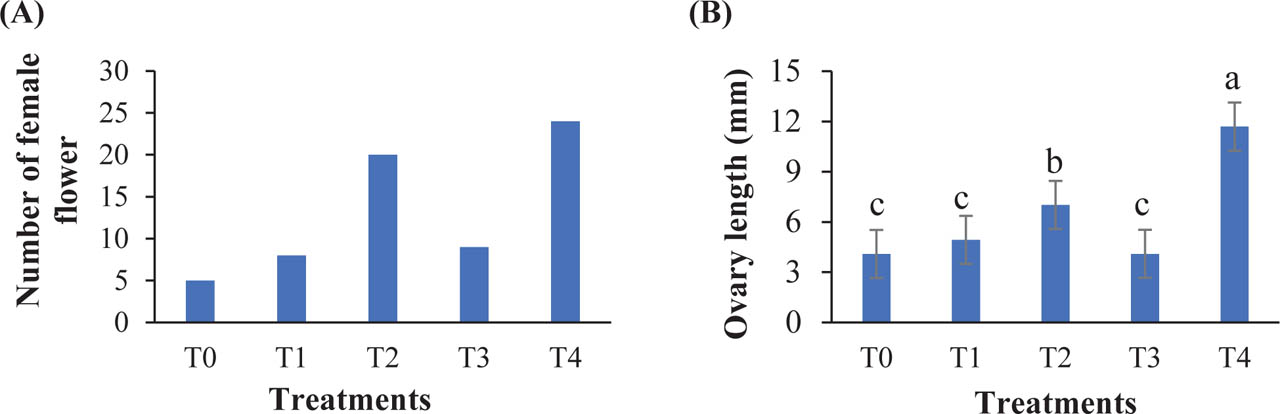
Figure 6.
(A) Number of female flowers and (B) Ovary length as influenced by different treatments. The number of female flowers was counted 20 DAT, and the ovary length was measured just before pollination. Different letters indicate a significant difference (p < 0.05; Tukey's HSD test). Values are the mean ± SD, n = 8. Measurements were taken at 20 DAT. DAT, days after transplanting; HSD, honestly significant difference.
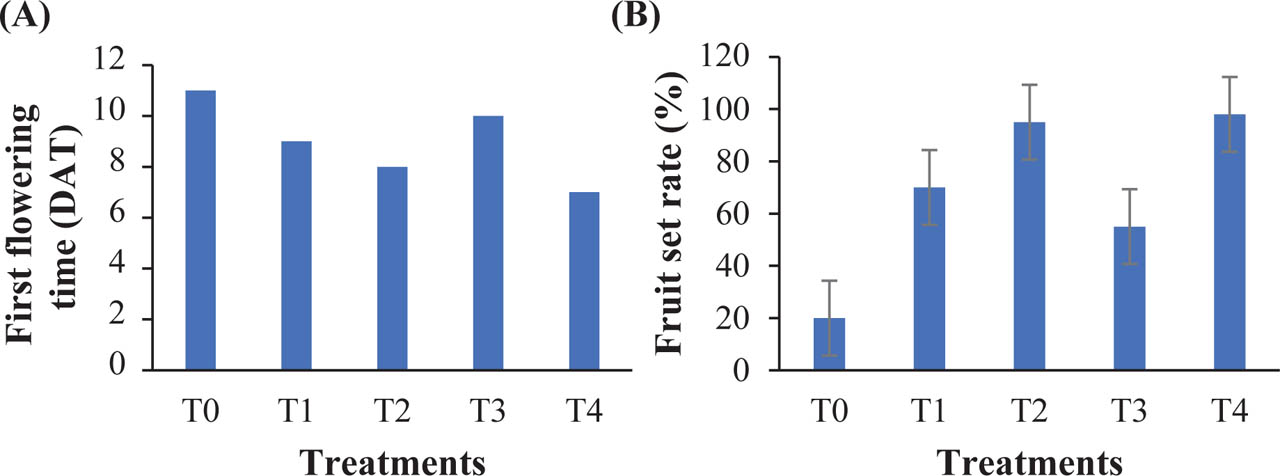
Figure 7.
(A) First flowering time and (B) fruit set rate under different treatments. Values are presented as mean ± SD (n = 8). Different letters indicate significant differences among treatments (p < 0.05; Tukey's HSD test). DAT, days after transplanting; HSD, honestly significant difference.
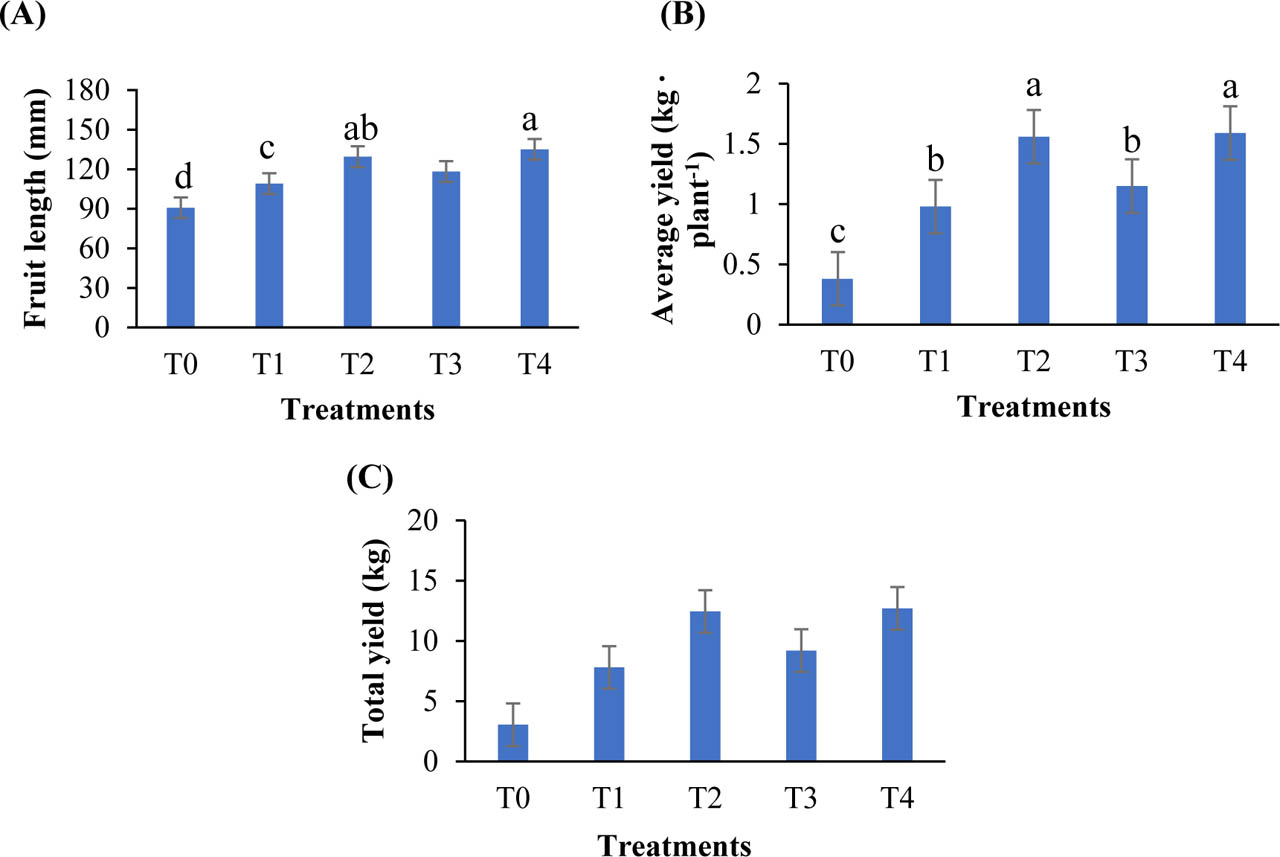
Figure 8.
Influence of treatments on (A) fruit length, (B) average yield per plant and (C) total yield. Values are presented as mean ± SD (n = 6). Different letters indicate significant differences among treatments (p < 0.05; Tukey's HSD test). HSD, honestly significant difference.
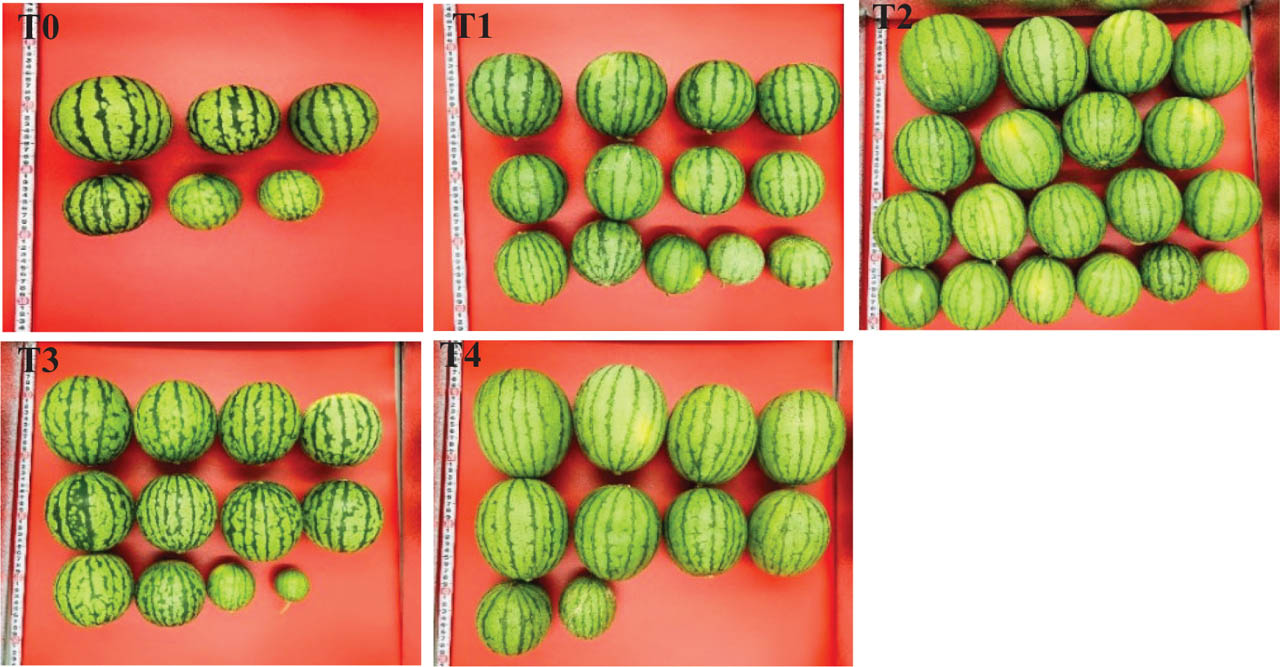
Figure 9.
External fruit appearance, including peel colour, fruit shape and size, as influenced by different treatments.
Table 4.
Different characteristics of fruit with flesh colour of hydroponically grown watermelon in a vertical farming system inside a greenhouse under five different treatments.
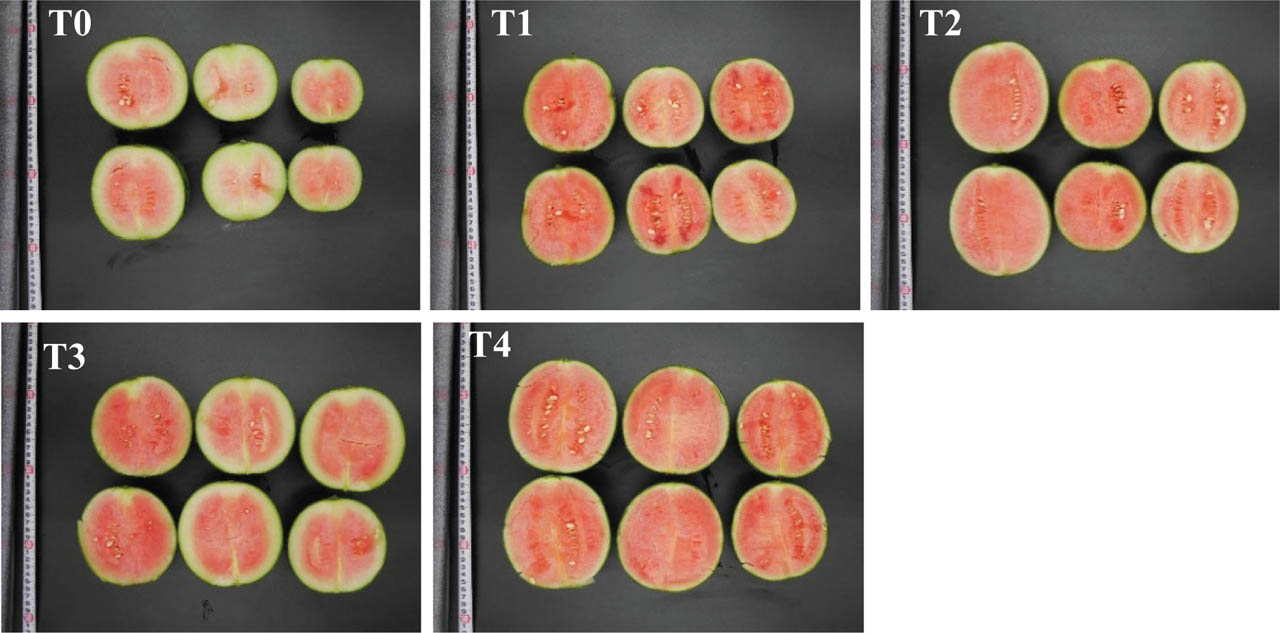
Figure 10.
Internal fruit characteristics, including flesh colour, seed colour, peel thickness and flesh thickness, were evaluated under different treatments.
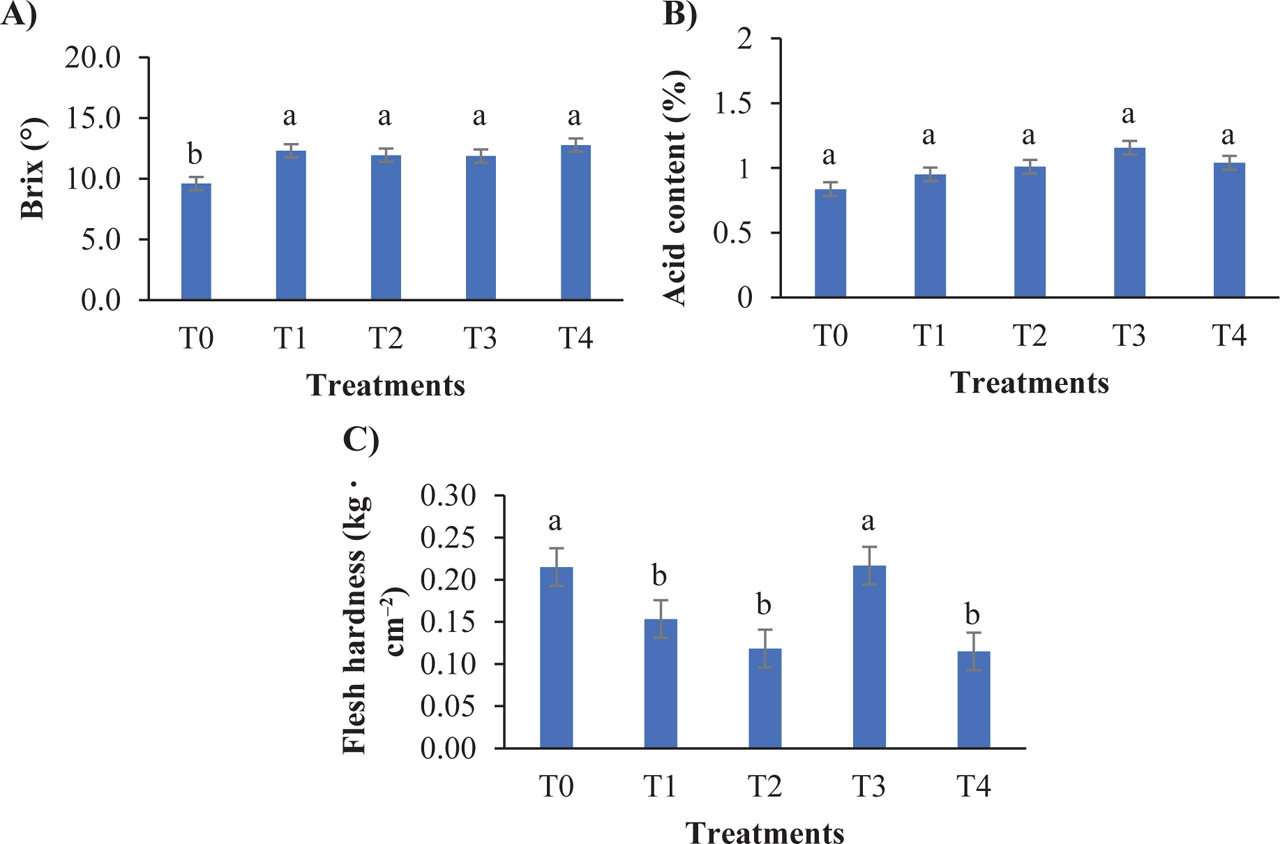
Figure 11.
Influence of treatments on (A) Brix (°), (B) acid content and (C) flesh hardness. Measurements were taken at harvesting time. Values are presented as mean ± SD (n = 6). Different letters indicate significant differences among treatments (p < 0.05; Tukey's HSD test). HSD, honestly significant difference.