
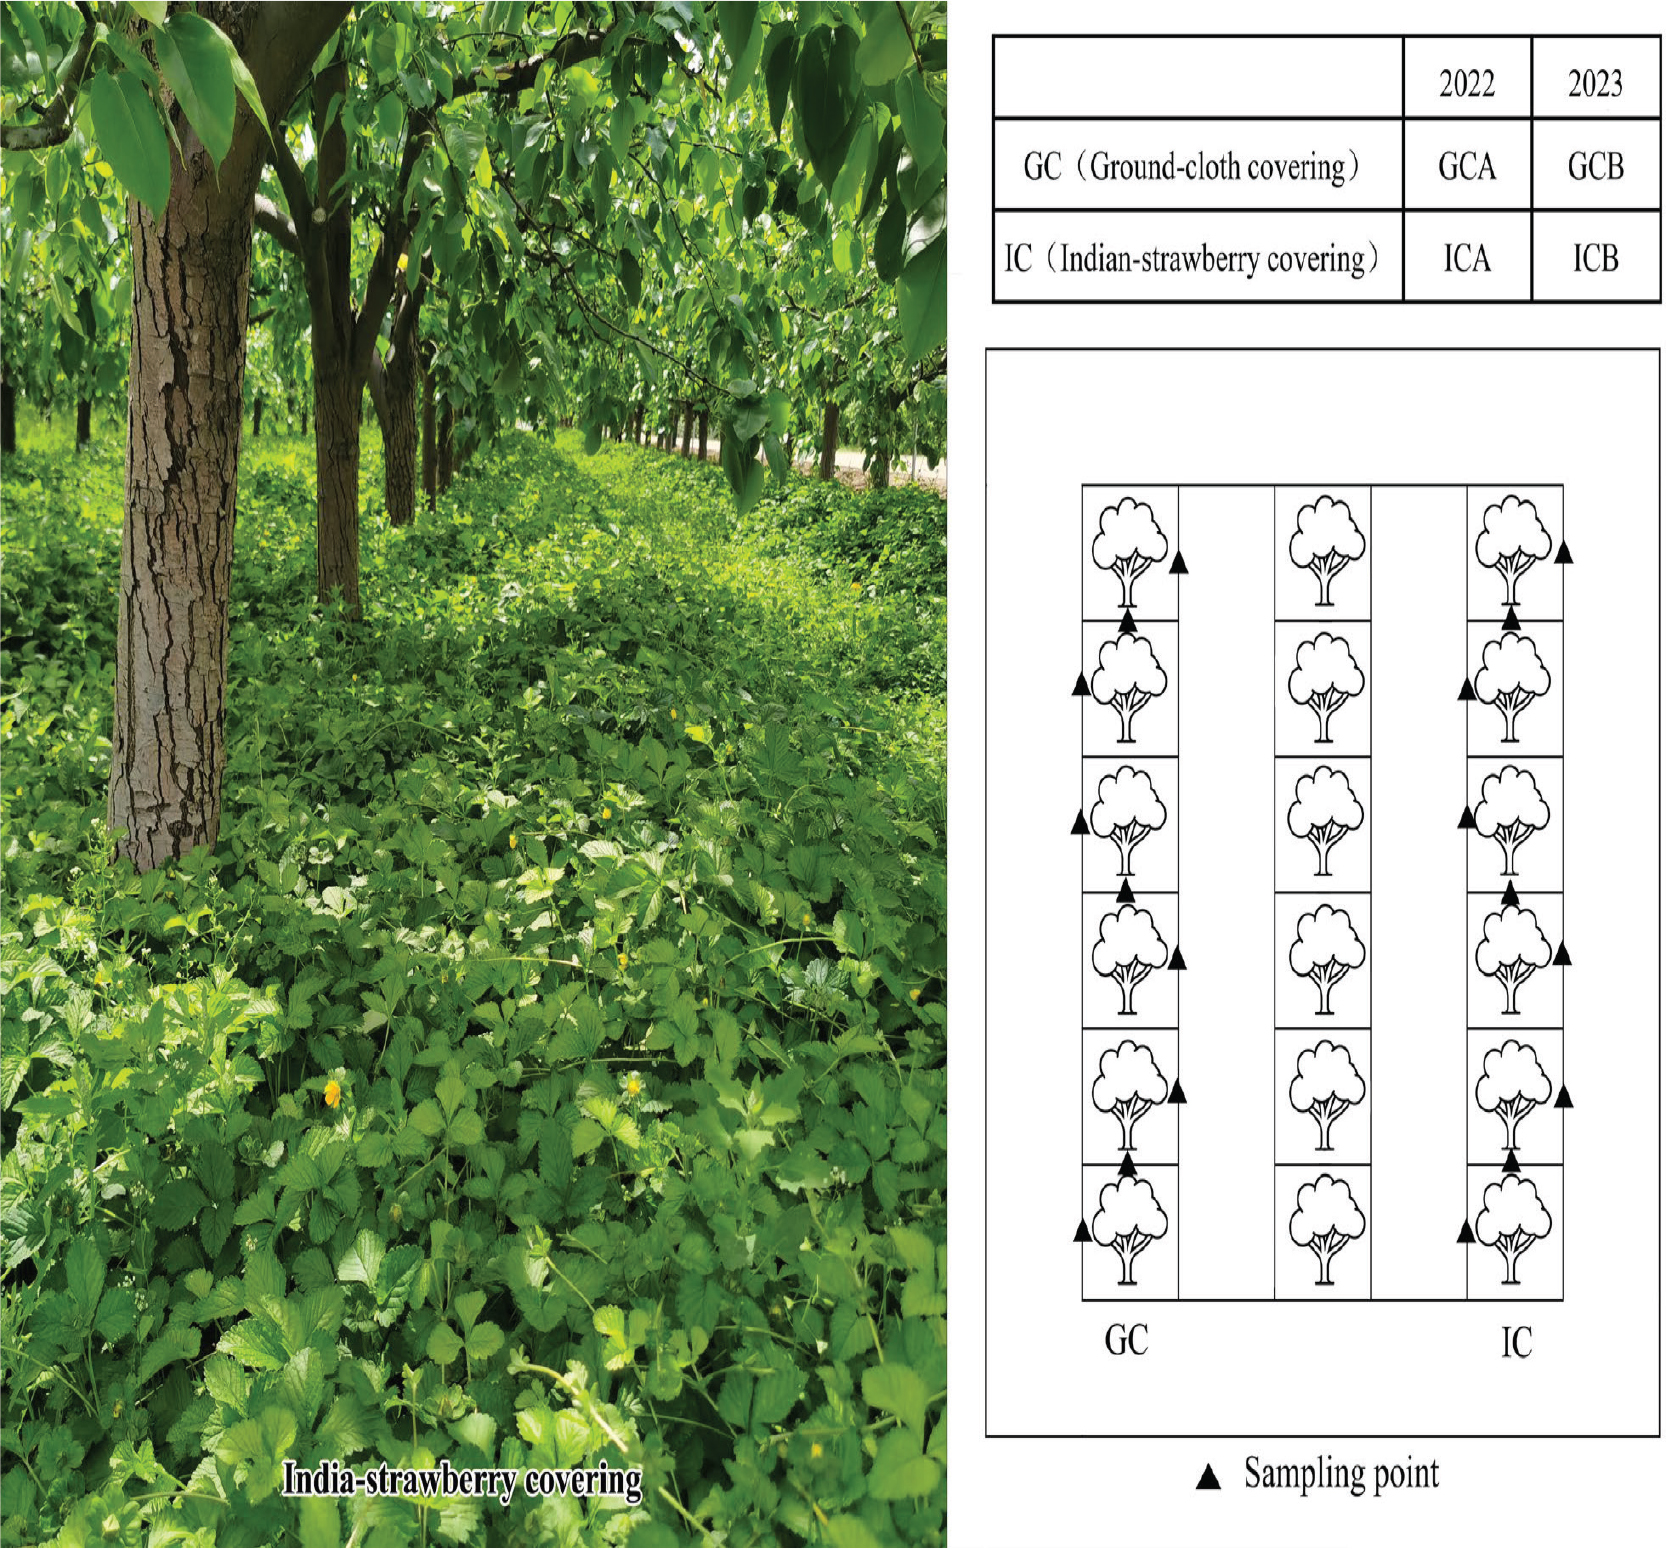
Figure 1.
Experimental design. GC, ground-cloth covering; GCA, ground-cloth covering in 2022; GCB, ground-cloth covering in 2023; IC, Indian-strawberry covering; ICA, Indian-strawberry covering in 2022; ICB, Indian-strawberry covering in 2023.
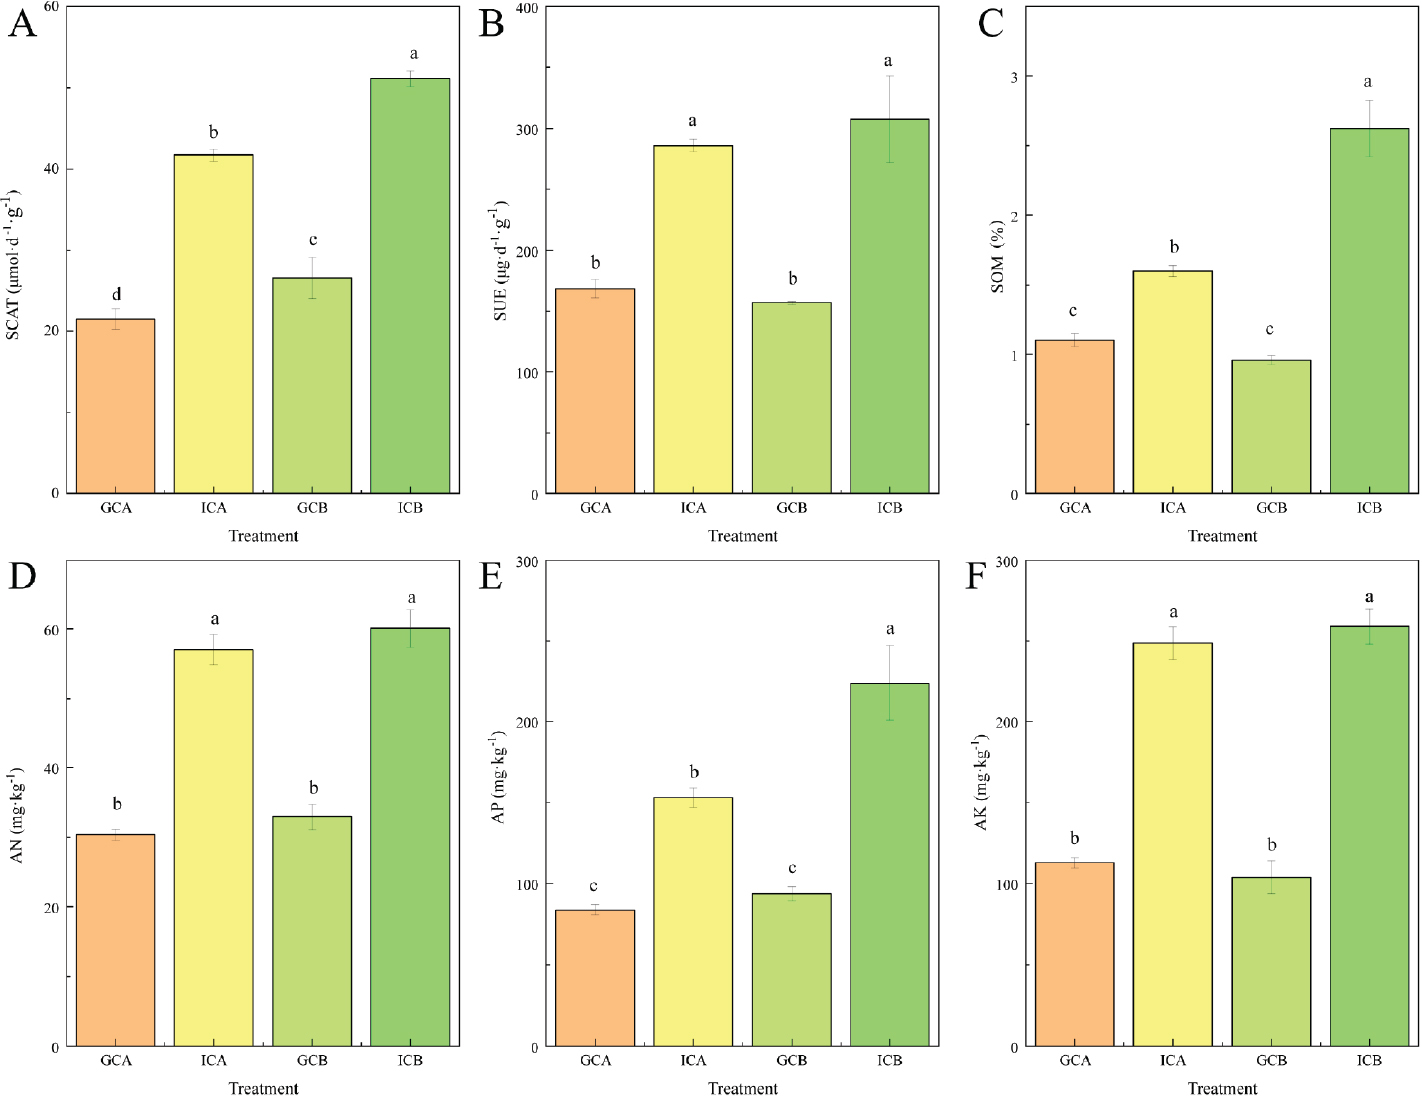
Figure 2.
Soil physical and chemical properties. (A) soil catalase activity; (B) soil urease activity; (C) soil organic matter content; (D) soil available nitrogen content; (E) soil available phosphorus content; (F) soil available potassium content. AK, available potassium; AN, available nitrogen; AP, available phosphorus; GCA, ground-cloth covering in 2022; GCB, ground-cloth covering in 2023; ICA, Indian-strawberry covering in 2022; ICB, Indian-strawberry covering in 2023; SCAT, soil catalase; SOM, soil organic matter; SUE, soil urease.
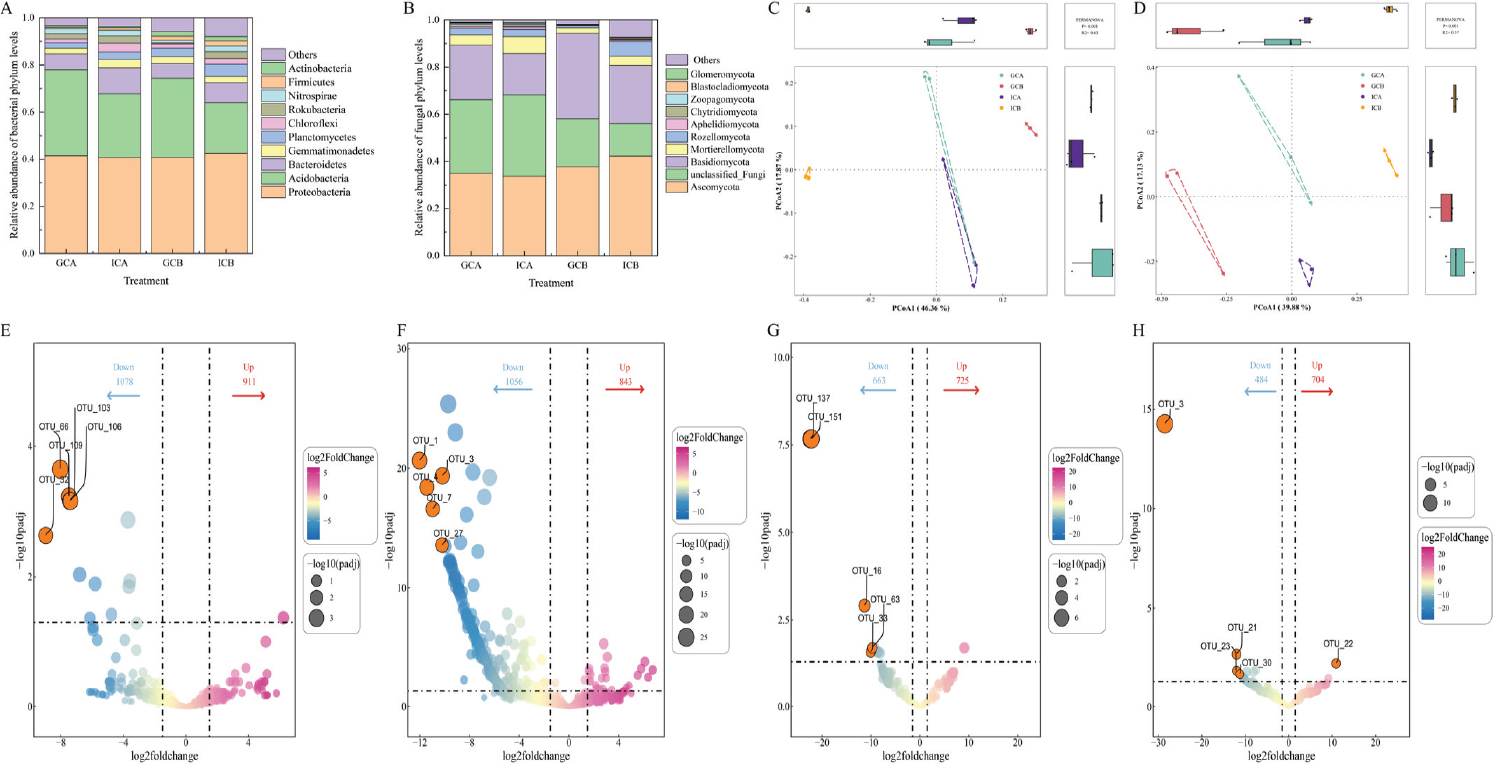
Figure 3.
Microbial community composition and structure. (A) bacterial phylum level; (B) fungal phylum level; (C) bacterial diversity of 2022 and 2023; (D) fungal diversity of 2022 and 2023; (E) 2022 bacteria OTU; (F) 2023 bacteria OTU; (G) 2022 fungi OTU; (H) 2023 fungi OTU. GCA, ground-cloth covering in 2022; GCB, ground-cloth covering in 2023; ICA, Indian-strawberry covering in 2022; ICB, Indian-strawberry covering in 2023; OTU, operational taxonomic unit.
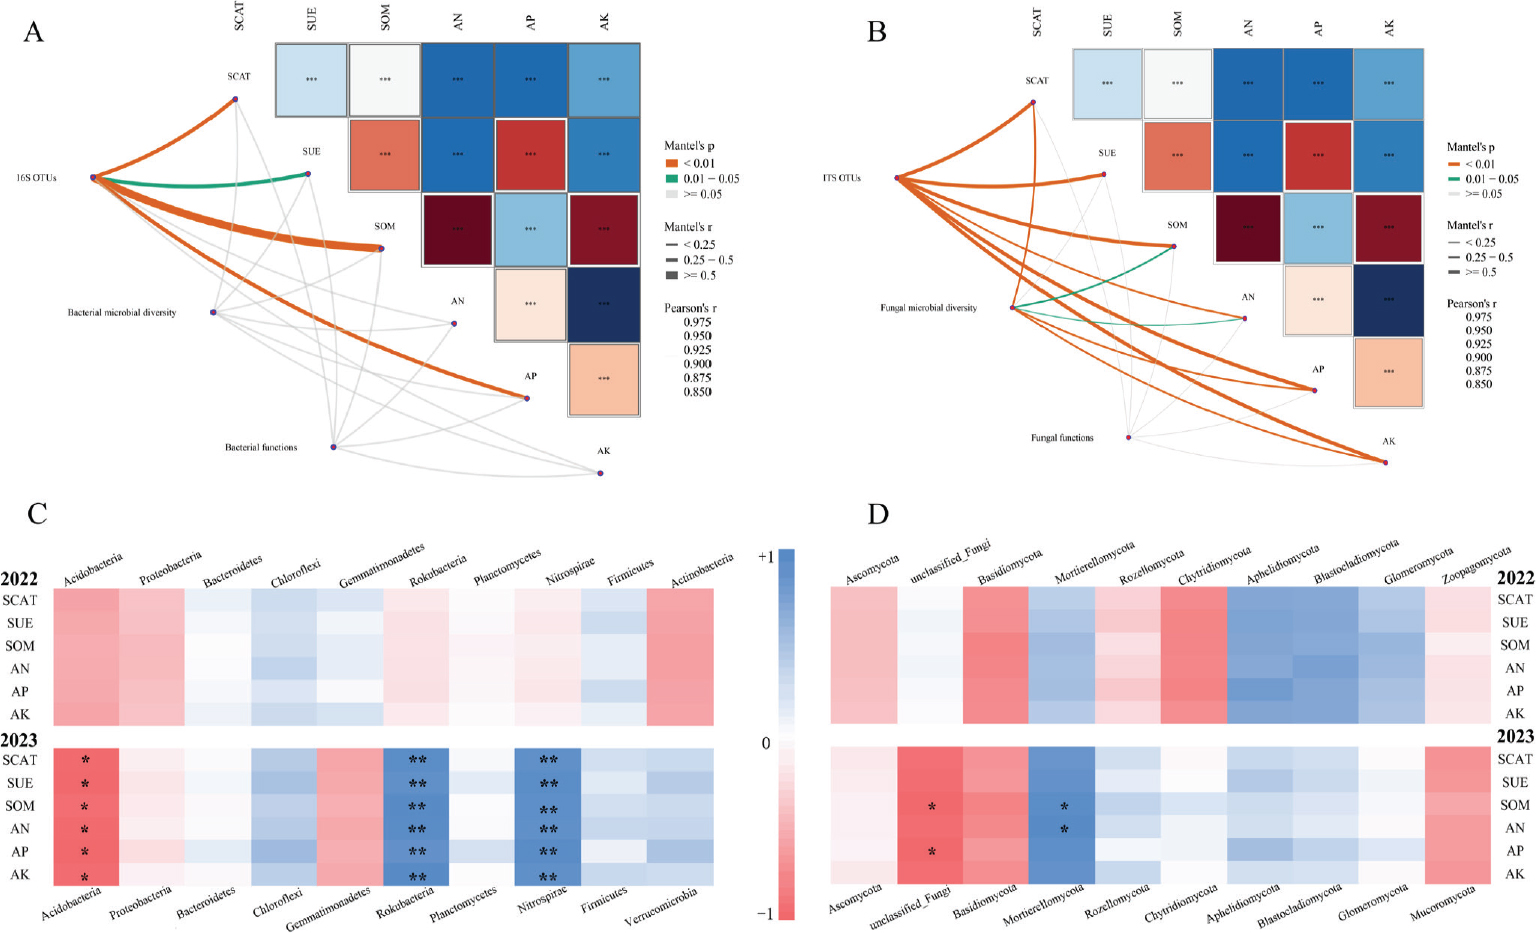
Figure 4.
Pearson correlation analysis and Mantel test between microorganisms and environmental factors. (A, C) bacteria and the chemical properties of soil; (B, D) fungi and the chemical properties of soil. AK, available potassium; AN, available nitrogen; AP, available phosphorus; SCAT, soil catalase; SOM, soil organic matter; SUE, soil urease.
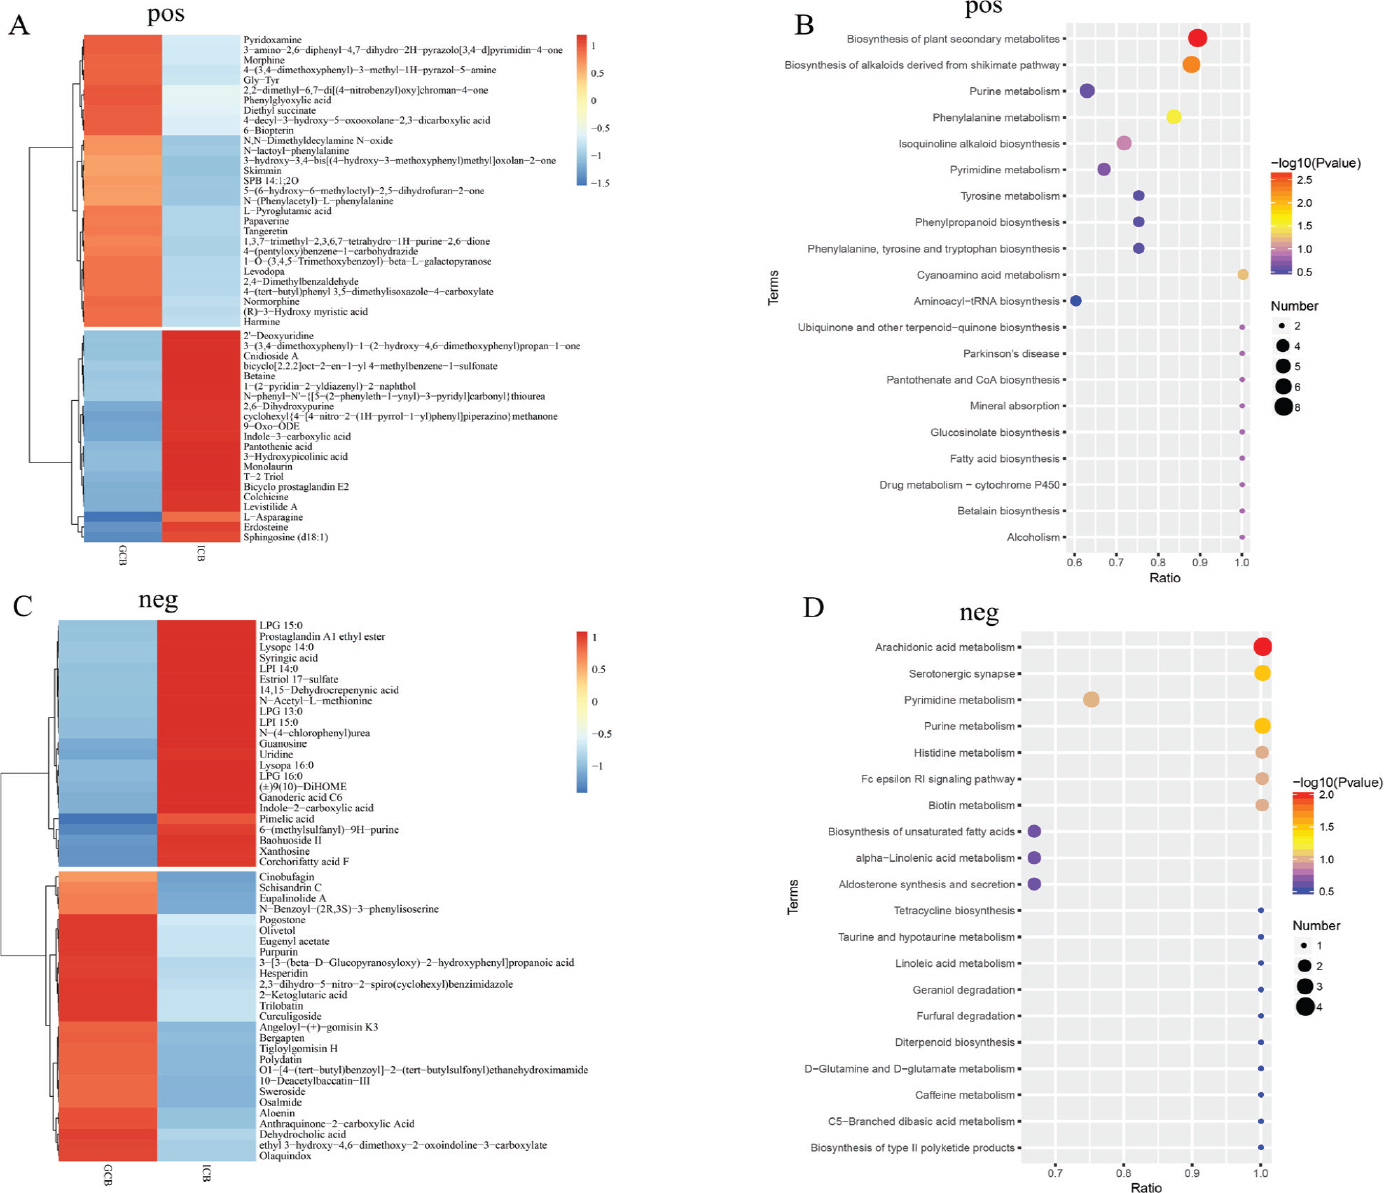
Figure 5.
Metabolite and KEGG pathway enrichment analysis. (A) soil metabolite analysis in the pos; (B) metabolic pathways in the pos; (C) soil metabolite analysis in the neg; (D) metabolic pathways in the neg. GCB, ground-cloth covering in 2023; ICB, Indian-strawberry covering in 2023; NEG, negative mode; POS, positive mode.
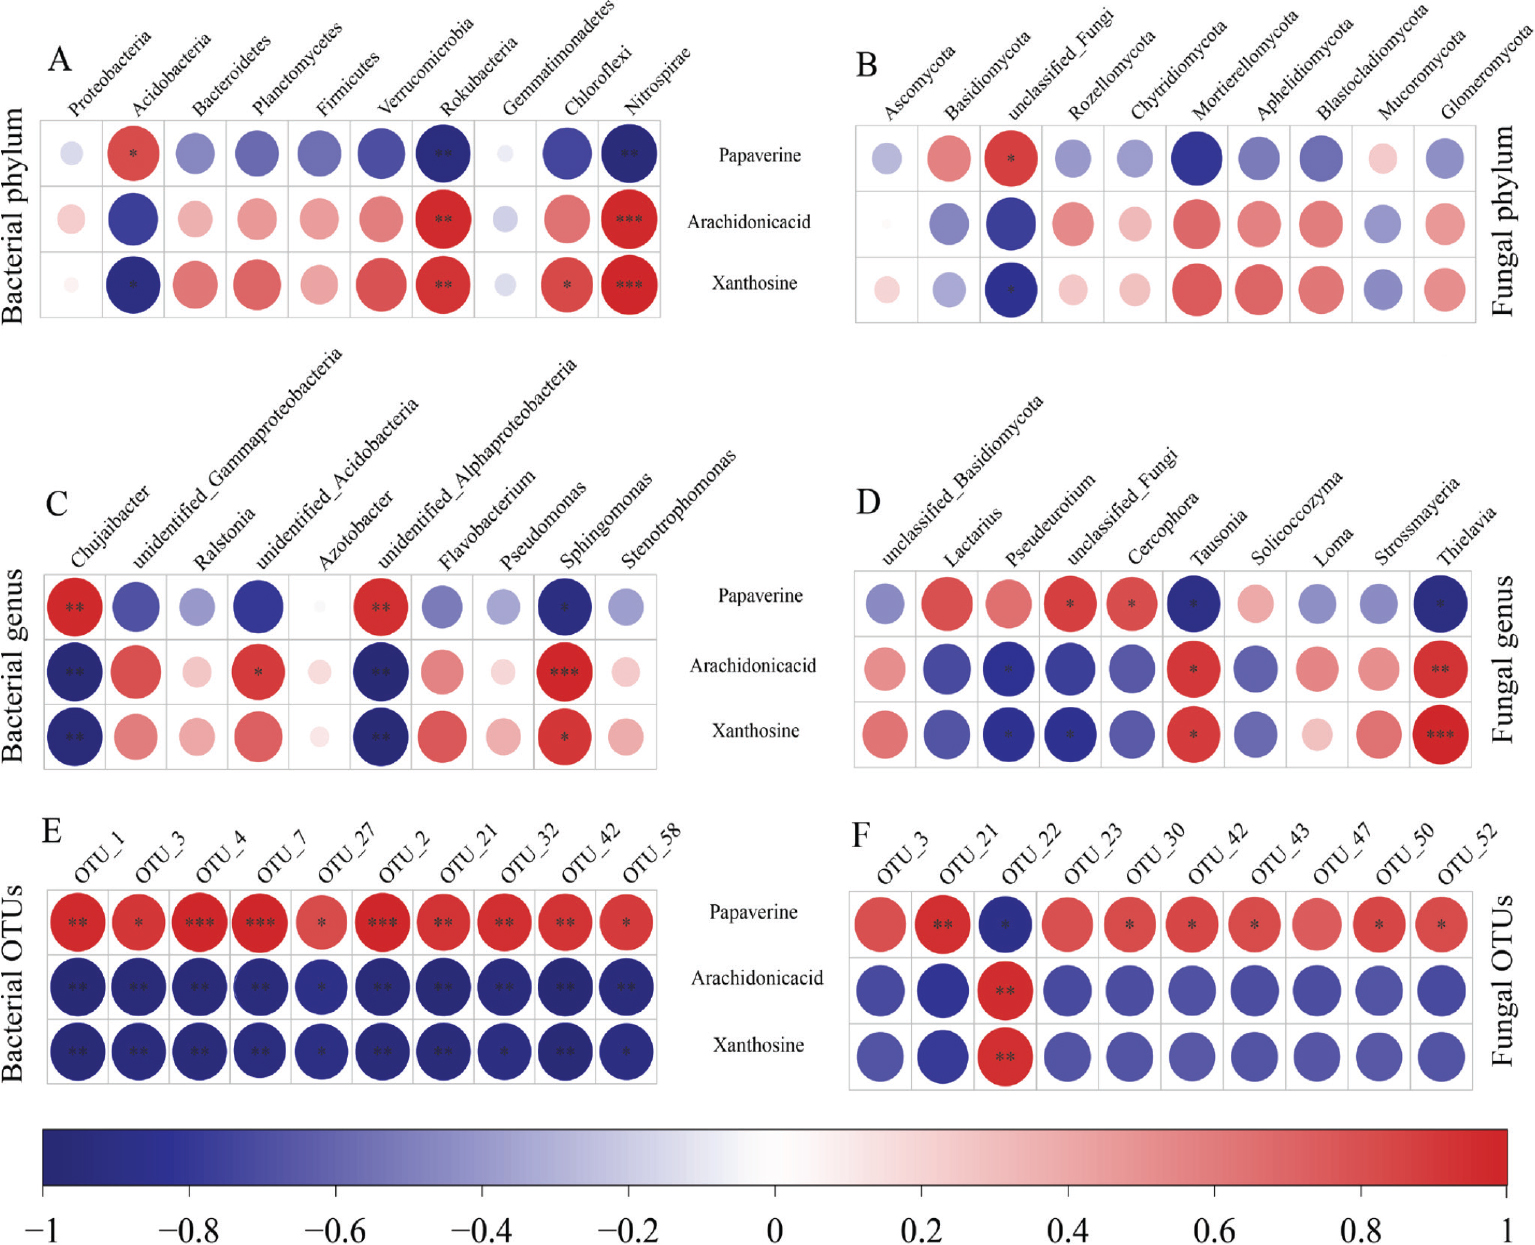
Figure 6.
The correlation between microorganisms and metabolites. (A, C, E) correlation of important metabolites with bacterial phyla, genera, and OTUs; (B, D, F) correlation of important metabolites with fungal phyla, genera, and OTUs. OTUs, operational taxonomic units.
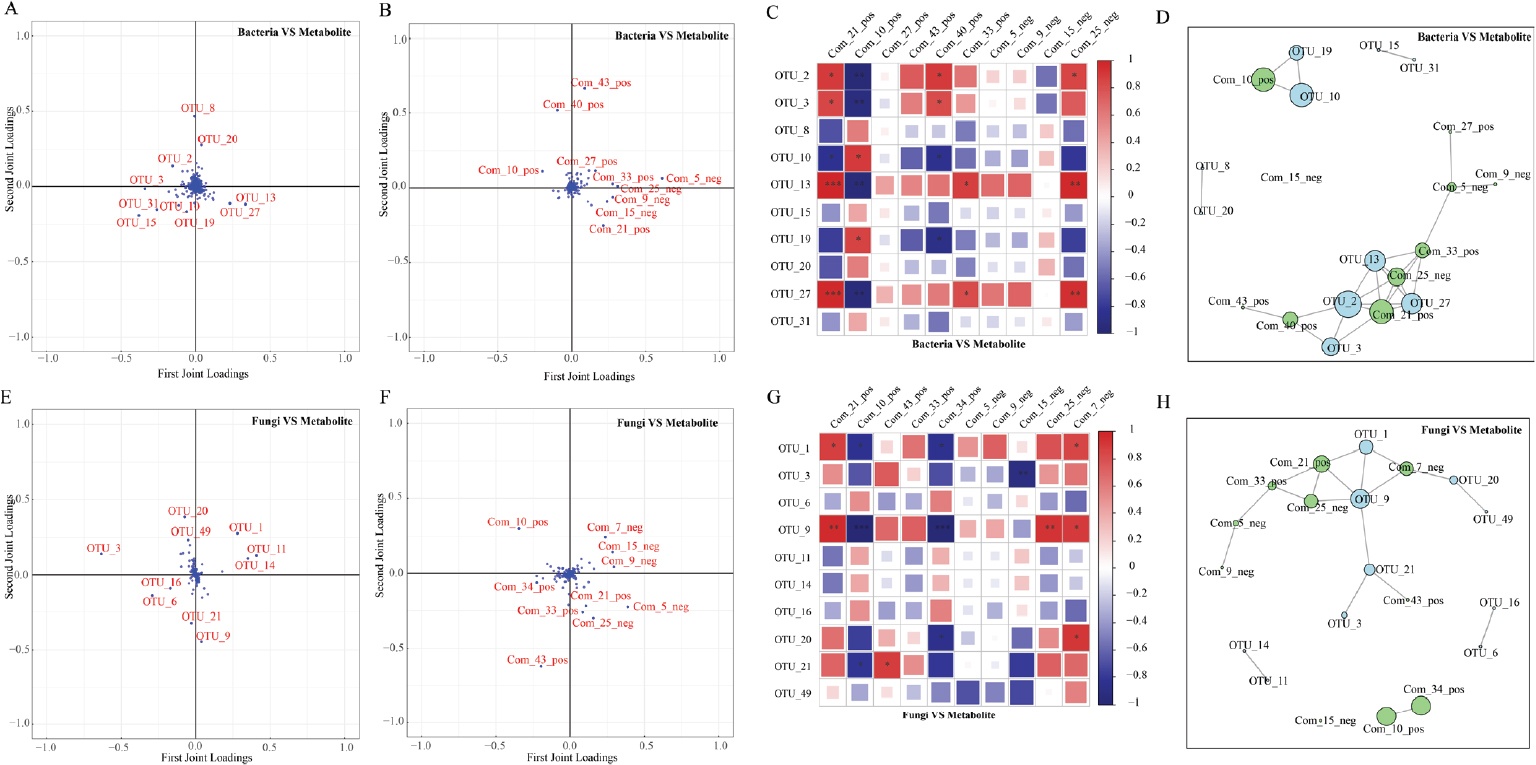
Figure 7.
O2PLS analysis. (A, B) bacterial O2PLS load chart; (E, F): fungal O2PLS load chart; (C, G) bacteria and fungi heatmaps; (D) bacterial-metabolite association diagram; (H) fungal-metabolite association diagram. NEG, negative mode; OTUs, operational taxonomic units; POS, positive mode.
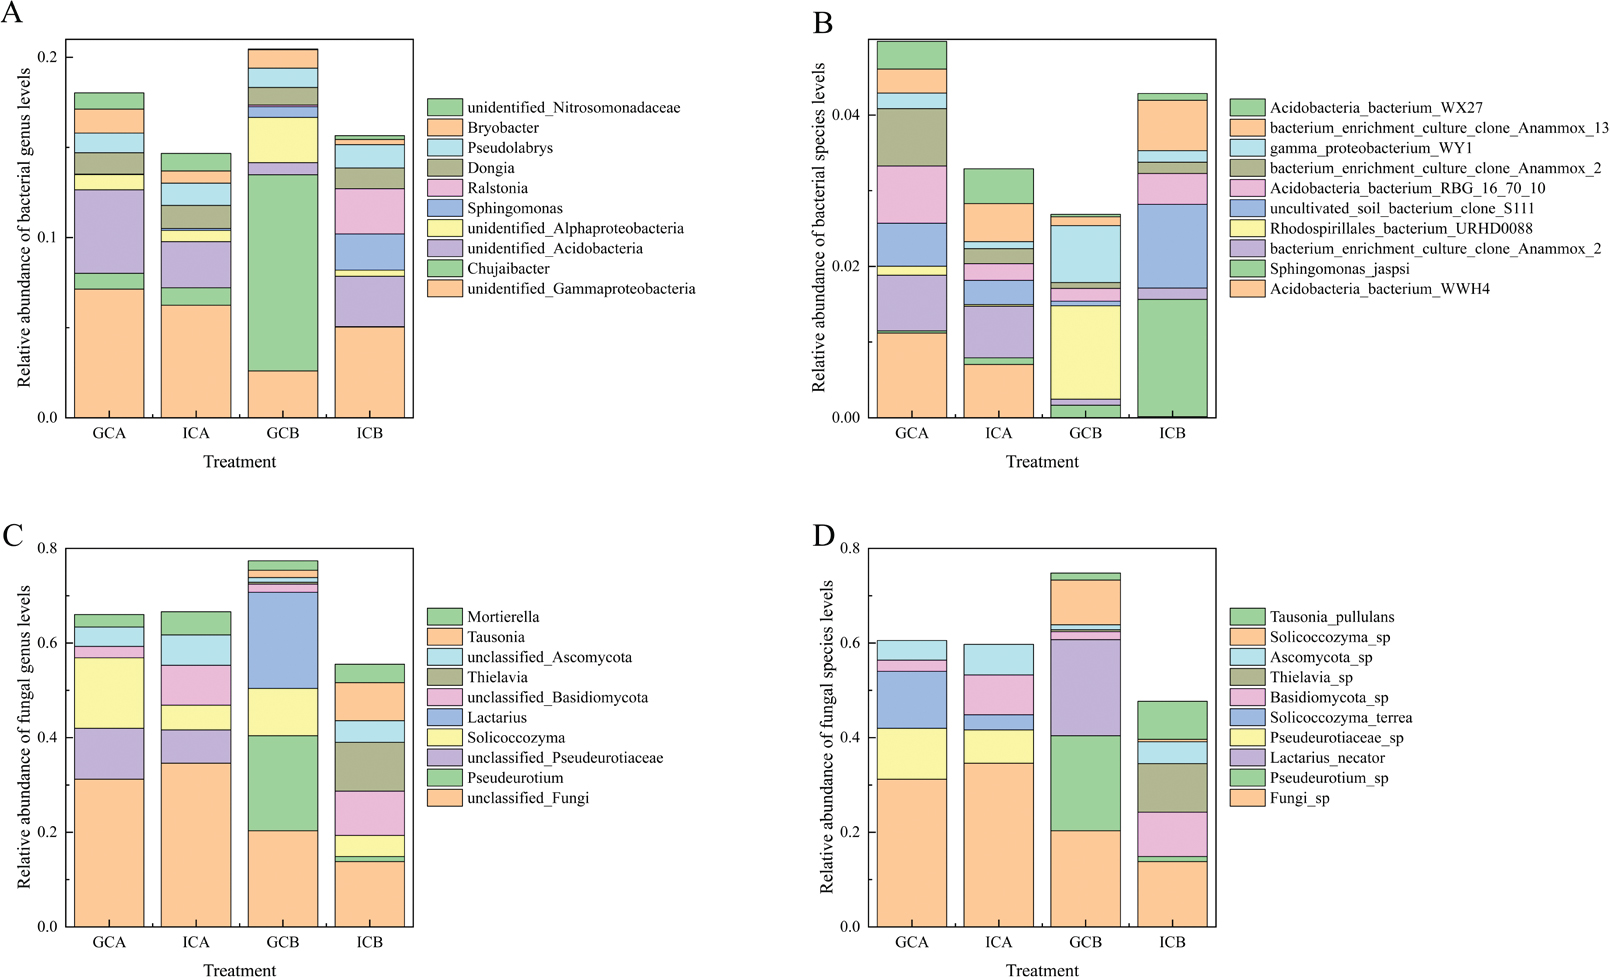
Supplementary Figure 1.
Dominant soil microorganism species. (A, B) bacterial genus and species; (C, D) fungal genus and species; GCA, ground-cloth covering in 2022; GCB, ground-cloth covering in 2023; ICA, Indian-strawberry covering in 2022; ICB, Indian-strawberry covering in 2023.
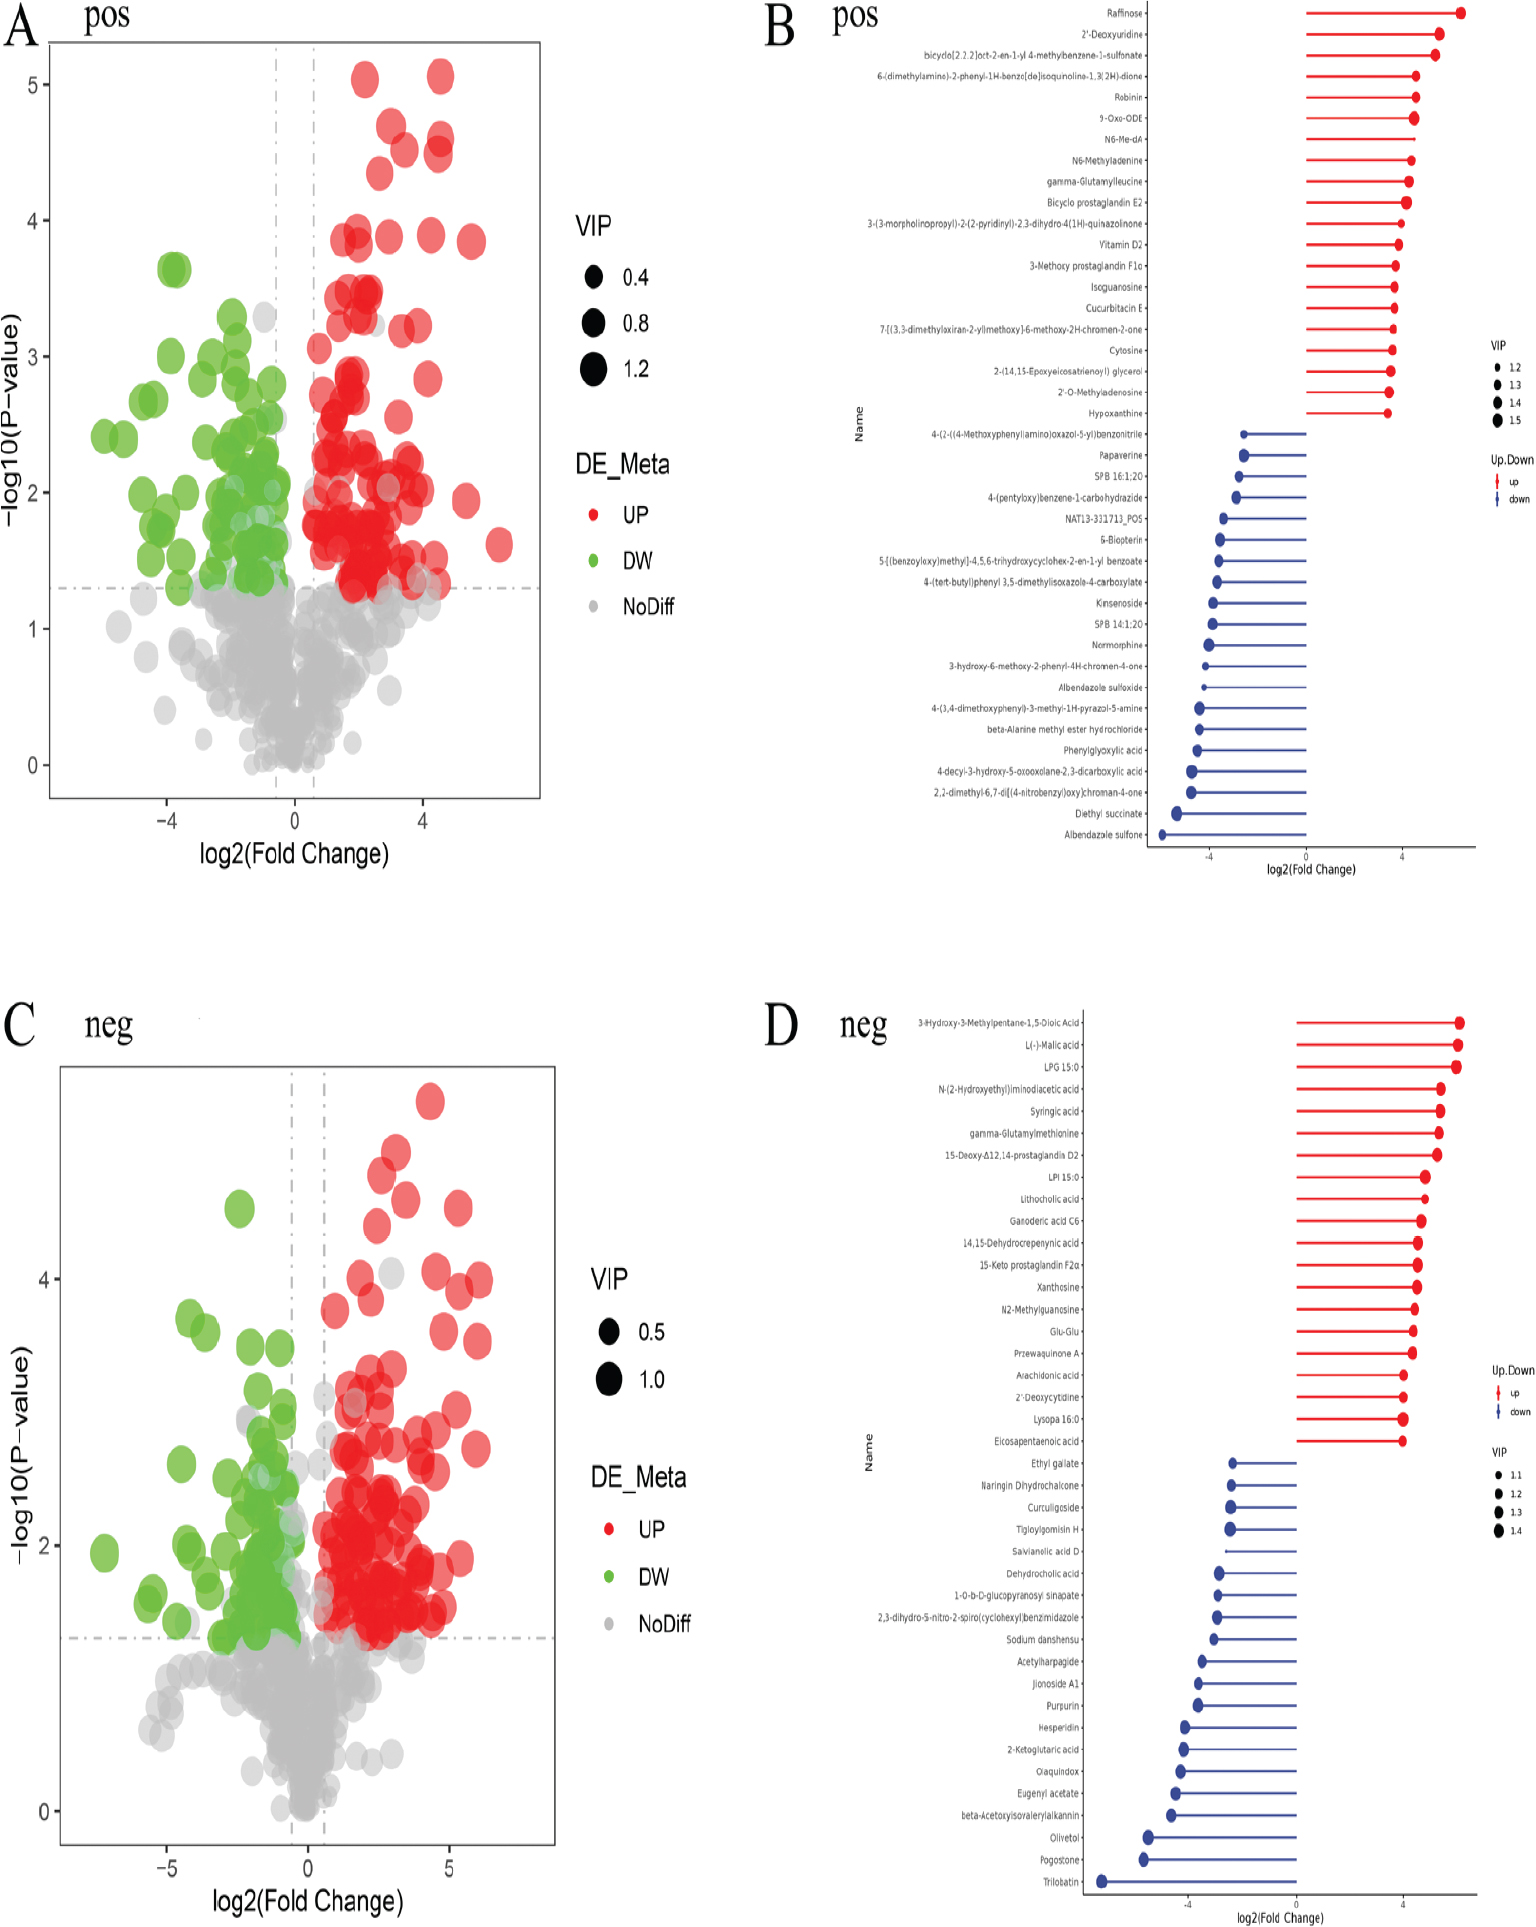
Supplementary Figure 2.
Differences in soil metabolites. (A, B) soil metabolite analysis in the pos; (C, D) soil metabolite analysis in the neg. NEG, negative mode; POS, positive mode.