
INTRODUCTION
Currently, most orchards initially adopt ground cloth covering (GC) for weed suppression and soil moisture conservation. However, after several years, the degraded fabric loses efficacy, necessitating replacement, a process that is labour-intensive, costly, and prone to environmental pollution. Consequently, many pear orchards are gradually shifting towards living grass covering as an alternative.
Living grass covering enhances soil moisture content and organic matter, improves soil structure, boosts leaf photosynthetic efficiency, and elevates fruit quality (Liu, 2023; Wang, 2023a, 2023b; Yang et al., 2023). Soil nutrient improvement is more pronounced in shallower soil layers and with longer mulching durations, typically showing significant increases after 3–5 years (Zhang et al., 2021). Different cover species exert distinct effects: in apple orchards, rapeseed outperforms white clover and ryegrass in elevating soil organic matter (SOM), available nitrogen (AN), and available potassium (AK), whereas white clover exhibits superior weed suppression (Feng et al., 2023; Wu et al., 2023). Hairy vetch demonstrates strong carbon sequestration capacity; alfalfa most effectively enhances SOM, total nitrogen, and available phosphorus (AP); ryegrass preferentially promotes microbial diversity (Zhang, 2023; Li et al., 2024). In vineyards, purslane extends photosynthetic duration and increases soluble solids and vitamin C content (Hu et al., 2023). Additionally, orchard sod culture promotes organic phosphorus mineralisation, elevates plant available (AP) phosphorous, mitigates surface runoff-induced nitrogen and phosphorus loss and soil erosion, conserves soil nutrients and moisture, and alleviates heavy metal toxicity (Chen et al., 2023; Cheng et al., 2023; Cui, 2023).
Sod culture also modulates rhizosphere symbiosis and microbial populations, regulates soil N: nitrogen; P: phosphorus; K: potassium (NPK) content and enzyme activities, and ameliorates microbial conditions to some extent (Semenov et al., 2021; Hou, 2023; Wang, 2023a, 2023b). For instance, hairy vetch cover increases the relative abundance of beneficial microbes such as Sphingomonadaceae and Trichoderma (Jiang et al., 2023). In semi-arid apple orchards, white clover cover enriches microbial genes associated with amino acid metabolism, carbon cycling, and nitrogen metabolism (Wang et al., 2022b). While sod culture diversifies soil metabolites, not all induced metabolites are beneficial. Certain root exudates include recalcitrant autotoxic compounds that may inhibit plant growth (Guan et al., 2023; Zhang, 2023; Zhao et al., 2024).
In summary, living grass covering research holds significant value for replacing ground fabric, reducing costs, enhancing efficiency, protecting the environment, and improving orchard soil quality. However, currently recommended cover species often suffer from weak weed suppression, annual reseeding requirements, short growth cycles, and great mowing difficulty within rows of trees. Preliminary studies by our research group identified Indian strawberry (Duchesnea indica) as a promising candidate: its low stature, perennial growth habit, no need for reseeding, and strong weed suppression enable reduced mowing frequency within rows and extended intervals between rows, lowering labour input. Concurrently, microclimate and soil nutrient conditions around trees show improvement (Ji et al., 2024). Nevertheless, metabolites released under sod culture are not universally beneficial, and research on the impacts of cover species on soil microecology remains limited.
Therefore, to further investigate soil improvements under Indian-strawberry covering (IC), microbial and metabolomic analyses were conducted on soils under IC established in 2020, and the underlying mechanisms were examined from a soil microecology perspective.
MATERIALS AND METHODS
Experimental design and soil collection
The experiment was conducted at the Kongzhuang Base of the Changli Fruit Research Institute, Hebei Academy of Agricultural and Forestry Sciences, located in Changli County, Qinhuangdao City, Hebei Province, China. The planting density was 4 m × 1 m, with 80 trees per row. The cultivated pear cultivar was Pyrus bretschneideri R. 'Huangguan'. The site is situated at 39°42′29″ N, 119°05′41″ E, on clay-textured soil. Within two adjacent pear tree rows, GC and (D. indica) IC were applied separately. Soil sampling (for soil property and microbial analyses) was performed on 11 August 2022, under both GC and IC treatments. A second sampling (for soil properties, microbiome, and metabolome analyses) was conducted on 9 August 2023. Given that 88.3% of pear root systems are concentrated within the 0–50 cm soil layer, samples were collected from this depth. Sampling followed an ‘S’-shaped pattern within the tree row (Figure 1). For each treatment, nine subsampling points were collected; every three points were pooled to form one composite sample, resulting in three biological replicates per treatment. Each composite sample was divided into two aliquots: one for soil physicochemical property analysis, and the other for soil microbiome and metabolome profiling. Microbiome and metabolome analyses were outsourced to Novogene (Beijing, China).
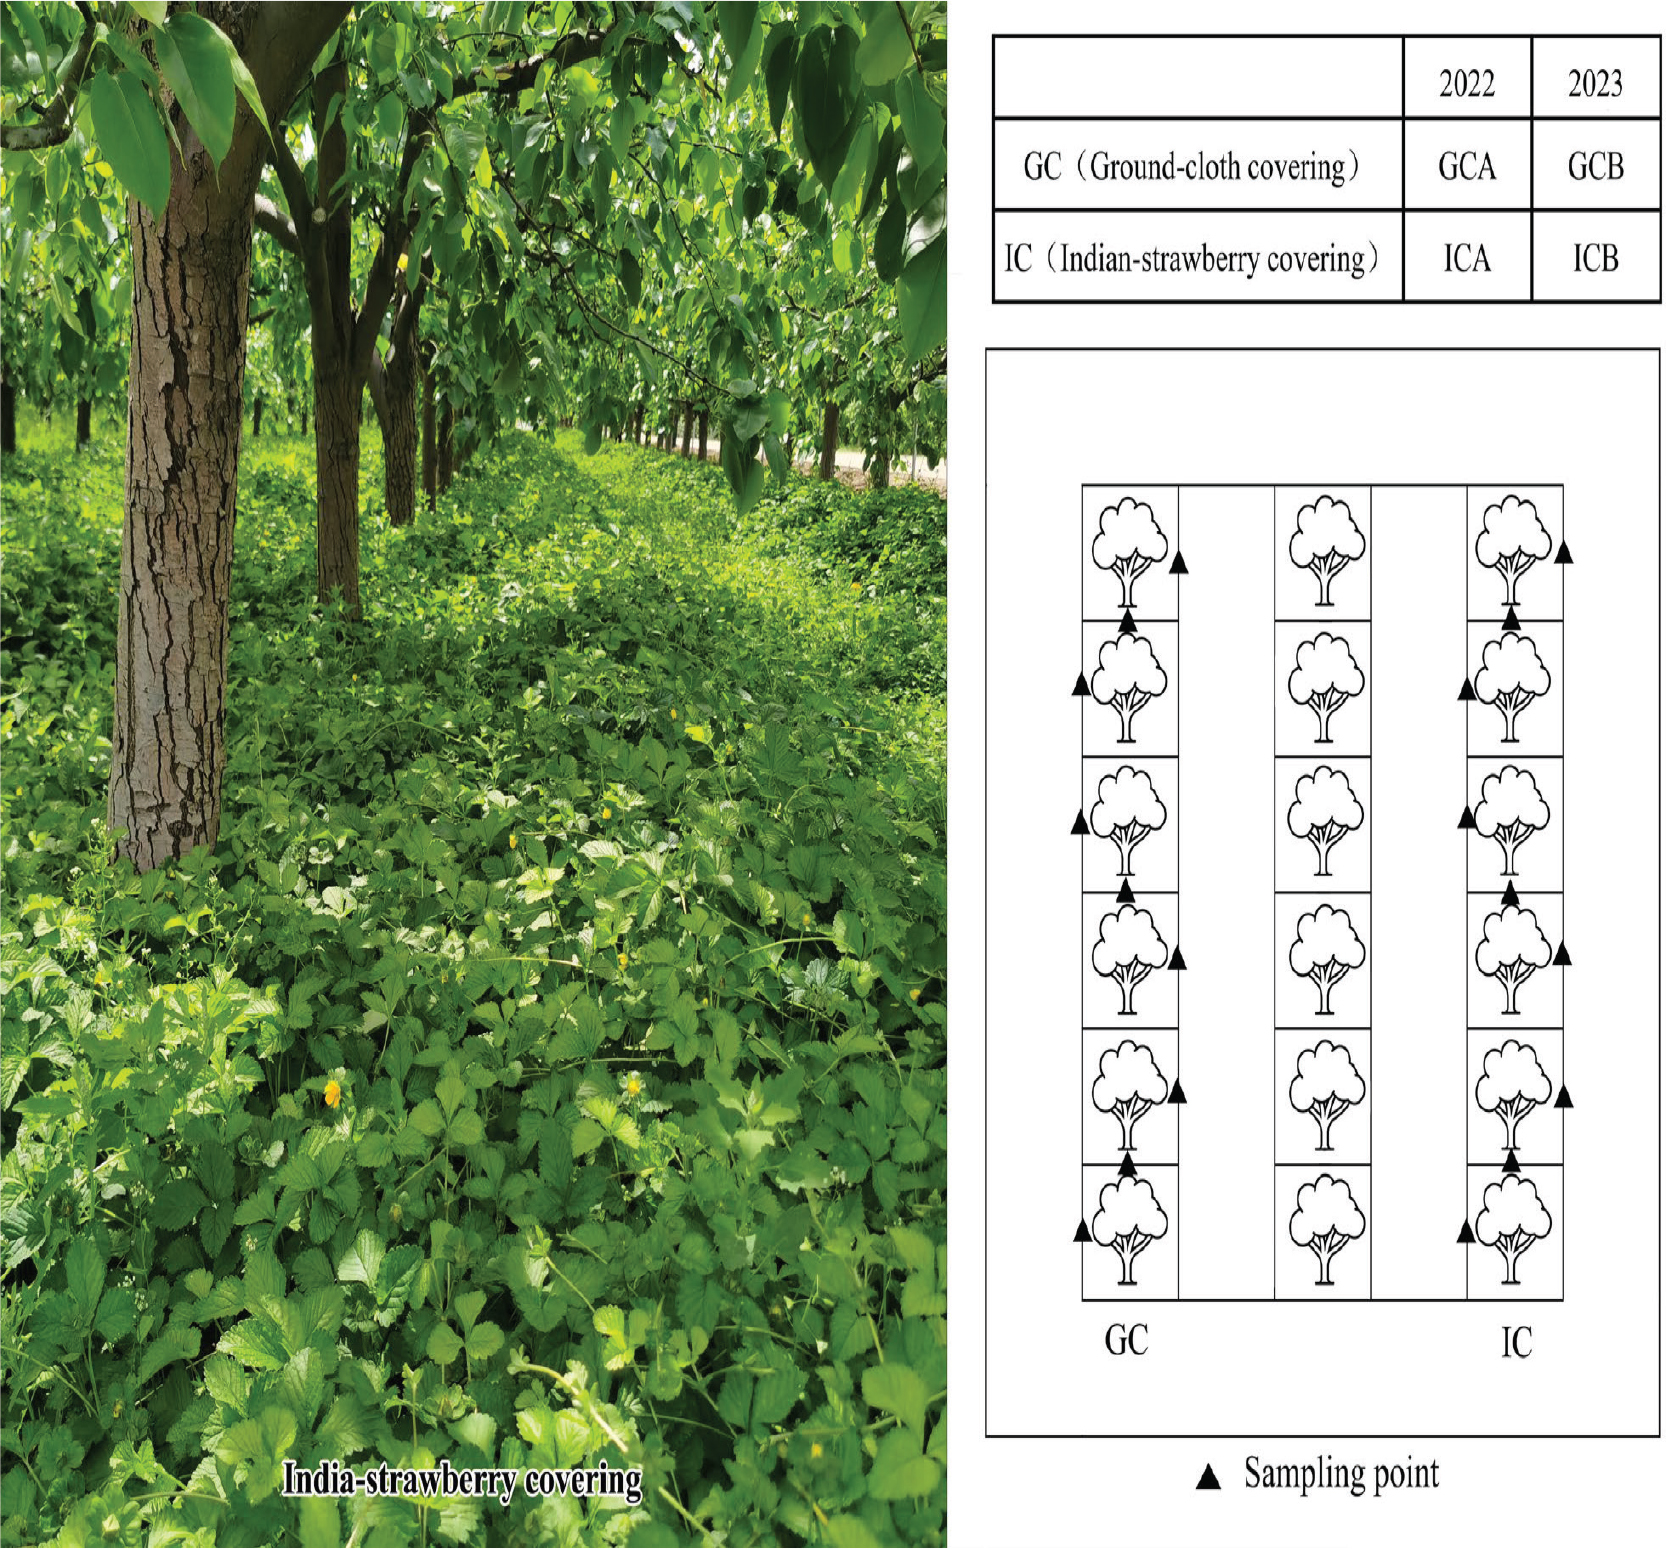
Figure 1.
Experimental design. GC, ground-cloth covering; GCA, ground-cloth covering in 2022; GCB, ground-cloth covering in 2023; IC, Indian-strawberry covering; ICA, Indian-strawberry covering in 2022; ICB, Indian-strawberry covering in 2023.
Soil chemical property determination
Soil urease activity was determined by the ammonium (NH4+) release method: An appropriate amount of air-dried soil was weighed into a centrifuge tube, treated with 1 mL toluene, and allowed to stand for 15 min. Subsequently, 10% urea solution and citrate buffer (pH 6.7) were added sequentially. The mixture was incubated at 37°C for 24 hr. After incubation, the suspension was diluted, shaken thoroughly, centrifuged, and the supernatant was collected and diluted to volume. Phenol solution and sodium hypochlorite solution were then added sequentially, mixed thoroughly, allowed to stand for 20 min, and finally diluted to the mark for colorimetric determination.
Soil catalase activity was measured by potassium permanganate titration: Approximately 2 g of air-dried soil was weighed, followed by the addition of 40 mL of distilled water and 5 mL of 0.3% H2O2 solution. The flask was sealed, shaken at room temperature for 20 min, and immediately treated with 5 mL of 3 mol · L−1 H2SO4 to stabilise residual H2O2. The mixture was filtered, and 25 mL of filtrate was titrated with 0.1 mol · L−1 standard KMnO4 solution for calculation.
SOM content was determined by the external heating dichromate oxidation method: Under heating conditions, soil organic carbon was oxidised using an excess 0.4 mol · L−1 K2Cr2O7–H2SO4 solution. The residual dichromate was titrated with 0.1 mol · L−1 standard FeSO4 solution. Organic carbon content was calculated based on dichromate consumed and an oxidation correction factor, then multiplied by 1.724 to obtain organic matter content.
AN was measured by the alkaline hydrolysis-diffusion method: Soil was hydrolysed with 1.0 mol · L−1 NaOH in a diffusion dish to convert readily hydrolysable nitrogen (potential AN) into NH3. The released NH3 diffused and was absorbed by H3BO3 solution, which was then titrated with standard acid to calculate AN content.
AP was determined by the molybdenum-antimony-ascorbic acid colorimetric method: Soil was extracted with 0.5 mol · L−1 solution. An aliquot of extract was transferred to a 25 mL volumetric flask, adjusted to 10 mL with extractant, followed by slow addition of 5 mL molybdenum-antimony-ascorbic acid chromogenic reagent. After dilution to volume, thorough mixing, and incubation at ≥20°C (25°C) for 30 min, absorbance was measured colorimetrically to calculate AP.
AK was quantified by ammonium acetate extraction: 2.5 g of air-dried soil (sieved through 1 mm) was weighed into a 100 mL Erlenmeyer flask, mixed with 25 mL of 1 mol · L−1 ammonium acetate solution, sealed with parafilm, and shaken at 150–180 r · min−1 for 30 min at 20–25°C. After dry filtration, the filtrate was directly analysed using a flame photometer.
Soil microbial analysis
Deoxyribonucleic acid (DNA) was extracted from soil samples (2-year: 2022, 2023) using the cetyltrimethylammonium bromide (CTAB) method, followed by amplification of full-length amplicons targeting the bacterial 16 S Ribosomal Ribonucleic Acid (rRNA) gene and fungal internal transcribed spacer (ITS) region. Single Molecule Real-Time (SMRT) Bell libraries were constructed and sequenced on the PacBio platform. The bacterial 16 S rRNA primers were 27F (5’-AGRGTTTGATYNTGGCTCAG-3’) and 1492R (5′-TASGGHTACCTTGTTASGACTT-3′); the fungal ITS rRNA primers were ITS1F (5′-CTTGGTCATTTAGAGGAAGTAA-3′) and ITS4R (5′-TCCTCCGCTTATTGATATGC-3′) (Liuetal., 2024b). Raw sequencing data were processed using PacBio’s SMRT Analysis software to generate Binary Alignment/Map (BAM) files. Samples were demultiplexed based on barcodes, followed by operational taxonomic units (OTUs) clustering and taxonomic classification. Based on the OTU clustering results, taxonomic annotation is performed on the representative sequence of each OTU to obtain corresponding species information and species-based abundance profiles. Concurrently, analyses including OTU abundance profiling and alpha diversity calculation conducted to assess within-sample species richness and evenness, as well as shared and unique OTUs across different samples or groups. On the other hand, multiple sequence alignment of OTUs is performed to construct a phylogenetic tree, enabling further evaluation of community structure differences among samples and groups. These differences are visualised using dimensionality reduction plots such as Principal Coordinates Analysis (PCoA) along with sample clustering dendrograms.
Soil metabolome analysis
Soil samples in this experiment were subjected to non-targeted metabolomics research based on liquid chromatography-mass spectrometry (LC-MS) technology (soil samples collected in 2023). Metabolites were extracted from the samples in sequence and detected by LC-MS/MS. Ultra-High Performance Liquid Chromatography (UHPLC)-MS/MS analyses were performed using a Vanquish UHPLC system (ThermoFisher, Germany) coupled with an Orbitrap Q ExactiveTM HF mass spectrometer or Orbitrap Q ExactiveTM HF-X mass spectrometer (Thermo Fisher, Germany) in Novogene Co., Ltd. (Beijing, China). Samples were injected onto a Hypersil Goldcolumn (100 × 2.1 mm, 1.9 μm) using a 12-min linear gradient at a flow rate of 0.2 mL · min−1. The eluents for the positive polarity mode were eluent A (0.1% formic acid [FA) in Water) and eluent B (Methanol). The eluents for the negative polarity mode were eluent A (5 mM ammonium acetate, pH 9.0) and eluent B (Methanol). The solvent gradient was set as follows: 2% B, 1.5 min; 2%–85% B, 3 min; 85%–100% B, 10 min; 100%– 2% B, 10.1 min; 2% B, 12 min. Q ExactiveTM HF mass spectrometer was operated in positive/negative polarity mode with spray voltage of 3.5 kV, capillary temperature of 320°C, sheath gas flow rate of 35 psi, and aux gas flow rate of 10 L · min−1 · S-lens RF level of 60, Aux gas heater temperature of 350°C. Subsequently, downstream analysis was performed. First, the raw files (.raw) obtained from MS detection are imported into Compound Discoverer 3.3 (hereinafter referred to as CD3.3) software for spectral processing and database searching to acquire qualitative and quantitative results of metabolites. Next, multivariate statistical analyses of the metabolites are conducted to reveal metabolic pattern differences among different groups. Hierarchical clustering analysis and metabolite correlation analysis are further applied to elucidate relationships among samples as well as between metabolites. Differential metabolites were screened according to the criteria of VIP >1.0, fold change (FC) >1.5 or FC <0.667, p-value <0.05. Subsequently, differential analysis and Kyoto Encyclopedia of Genes and Genomes (KEGG) enrichment analysis were conducted to interpret the changes in soil metabolites. KEGG pathways with a p-value <0.05 were defined as significantly enriched KEGG pathways among the differential metabolites. The primary biological functions associated with the differential metabolites were identified through KEGG pathway enrichment analysis.
Statistical analysis
The soil physicochemical properties were analysed using SPSS 20.0 (one-way analysis of variance: tukey’s honestly significant difference), while the soil microbial data were processed through the Novogene Cloud Platform (https://magic.novogene.com/customer/main#/loginNew). The correlation between soil physicochemical properties and microbial communities was evaluated using SPSS 20.0. The volcano plot of differentially abundant OTUs was generated using R language with the DESeq2 package (FC >2 or <−2, Padj <0.05). The difference in soil physicochemical properties between the 2 years was quantified using the formula: difference = [(Indian-strawberry covering in 2023 [ICB]—ground-cloth covering in 2023[GCB])/GCB—(Indian-strawberry covering in 2022 [ICA]— ground-cloth covering in 2022[GCA])/GCA] (Subtract the percentage increase in soil nutrients in 2022 from the percentage increase in soil nutrients following IC in 2023.). PCoA based on Bray–Curtis distance was performed and visualised using R software. Bacterial functions were predicted using Tax4Fun2, while fungal functions were predicted using FUNGuild.
RESULTS
Effect of IC on soil physicochemical properties
As shown in the figure, 2 years of IC significantly enhanced the soil physical and chemical properties (p < 0.05). Specifically, compared to 2022, the soil properties under IC in 2023 showed further improvements in several indicators (soil urease[SUE]: +25.87%; SOM: +128.82%; AP: +56.53%; AK: +28.54%), with particularly notable increases in SOM and AP (Figure 2). In contrast, IC led to significant year-on-year improvements in soil properties, enhancing nutrient accumulation and making it more conducive to the growth of fruit trees.
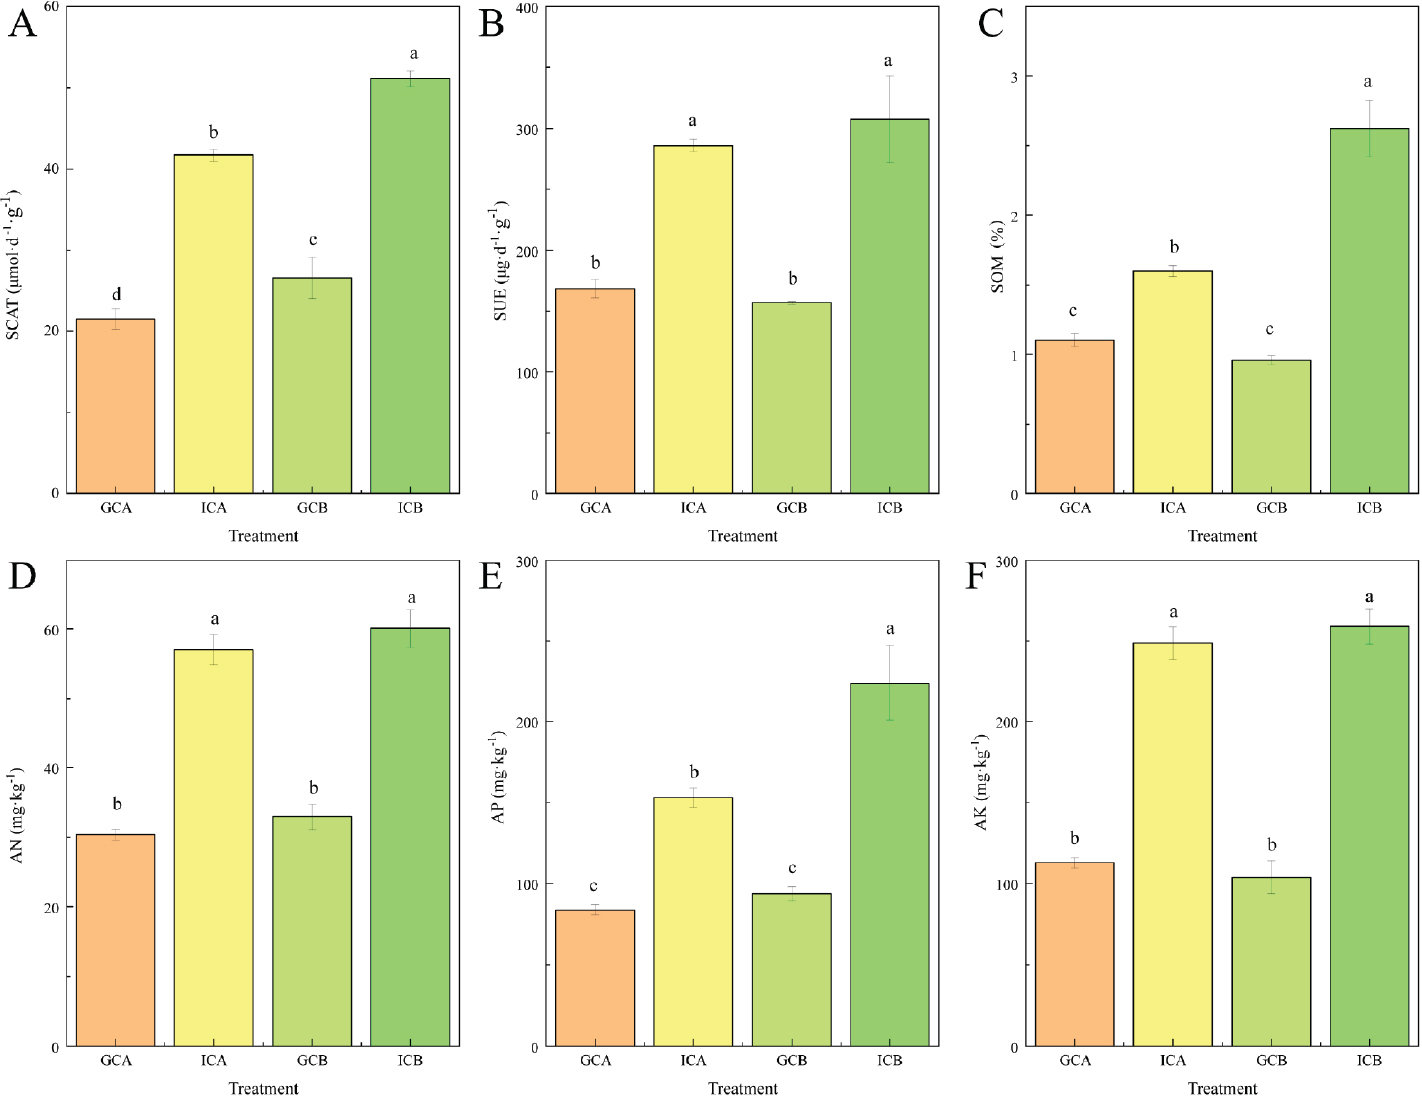
Figure 2.
Soil physical and chemical properties. (A) soil catalase activity; (B) soil urease activity; (C) soil organic matter content; (D) soil available nitrogen content; (E) soil available phosphorus content; (F) soil available potassium content. AK, available potassium; AN, available nitrogen; AP, available phosphorus; GCA, ground-cloth covering in 2022; GCB, ground-cloth covering in 2023; ICA, Indian-strawberry covering in 2022; ICB, Indian-strawberry covering in 2023; SCAT, soil catalase; SOM, soil organic matter; SUE, soil urease.
Analysis of changes in soil microbial community structure
The top 10 dominant taxa of bacteria and fungi at the phylum, genus, and species levels were visualised and analysed. Results showed that during both years of the experiment, bacterial communities at the phylum level were predominantly composed of Proteobacteria, Acidobacteria, and Bacteroidetes (Figure 3A). Following IC, Acidobacteria decreased to a certain extent, with reductions of 25.75% and 35.60% compared to the control in respective years. Conversely, Bacteroidetes demonstrated significant increases of +59.70% (2022) and +32.72% (2023). At the fungal phylum level, the community was primarily constituted by Ascomycota, Basidiomycota. Specifically, Ascomycota exhibited a slight decrease of 3.72% in 2022 but a substantial increase of 12.02% in 2023 (Figure 3B). Basidiomycota displayed varying degrees of reduction (–24.44%, –31.90%) in 2 years.
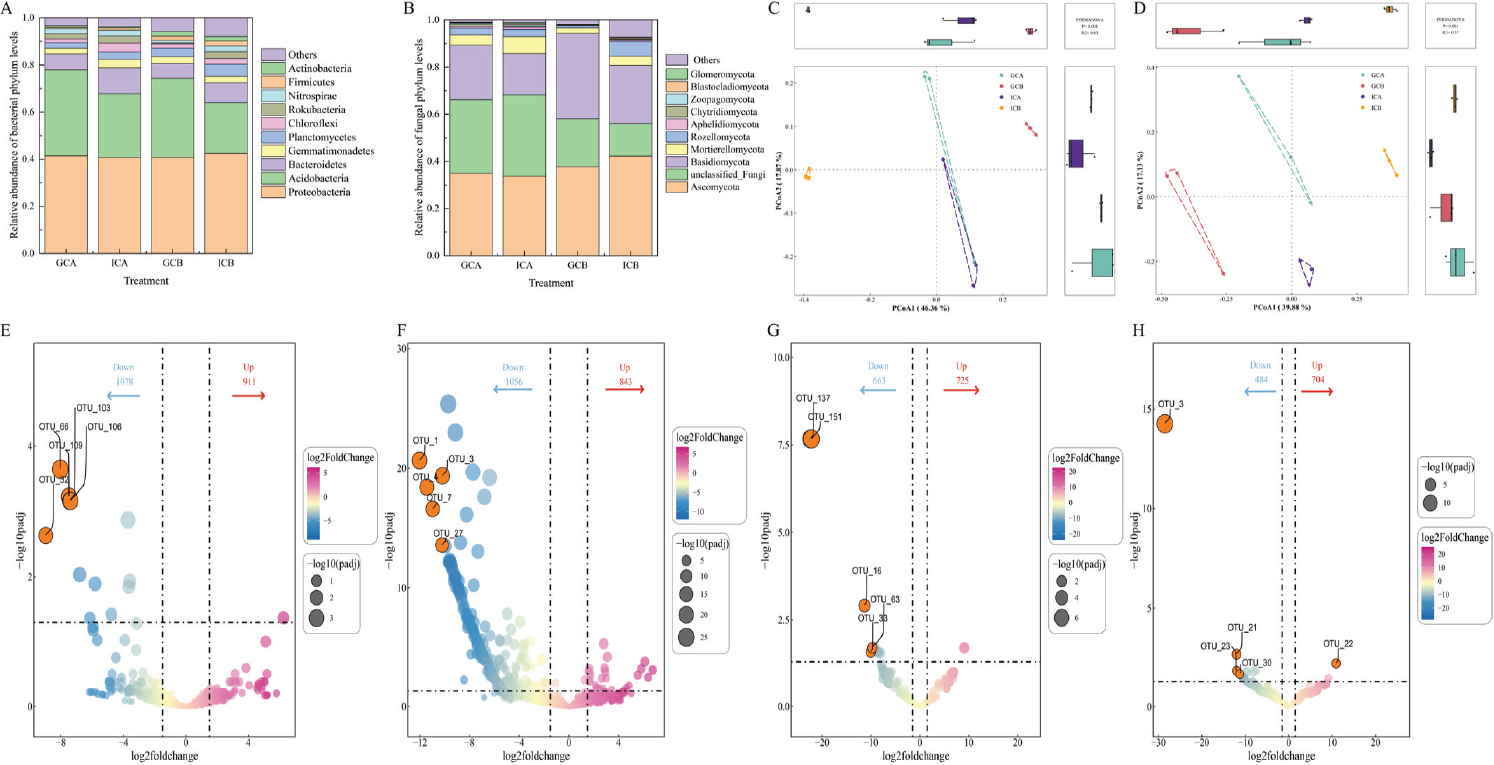
Figure 3.
Microbial community composition and structure. (A) bacterial phylum level; (B) fungal phylum level; (C) bacterial diversity of 2022 and 2023; (D) fungal diversity of 2022 and 2023; (E) 2022 bacteria OTU; (F) 2023 bacteria OTU; (G) 2022 fungi OTU; (H) 2023 fungi OTU. GCA, ground-cloth covering in 2022; GCB, ground-cloth covering in 2023; ICA, Indian-strawberry covering in 2022; ICB, Indian-strawberry covering in 2023; OTU, operational taxonomic unit.
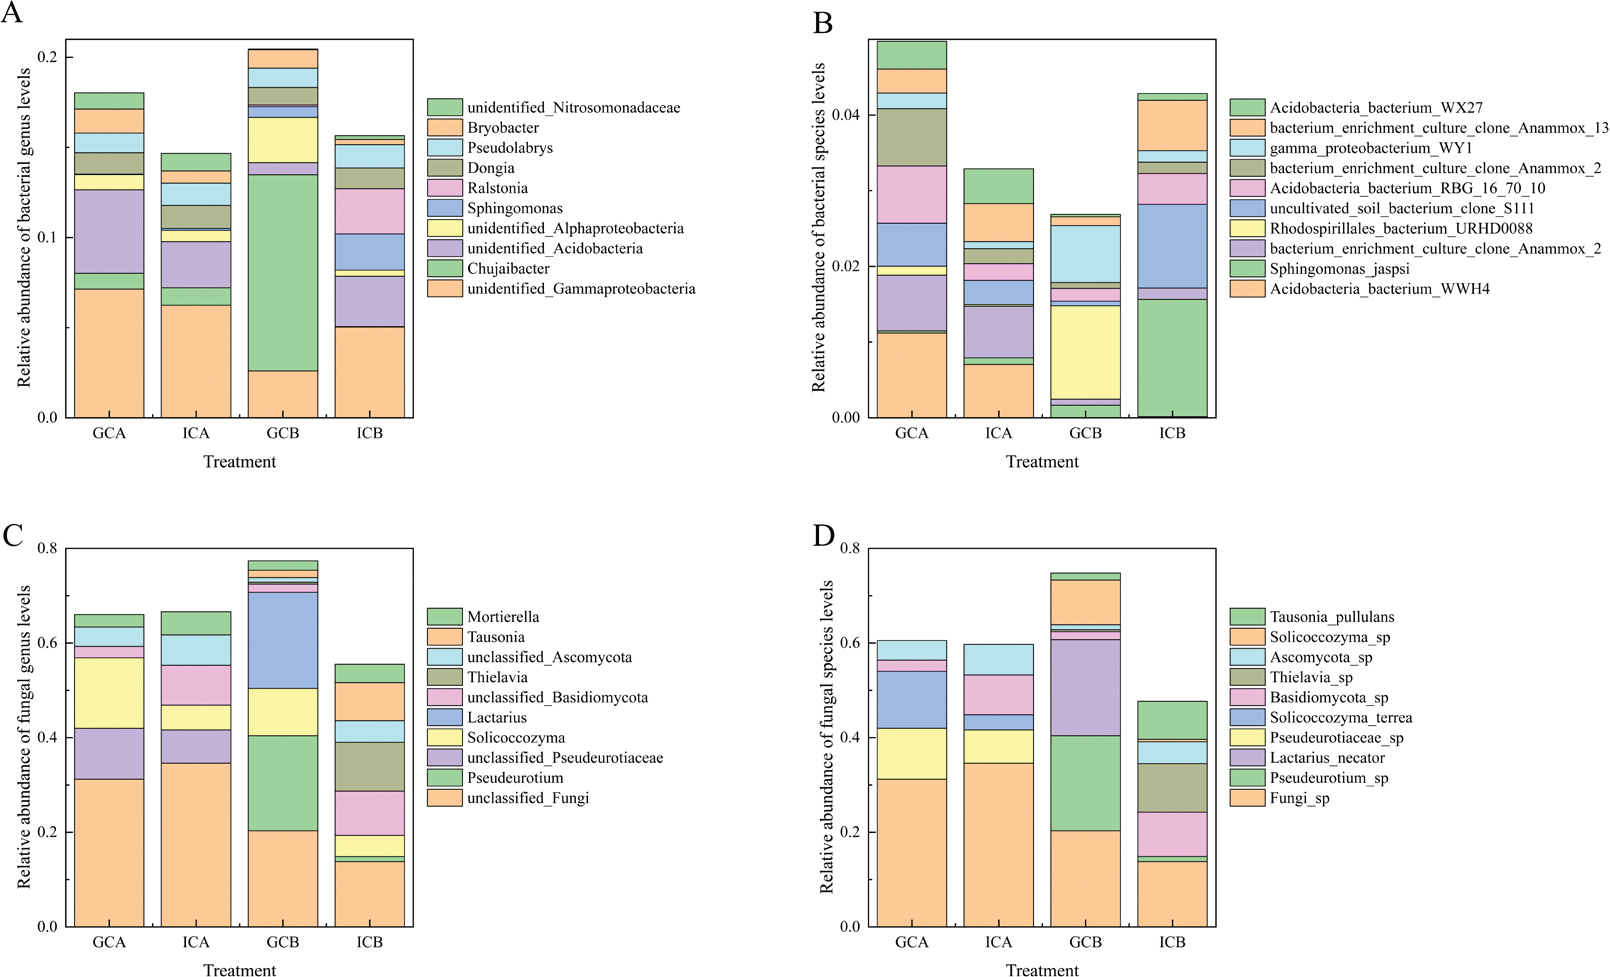
At the genus level, bacterial communities were primarily composed of unidentified Gammaproteobacteria, Chujaibacter (Supplementary Figure 1A). Although the effects of IC on bacterial genera varied slightly between the 2 years, Furthermore, the results indicate that the relative abundance of the more abundant Chujaibacter decreased from 10.88% to 0.02%, whereas the less abundant unidentified Gammaproteobacteria exhibited an increase from 2.61% to 5.04%. At the fungal genus level, the community was mainly composed of unclassified Fungi and Solicoccozyma (Supplementary Figure 1C). IC resulted in a significant reduction in the relative abundance of Solicoccozyma (–64.75% and –55.72% compared to the control over the 2 years) and a substantial increase in the relative abundance of unclassified Basidiomycota (increases of 254.98% and 447.11% compared to the control over the 2 years). The relative abundance of the top 10 bacterial species level was approximately 1%, primarily consisting of Acidobacteria bacterium WWH4 and bacterium enrichment culture clone Anammox 2 (Supplementary Figure 1B). Fungi were predominantly composed of Fungi sp. and Pseudeurotium sp., with their relative abundances ranging from 0.01% to 34.61% (Supplementary Figure 1D).
In bacterial microorganisms, the explanatory power of PCoA was 64.23%. Among them, the aggregation of GCA was less than that of Indian-strawberry covering in 2022 (ICA), and the aggregation of GCB was less than that of Indian-strawberry covering in 2023 (ICB) (Figure 3C). Moreover, the distance between GCB and ICB was much greater than that between GCA and ICA, suggesting that the differences in bacterial communities continued to increase after IC (Figure 3C). In fungal microorganisms, the explanatory power of PCoA was 57.01% (Figure 3D). Similar to bacteria, the aggregation of GCA was less than that of ICA, and the aggregation of GCB was less than that of ICB. The distance between GCB and ICB was also much greater than that between GCA and ICA. This indicates that the impact of IC on fungi was also significant.
Differential analysis of microbial OTUs demonstrated that in 2022, there were 911 upregulated and 1078 downregulated bacterial OTUs, of which 13 exhibited significant differences (1 upregulated and 12 downregulated) (Figure 3E). In 2023, the number of upregulated bacterial OTUs was 843, while the number of downregulated OTUs was 1056, with 352 showing significant differences (31 upregulated and 321 downregulated) (Figure 3F). Among the significant differences OTUs, six were consistently identified across both years: OTU 149, OTU 32, OTU 27, OTU 66, OTU 331, and OTU 69.
In 2022, a total of 725 fungal OTUs were up-regulated and 663 were down-regulated, with 11 exhibiting significant differences (two up-regulated and nine down-regulated) (Figure 3G). In 2023, the number of up-regulated fungal OTUs decreased slightly to 704, while the number of down-regulated OTUs also decreased to 484, with 18 showing statistically significant differences (2 up-regulated and 16 down-regulated) (Figure 3H). The changes in differentially expressed OTUs between the 2 years were relatively minor. The same OTUs existing in both years were: OTU 30 and OTU 62.
Correlation between microorganisms and environmental factors
As depicted in the figure, significant correlations were observed among soil physicochemical properties. Specifically, bacterial OTUs in the soil exhibited extremely strong correlations with SCAT, SOM, and AP, as well as a significant correlation with SUE (Figure 4A). In contrast, fungal OTUs showed strong correlations with all measured soil physicochemical properties (Figure 4B). The correlation strength between bacterial OTUs and soil physicochemical properties was weaker compared to that of fungal OTUs.
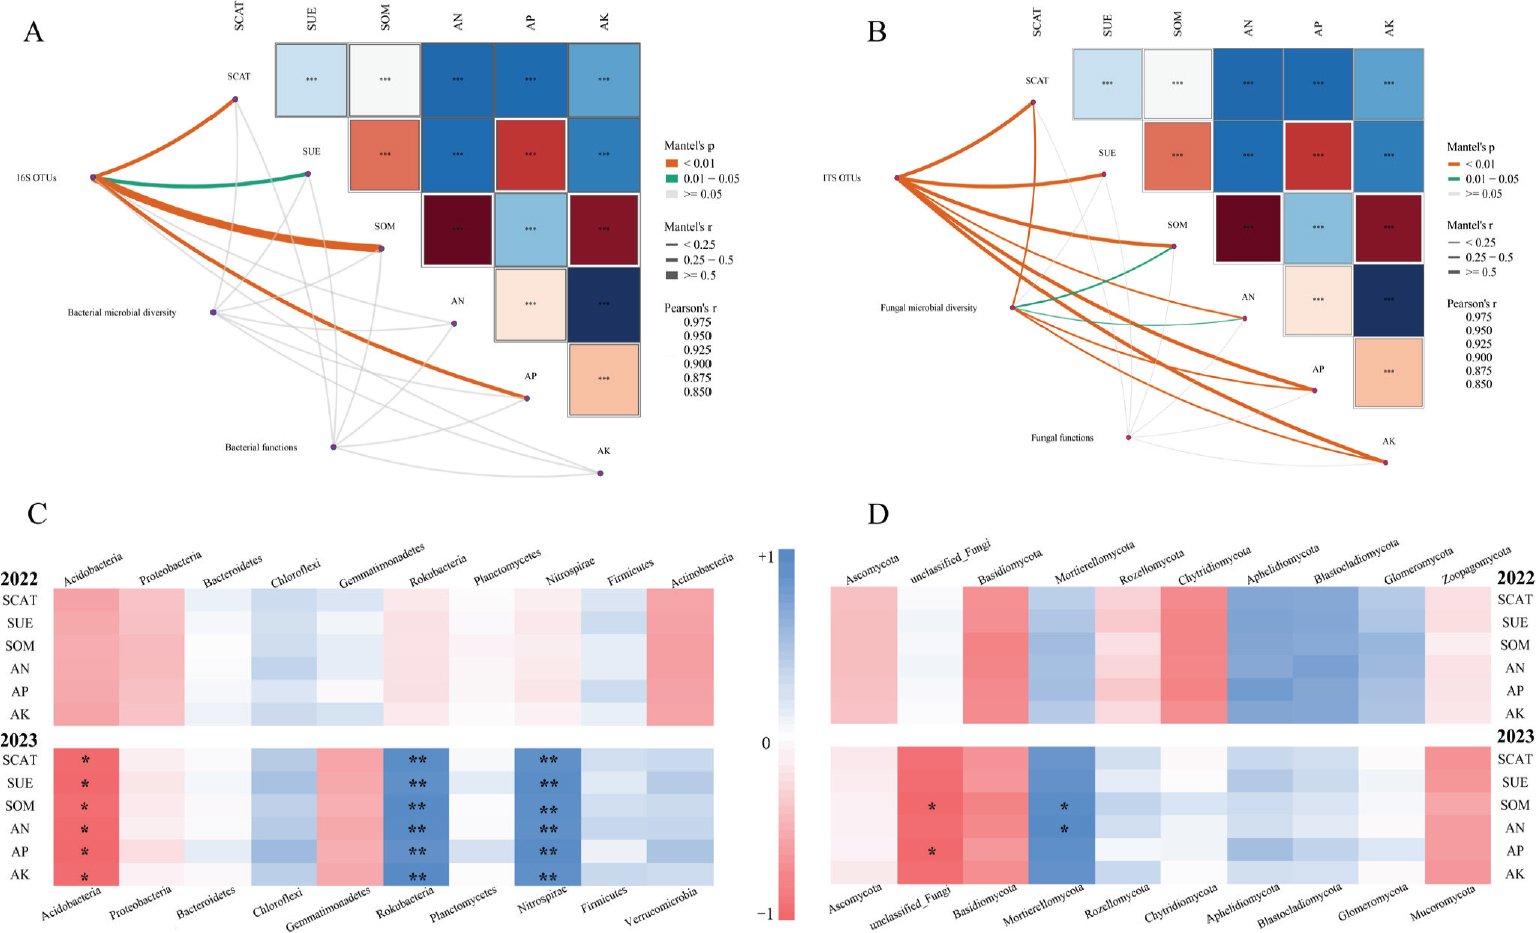
Figure 4.
Pearson correlation analysis and Mantel test between microorganisms and environmental factors. (A, C) bacteria and the chemical properties of soil; (B, D) fungi and the chemical properties of soil. AK, available potassium; AN, available nitrogen; AP, available phosphorus; SCAT, soil catalase; SOM, soil organic matter; SUE, soil urease.
In 2022, no significant correlations were detected between soil physicochemical properties and the dominant bacterial phyla (Figure 4C). By contrast, in 2023, among bacteria, Acidobacteria, Rokubacteria, and Nitrospirae exhibited significant correlations with soil physicochemical properties. Among fungi, unclassified Fungi showed a significant correlation with SOM and AP, whereas Mortierellomycota was significantly correlated with SOM and AN (Figure 4D).
Soil microbial metabolic profiling analysis
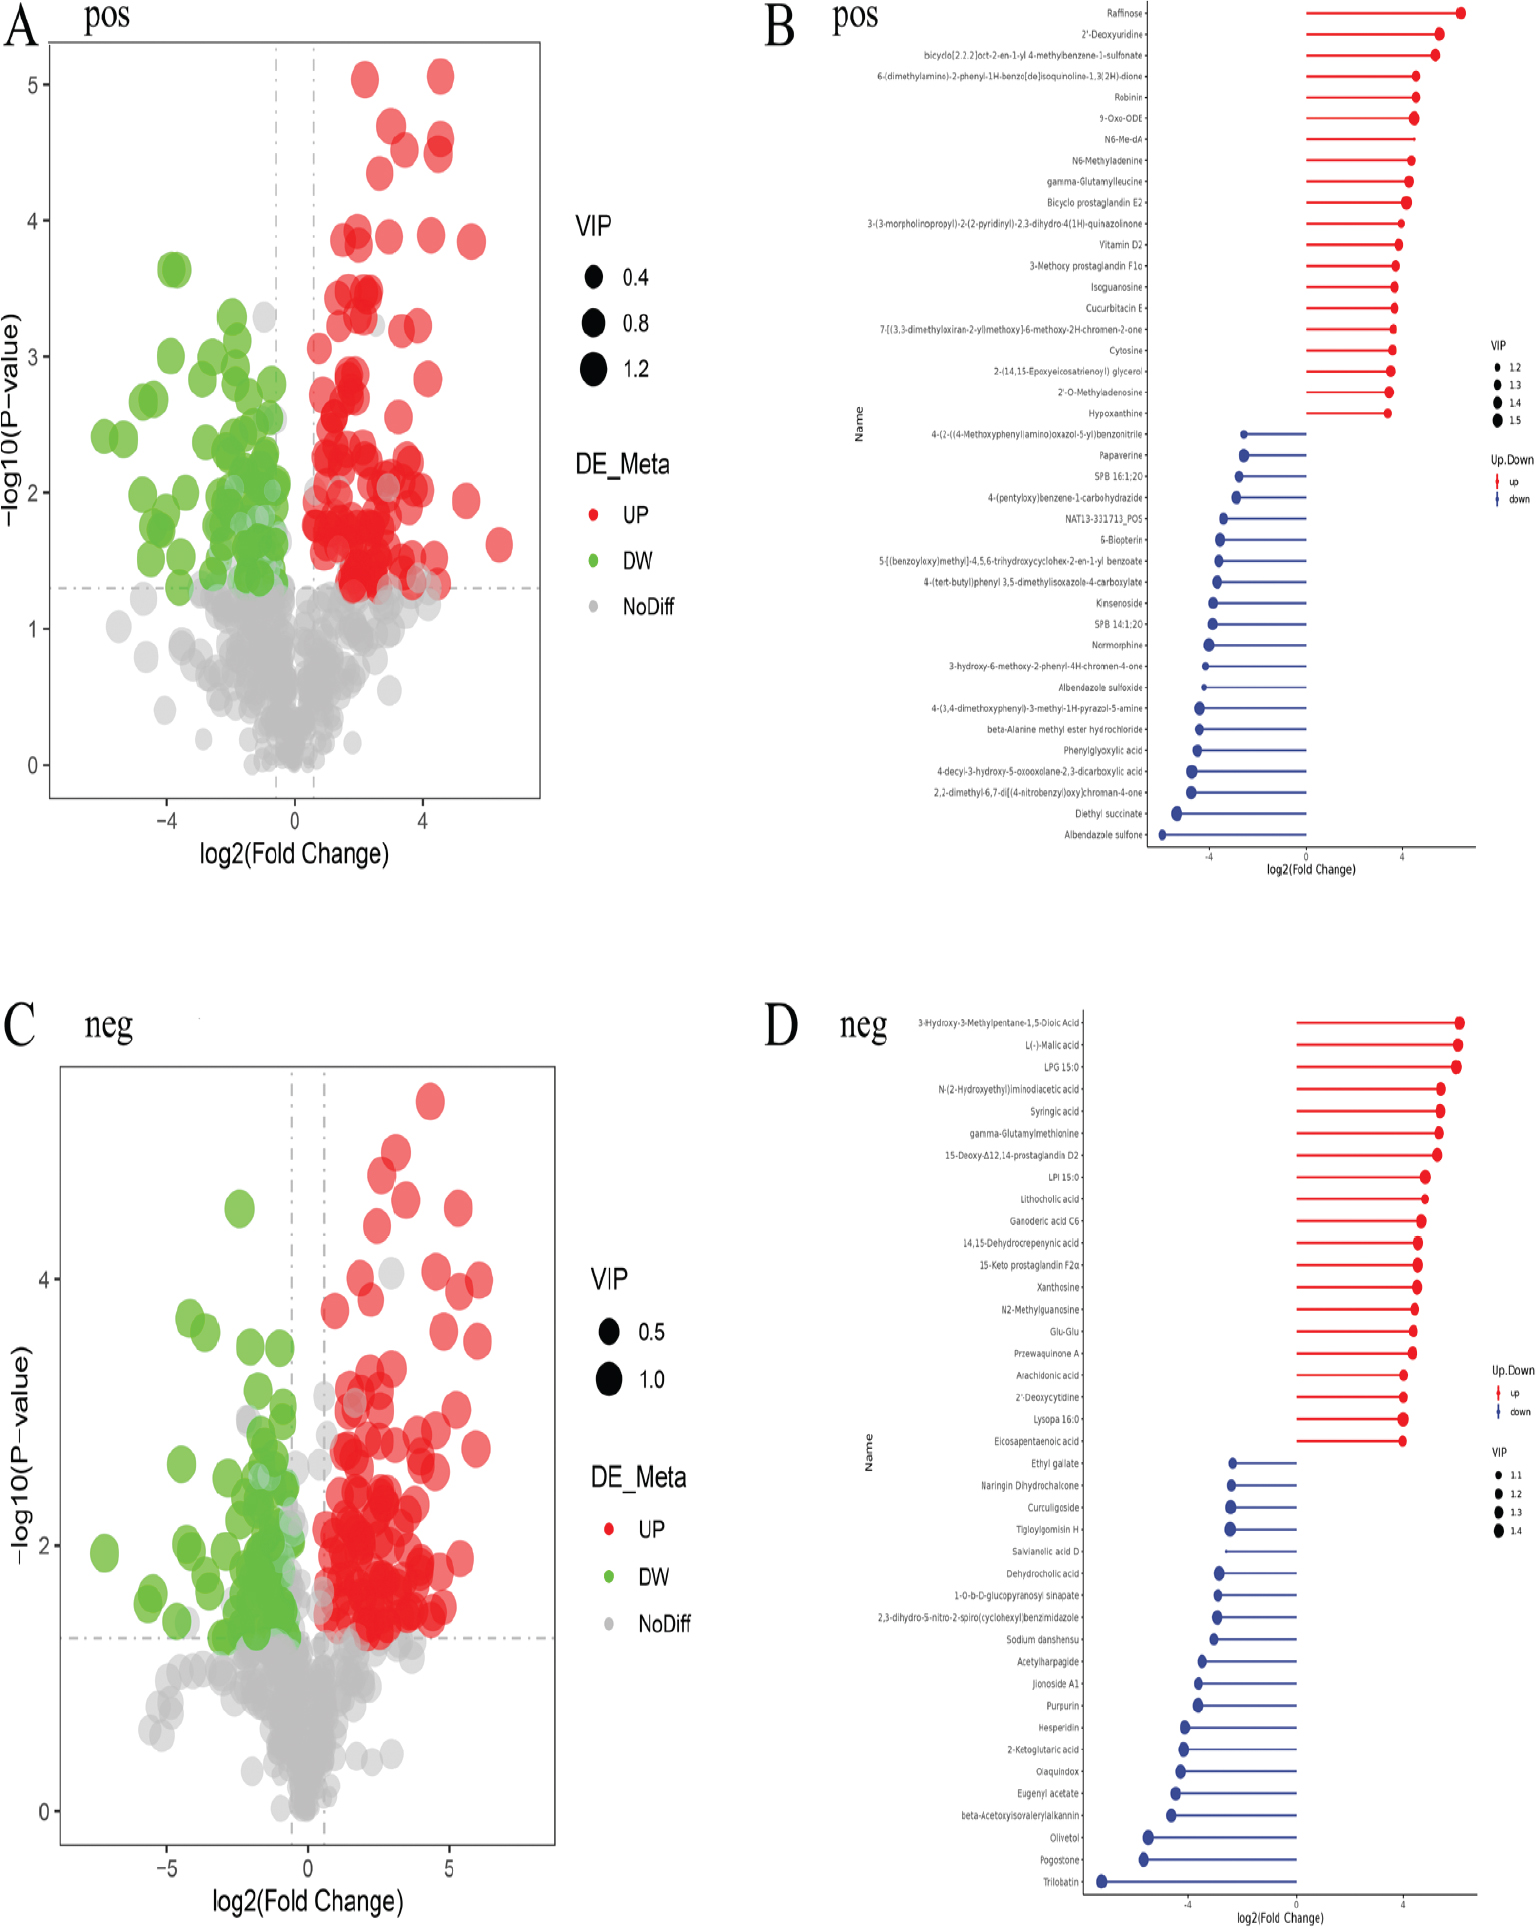
Subsequently, a metabolomic analysis was conducted on the soil under the cover of indian-strawberry in 2023. In the positive mode (POS), a total of 565 metabolites were identified, with 187 differential metabolites detected (108 up-regulated and 79 down-regulated) (Supplementary Figure 2A). Notably, 2′-Deoxyuridine (nucleosides, nucleotides, and analogues) exhibited the most significant up-regulation, whereas diethyl succinate (lipids and lipid-like molecules) showed the most pronounced down-regulation (Supplementary Figure 2B). In the negative mode (NEG), 531 metabolites were detected, including 199 differential metabolites (107 up-regulated and 92 down-regulated) (Supplementary Figure 2C). Specifically, 3-hydroxy-3-methylpentane-1,5-dioic acid (unclassified) demonstrated the highest up-regulation, while pogostone (organic oxygen compounds) was the most significantly down-regulated (Supplementary Figure 2D). The heatmap revealed distinct differences in metabolite profiles between POS and NEG under IC (Figures 5A and 5C). Among them, the number of up-regulated metabolites exceeded that of down-regulated metabolites, indicating that IC may be beneficial for improving soil metabolite profiles.
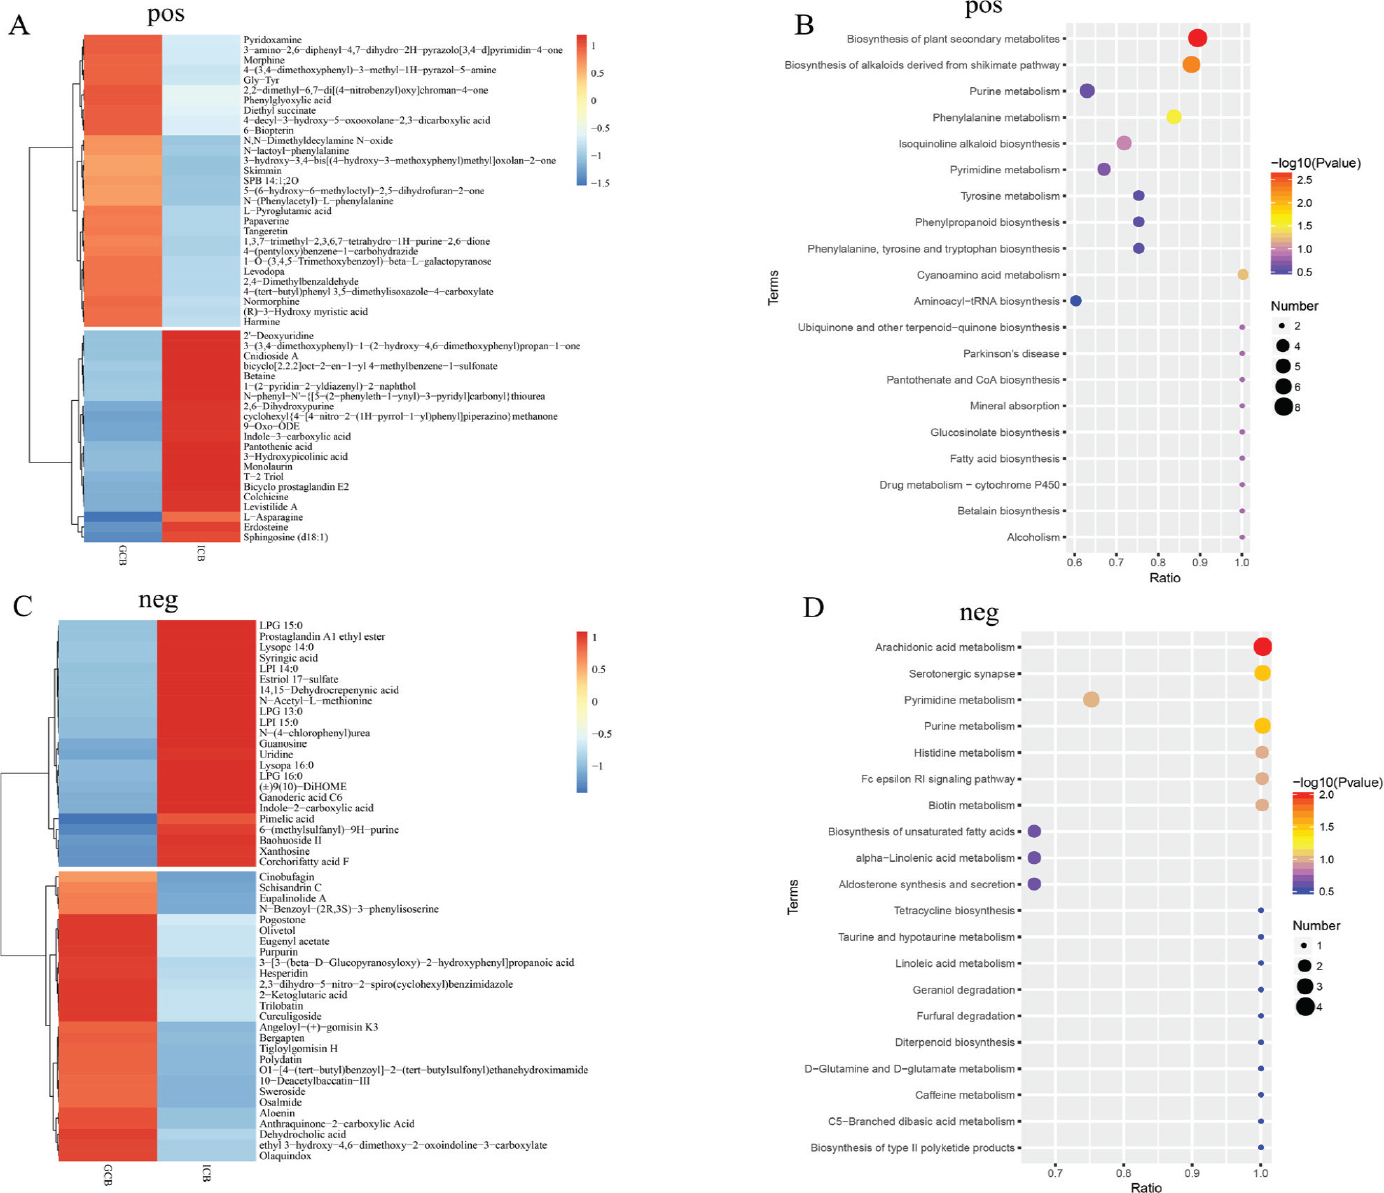
Figure 5.
Metabolite and KEGG pathway enrichment analysis. (A) soil metabolite analysis in the pos; (B) metabolic pathways in the pos; (C) soil metabolite analysis in the neg; (D) metabolic pathways in the neg. GCB, ground-cloth covering in 2023; ICB, Indian-strawberry covering in 2023; NEG, negative mode; POS, positive mode.
Subsequently, KEGG pathway enrichment analysis was performed on the identified metabolites. Under the POS, two key metabolic pathways were identified: Biosynthesis of plant secondary metabolites and Biosynthesis of alkaloids derived from the shikimate pathway (Figure 5B). These pathways exhibited a high degree of enrichment for differential metabolites and contained a substantial number of differentially regulated metabolites, indicating their importance in the metabolic network. Further screening of metabolites involved in these pathways revealed that L-tyrosine, L-phenylalanine, and levodopa were concurrently associated with both pathways. Under the NEG, three prominent metabolic pathways were observed: arachidonic acid metabolism, serotonergic synapse, and purine metabolism (Figure 5D). These pathways also demonstrated significant enrichment of differential metabolites. Screening of the metabolites involved in these pathways indicated that prostaglandin D2, prostaglandin A2, and arachidonic acid were simultaneously implicated in two of these pathways.
Through a comprehensive analysis of the primary metabolites (the top 20 up-regulated and down-regulated differential metabolites) and key metabolic pathways, it was revealed that under POS, the metabolite papaverine (organoheterocyclic compounds) served as an important down-regulated metabolite and played a critical role in key metabolic pathways. Under NEG, the metabolites arachidonic acid (lipids and lipid-like molecules) and xanthosine (nucleosides, nucleotides, and analogues) were identified as significant metabolites participating in key metabolic pathways, both of which were up-regulated. Overall, arachidonic acid was not only involved in multiple essential metabolic pathways but also represented one of the major differential metabolites, warranting particular attention in further investigations.
Microbiome and metabolome correlation analysis
Based on the KEGG enrichment analysis, three metabolites (papaverine, arachidonic acid, xanthosine) were selected for correlation analysis with bacterial phyla, genera, and the top 10 differential OTUs. As illustrated in the figure, these three metabolites exhibited significant correlations with Rokubacteria and Nitrospirae, as well as Chujaibacter, unidentified Alphaproteobacteria, and Sphingomonas. Notably, the metabolite papaverine demonstrated significant correlations with all of the top 10 bacterial OTUs, most of which belonged to the Acidobacteria (with two belonging to the Chujaibacter) (Figures 6A, 6C and 6E). Among fungi, only papaverine showed a significant correlation with unclassified Fungi.Additionally, the metabolites were significantly correlated with Tausonia and Thielavia, and only OTU22 exhibited significant correlations with all three metabolites. Furthermore, papaverine exhibited stronger correlations with the top 10 fungal OTUs compared to the other two metabolites (Figures 6B, 6D and 6F).
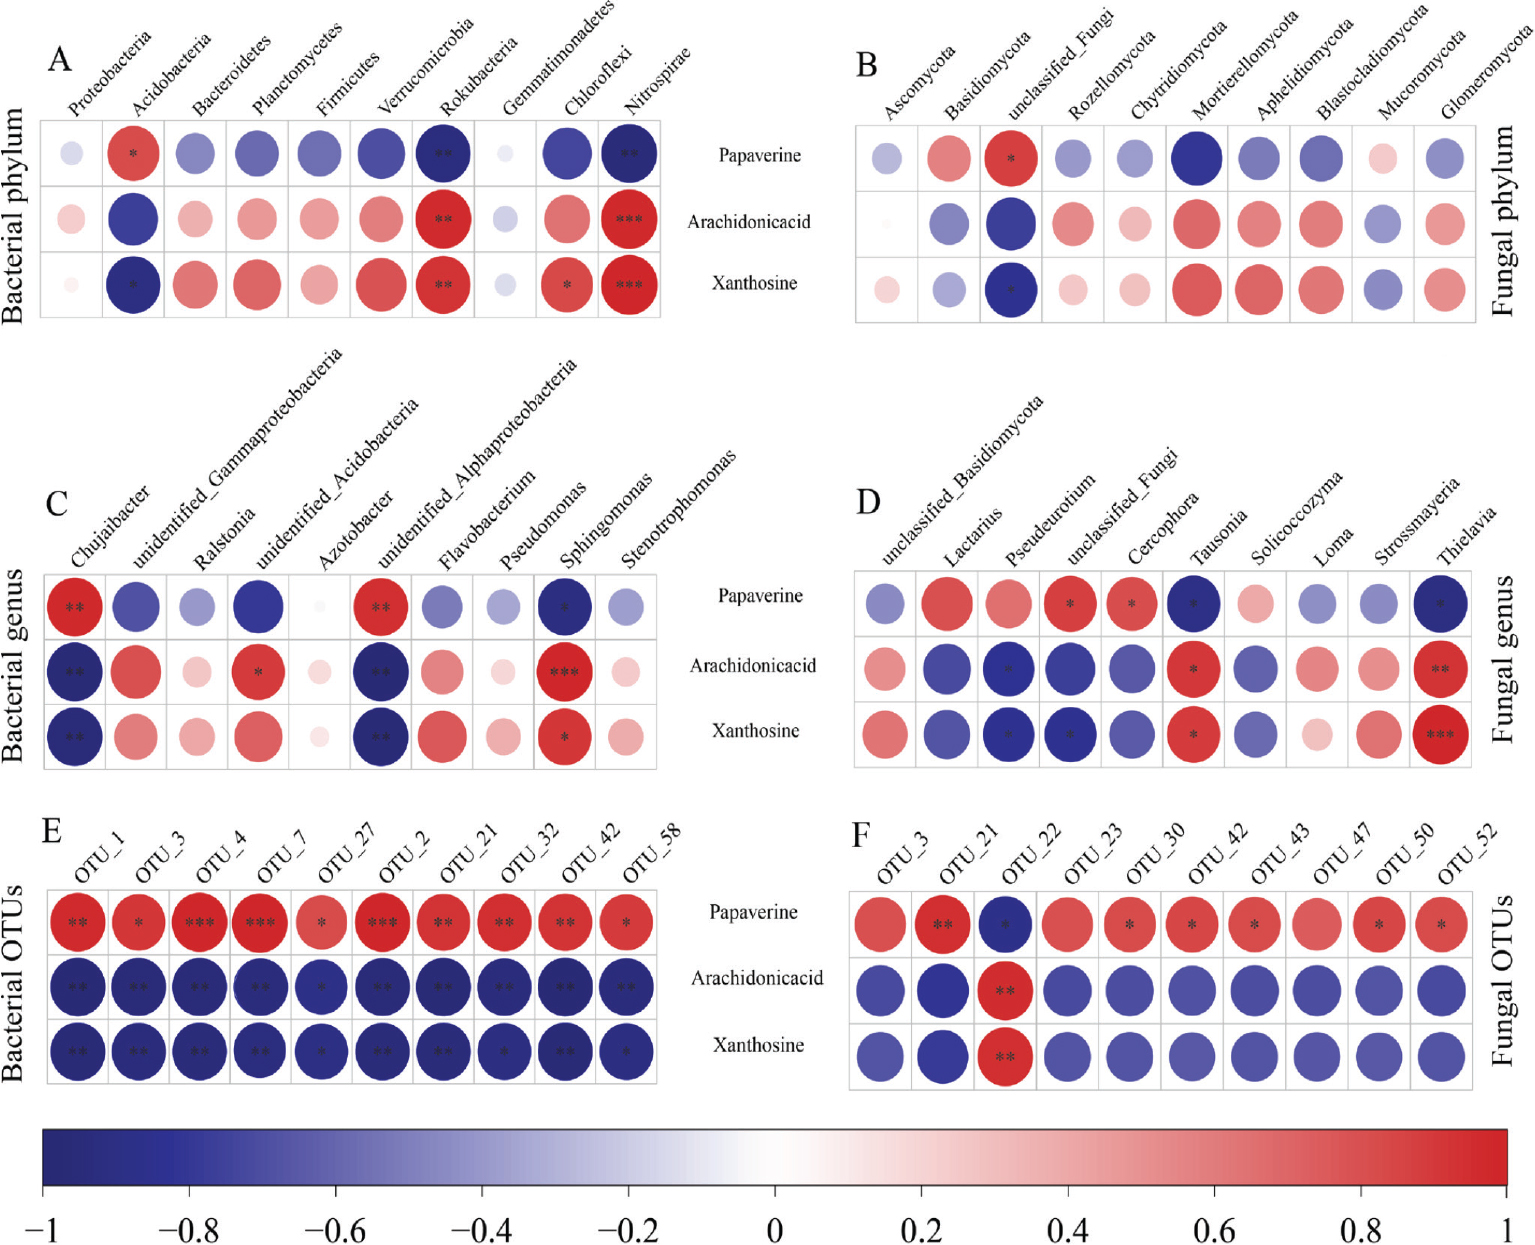
Figure 6.
The correlation between microorganisms and metabolites. (A, C, E) correlation of important metabolites with bacterial phyla, genera, and OTUs; (B, D, F) correlation of important metabolites with fungal phyla, genera, and OTUs. OTUs, operational taxonomic units.
Through Two-way Orthogonal Partial Least Squares (O2PLS) analysis of microbial OTUs and metabolites, the top 10 species and metabolites exhibiting strong correlations in the outer circle were identified. For instance: OTU 8 (bacteria), OTU 3 (fungi), metabolite’s Com 5 neg, Com 43 pos (Figures 7A, 7B, 7E and 7F). Additionally, OTU 3 and OTU 10 demonstrated significant correlations with Com 10 POS and Com 40 POS and occupied key positions within the network diagram (Figures 7C and 7D).
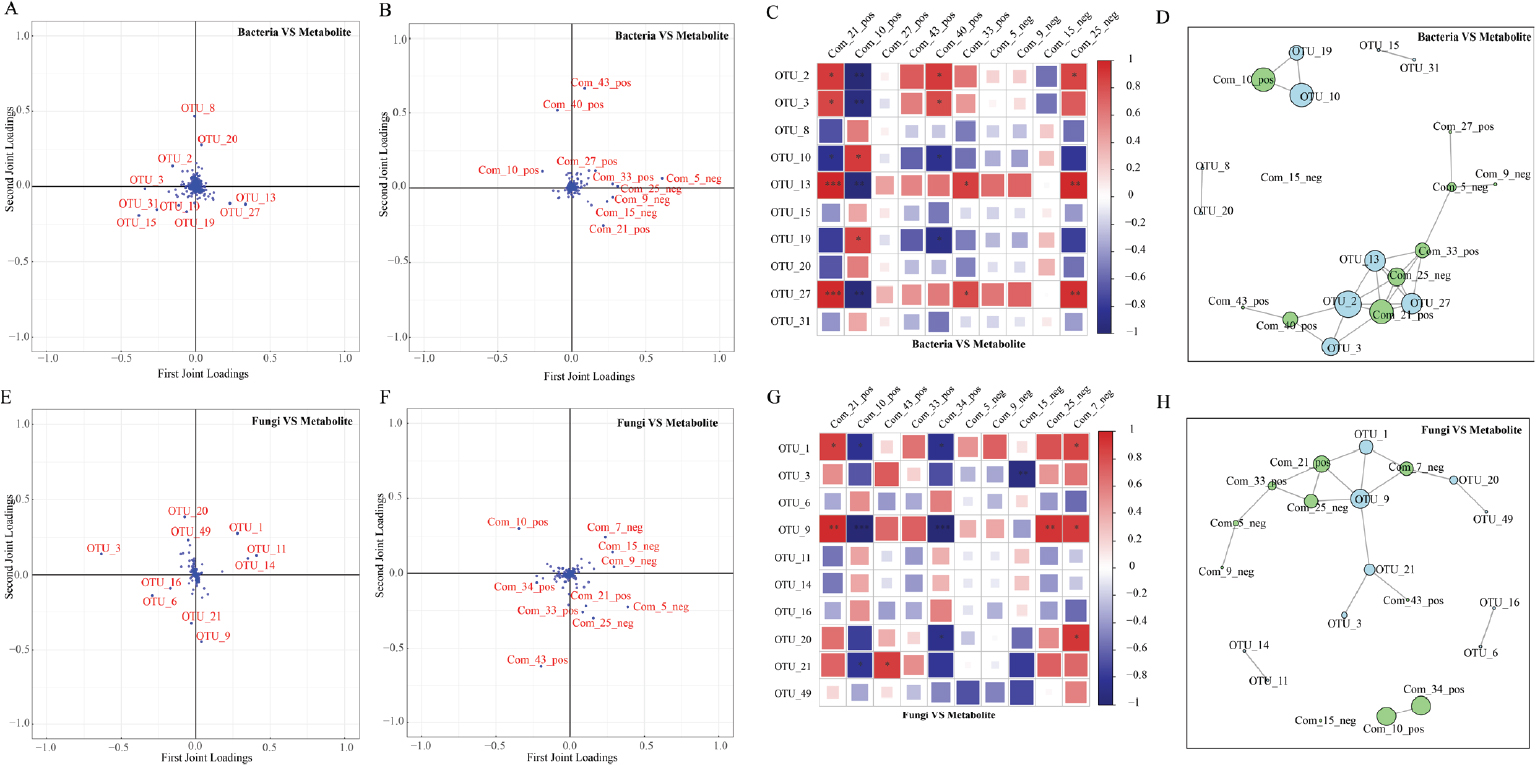
Figure 7.
O2PLS analysis. (A, B) bacterial O2PLS load chart; (E, F): fungal O2PLS load chart; (C, G) bacteria and fungi heatmaps; (D) bacterial-metabolite association diagram; (H) fungal-metabolite association diagram. NEG, negative mode; OTUs, operational taxonomic units; POS, positive mode.
Among the fungal OTUs, OTU 9 and OTU 1 exhibited significant correlations with Com 21 pos (L-pyroglutamic acid), Com 10 pos (guanine), Com 34 pos (bicyclo prostaglandin E2), and Com 7 neg (3-[(Carboxycarbonyl) amino]-L-alanine). Notably, OTU 9 also demonstrated a significant correlation with Com 25 neg (eugenyl acetate). Both OUT 9 and OTU 1 occupied critical positions within the network diagram. Furthermore, although OTU 21 showed weaker correlations with the metabolites, it still played a key role in the network structure (Figures 7G, 7H).
Based on the analysis of Figure 6, it was observed that bacterial OTU 3, fungal OTU 21 (which exhibited weak correlations with metabolites but occupied a critical position in the network diagram and demonstrated relatively high abundance), and the metabolites papaverine, arachidonic acid, and xanthosine warrant particular attention. Furthermore, an integrated analysis of the network diagrams (Figure 7) for bacteria, fungi, and metabolites revealed that Com 21 pos, Com 25 neg, and Com 33 pos (proline) are located at key nodes within the bacterial and fungal networks, thus highlighting their importance for further investigation.
DISCUSSION
Soil physical and chemical properties are critical indicators for sustaining the normal growth of fruit trees. Mulching generally exerts a positive influence on soil quality (Zhou et al., 2019; Samaei et al., 2022; Yan et al., 2024;). After IC, the annual increase rates of SOM and AP in 2023 were markedly higher than those in 2022, likely due to their greater sensitivity to environmental changes. Conversely, while SUE activity, AN, and AK showed substantial increases between 2020 and 2022, their growth was relatively limited in 2023. This may be attributed to either their slower responsiveness to environmental variations or the attainment of a growth threshold. This is basically consistent with the research that long-term fertilisation proves the growth rate of soil AN is less than that of AP and AK (Liu et al., 2024a, 2024b, 2024c).
The research findings reveal that Proteobacteria (bacteria) and Ascomycota (fungi), which exhibit high relative abundance, demonstrated relatively smaller fluctuations over the 2-year study period. In contrast, Acidobacteria (bacteria) and Basidiomycota (fungi) showed greater variation amplitudes. When employing Chinese milk vetch (Astragalus sinicus L.) for soil cover (Liu et al., 2022), certain trends among microbial communities exhibited similarities to those observed under IC. This finding suggests that diverse biological covers exert a substantial influence on soil microorganisms. Additionally, as the relative abundance of species decreased, the magnitude of variation tended to increase progressively. Although some species exhibited inconsistent changes across the 2 years. However, when the relative abundance of the species in the same year is lower than that of previous years, the relative abundance after the IC generally increases. These results indicate that IC exerts selective regulation on bacterial species, primarily depending on species abundance and category, with the degree of regulation varying according to species proportions. Species with higher proportions and greater relative abundance tend to exhibit higher stability. Notably, IC did not alter the composition of dominant species in the soil but only influenced their abundance levels, findings that are consistent with prior studies (Tang et al., 2018; Yin et al., 2024; Liu et al., 2024a, 2024b, 2024c, 2025a, 2025b).
Upon conducting a correlation analysis between microorganisms and soil physicochemical properties, it was observed that bacterial diversity exhibited a weak correlation with soil physicochemical properties, whereas fungal diversity demonstrated a stronger correlation. However, when examining the correlation between soil physicochemical properties and dominant microbial phyla, the correlation of dominant bacterial phyla was stronger than that of bacterial OTUs overall. To address this seemingly inconsistent phenomenon, we hypothesise that the significant correlation between bacteria and soil physicochemical properties is primarily concentrated within three dominant bacterial phyla. Consequently, the number of bacterial OTUs associated with soil physicochemical properties is relatively small but characterised by high abundance and aggregation, whereas in fungi, the number of such OTUs is larger but marked by low abundance and dispersion. It should be noted that the relatively scattered distribution of the fungi mentioned here refers to the fact that the OTUs strongly related to soil physicochemical properties are more dispersed compared to bacteria, while the previously mentioned scattered distribution of bacteria refers to the high diversity, strong dispersion of the bacterial community.
Additionally, we observed that in 2022, neither bacterial nor fungal communities were significantly correlated with soil physicochemical properties. By 2023, however, certain bacterial and fungal phyla became significantly correlated with these properties. This suggests that following IC, both soil physicochemical properties and microbial communities underwent gradual changes, with significant alterations emerging from 2020 to 2023. These results further confirm that the soil improvement effects of IC are gradual rather than immediate. This is consistent with the research that long term clover coverage is still difficult to have an impact on the deep soil. More time is needed to further enhance the influence on the soil (Wang et al., 2022a).
Upon analysing the top 10 OTUs of bacteria and fungi, it was observed that most bacterial OTUs were affiliated with the Acidobacteria, whereas fungal OTUs predominantly belonged to the unclassified Fungi. When focusing on microorganisms strongly associated with the metabolome (joint loading >0.25), bacterial OTUs were primarily classified under the Proteobacteria, while fungal OTUs were mainly assigned to the Ascomycota. It can be noted that in both bacterial and fungal communities, the phyla to which the top 10 OTUs belong differ from those strongly correlated with metabolites. Specifically, although Proteobacteria and Ascomycota exhibit relatively high relative abundances and show minimal changes after IC. Conversely, Acidobacteria and unclassified Fungi display only slightly lower relative abundances compared to Proteobacteria and Ascomycota, but undergo certain changes following IC. This results in both bacteria and fungi exhibiting a certain degree of stability and variability, with the stability of metabolites potentially surpassing that of microorganisms.
Further study into the soil metabolites under IC revealed significant enrichment in several key pathways, including the biosynthesis of plant secondary metabolites and arachidonic acid metabolism. Through integrated analysis, five metabolites, papaverine, xanthosine, L-pyroglutamic acid, eugenyl acetate, and arachidonic acid, were identified as particularly noteworthy. Subsequently, it was found through a literature review that Papaverine, known for its anti-inflammatory properties and other effects, has been extensively studied in medical research and is widely used to treat cardiovascular diseases (Valipour et al., 2022). Xanthosine, acting as a common precursor of purine alkaloids, plays a critical role in energy metabolism recovery and regulates the cellular nucleotide pool, making it an important focus in medical studies (Schroader et al., 2023; Wang et al., 2024). In plants, xanthosine helps maintain purine nucleotide homeostasis and accelerates the rosette and flowering stages of Arabidopsis thaliana through Zea mays Nucleoside Ribohydrolase (ZmNRH) (Heinemann et al., 2021; Ľuptáková et al., 2024). L-pyroglutamic acid, isolated from Ganoderma lucidum extract, exhibits anti-melanogenesis effects and effectively inhibits microbial growth in potatoes and apple ring rot fungi, functioning as a novel antibrowning and antimicrobial agent with strong antimicrobial activity (Fu et al., 2020; Hsieh et al., 2024; Tang et al., 2025). Furthermore, L-pyroglutamic acid promotes the growth and sporulation of Bacillus licheniformis, enhances the efficiency of microbial fermentation feed, and increases the yield of fresh Pleurotus ostreatus mushrooms (Ma et al., 2024; Liu et al., 2025a, 2025b). In summary, research on papaverine in plants remains limited; its anti-inflammatory effects may manifest as antioxidant activity and stress resistance in plant systems. Xanthosine may promote flowering acceleration in fruit trees, while L-pyroglutamic acid demonstrates notable resistance against plant pathogens, indicating potential applications.
Clove oil emulsion containing eugenyl acetate can serve as an effective alternative to chemical agents in anti-inflammatory and wound-healing applications (Banerjee et al., 2020). Eugenyl acetate extracted from clove essential oil exhibits potent antibacterial activity against Aspergillus strains, suppresses hyphal and mycelial growth, and significantly mitigates symptoms of anthracnose caused by Colletotrichum species (Shahina et al., 2022; Allizond et al., 2023; Schorr et al., 2024). Clove essential oil, primarily composed of eugenol and eugenyl acetate, demonstrates antioxidant and insecticidal properties (Haro-González et al., 2021). Arachidonic acid plays a critical role in immunomodulation and anti-inflammatory responses in medicine and may potentially enhance disease resistance in plants (Xu et al., 2023; Cui et al., 2025). Treatment of crops such as tomatoes, beets, and grapes with low concentrations of Arachidonic acid preparations can improve their resistance to various diseases, including grey mould, root rot, and powdery mildew, thereby enhancing crop yields (Dedyukhina et al., 2014; Ren et al., 2025). Consequently, arachidonic acid holds promising potential for applications in soil improvement, enhancing soil disease resistance, and reducing pesticide usage. The issue of continuous cropping is typically attributed to factors such as the proliferation of soil microbial pathogens and the accumulation of harmful substances. Nevertheless, certain studies have suggested that mulching can mitigate the adverse effects of continuous cropping (Xu et al., 2024). This could be due to the fact that mulching enhances the structure of the microbial community, modulates the composition of soil metabolites, and promotes the gradual restoration of soil health. Furthermore, the metabolites identified in this study may also exert relevant effects, warranting further investigation.
CONCLUSIONS
The IC has a certain positive effect on the micro-ecology of the soil in the pear orchard, which is beneficial for improving the physical and chemical properties of the soil and improving the composition of the microbial community. However, the process of improving soil micro-ecology is relatively slow, and it takes 3–5 years to show obvious changes. Nevertheless, it has the characteristics of dwarfing, a long growth cycle, and a strong ability to inhibit weeds, and thus has a promising application prospect. In addition, it was found that Acidobacteria exhibited a highly significant positive correlation with soil physicochemical properties. Following soil coverage with indian strawberry, a greater number of soil metabolites were upregulated; three metabolites with application potential have been identified: L-pyroglutamic acid, eugenyl acetate, and arachidonic acid.
Notes
[1] Contributed by AUTHOR CONTRIBUTIONS
M.J., L.G., J.X., L.L., H.L., Y.Y., L.Z., and B.H. contributed to the study conception and design. Material preparation, data collection, and analysis were performed by M.J. The first draft of the manuscript was written by M.J. All authors commented on previous versions of the manuscript. All authors read and approved the final manuscript.
[2] Conflicts of interest CONFLICT OF INTEREST
The authors declare no conflict of interest.
SUPPLEMENTARY MATERIALS
Supplementary Figure 1.
Dominant soil microorganism species. (A, B) bacterial genus and species; (C, D) fungal genus and species; GCA, ground-cloth covering in 2022; GCB, ground-cloth covering in 2023; ICA, Indian-strawberry covering in 2022; ICB, Indian-strawberry covering in 2023.
Supplementary Figure 2.
Differences in soil metabolites. (A, B) soil metabolite analysis in the pos; (C, D) soil metabolite analysis in the neg. NEG, negative mode; POS, positive mode.