
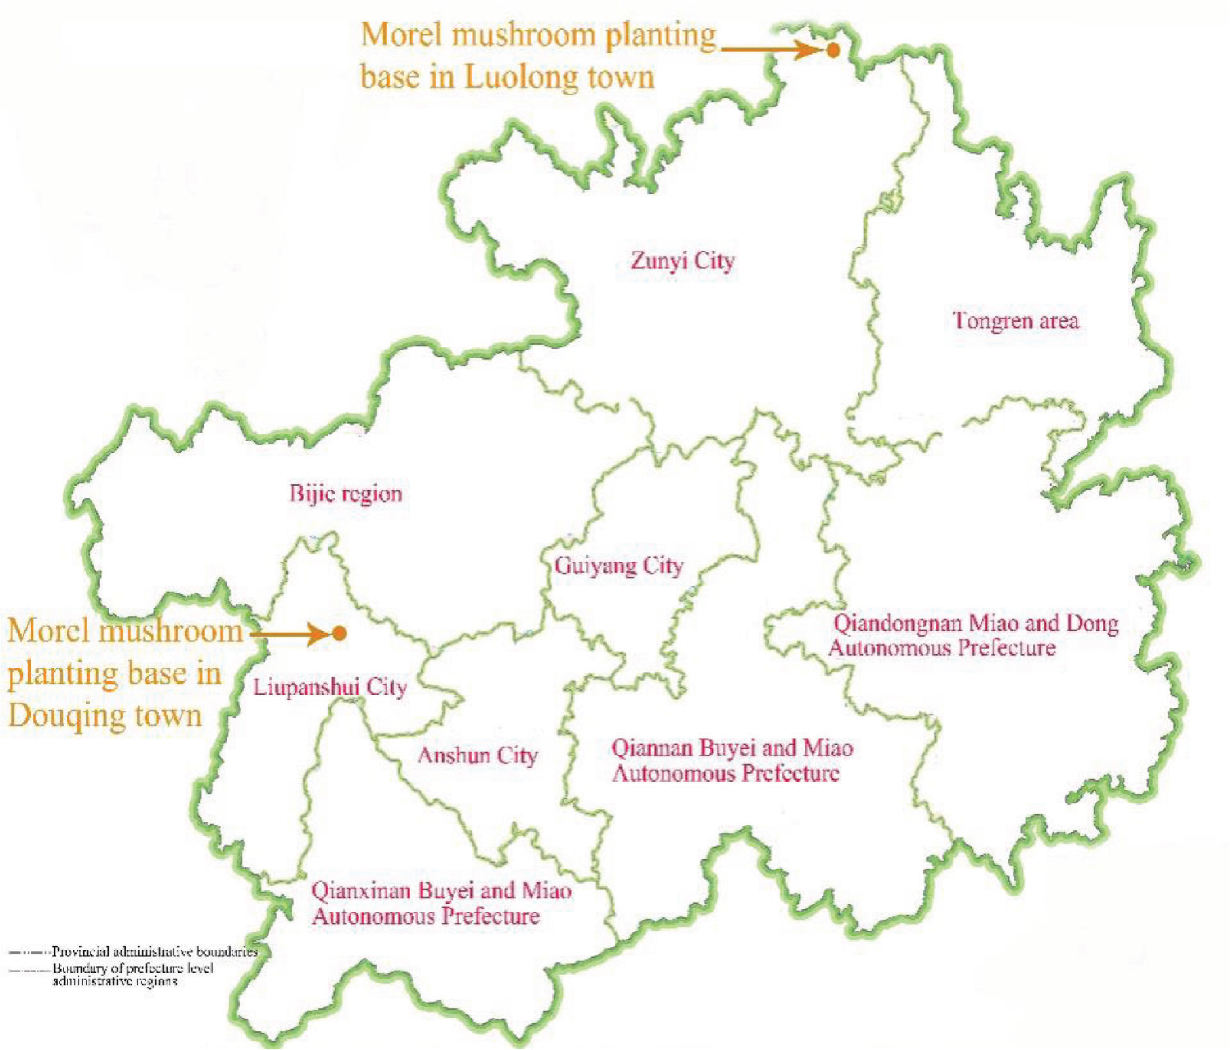
Figure 1.
Location map of morel mushroom planting bases (Guizhou Province).
Table 1.
Soil nutrient content characteristics pre-planting and post-planting morel mushroom cultivation in different locations.
| Eigenvalue | Unit | Daozhen | Shuicheng | ||
|---|---|---|---|---|---|
| Pre-planting | Post-planting | Pre-planting | Post-planting | ||
| pH | 7.04 ± 0.41 a | 6.87 ± 0.37 a | 6.11 ± 0.34 a | 5.83 ± 0.30 a | |
| SOM | g · kg−1 | 55.63 ± 3.99 a | 55.22 ± 4.06 a | 42.83 ± 3.93 b | 58.09 ± 2.19 a |
| TN | 1.66 ± 0.24 a | 1.68 ± 0.22 a | 1.64 ± 0.11 b | 2.08 ± 0.06 a | |
| TP | 0.79 ± 0.12 a | 0.71 ± 0.15 a | 0.65 ± 0.06 a | 0.58 ± 0.04 a | |
| TK | 11.61 ± 1.06 a | 11.62 ± 1.18 a | 4.92 ± 0.09 a | 4.34 ± 0.26 b | |
| AN | mg · kg−1 | 115.93 ± 6.82 a | 125.75 ± 5.37 a | 149.92 ± 0.95 b | 222.03 ± 7.09 a |
| AK | 75.82 ± 5.69 a | 140.07 ± 9.55 a | 299.93 ± 6.08 b | 420.35 ± 3.93 a | |
| AP | 25.72 ± 2.65 a | 22.9 ± 1.83 a | 30.54 ± 2.79 b | 59.06 ± 3.22 a | |
| WSH | % | 1.14 ± 0.05 a | 0.89 ± 0.11 b | 0.74 ± 0.02 a | 0.71 ± 0.04 a |
| THA | 2.44 ± 0.16 b | 3.01 ± 0.09 a | 3.40 ± 0.06 b | 3.62 ± 0.04 a | |
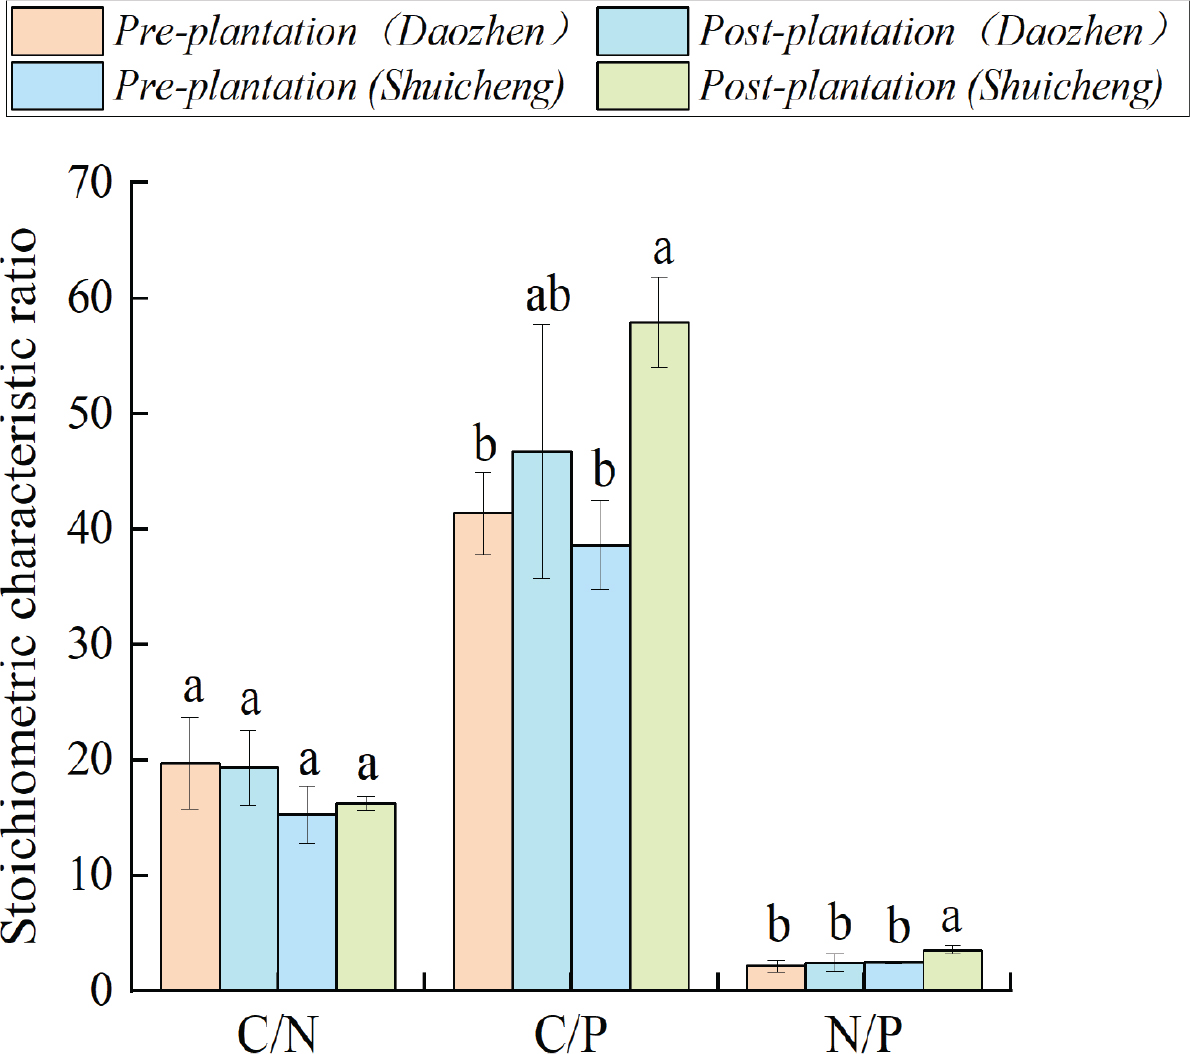
Figure 2.
Ratio of soil chemical characteristics pre-planting and post-planting morel mushroom cultivation in different locations. Lowercase letters in the figure indicate significant differences in the ratio of soil chemical characteristics pre-planting and post-planting in different locations at the 0.05 level.
Table 2.
Changes in soil mineral element content pre-planting and post-planting morel mushroom cultivation.
| Element | Unit | Daozhen | Shuicheng | ||
|---|---|---|---|---|---|
| Pre-planting | Post-planting | Pre-planting | Post-planting | ||
| Ca | g · kg−1 | 3.06 ± 0.66 a | 2.73 ± 0.07 a | 0.80 ± 0.10 a | 1.33 ± 0.18 a |
| Mg | 3.91 ± 0.81 a | 3.88 ± 0.24 a | 1.73 ± 0.09 a | 1.88 ± 0.15 a | |
| Al | 29.60 ± 3.33 a | 27.11 ± 2.00 a | 21.46 ± 2.90 a | 23.70 ± 0.80 a | |
| Na | 1.72 ± 0.05 a | 1.71 ± 0.06 a | 0.55 ± 0.01 a | 0.52 ± 0.01 a | |
| Fe | mg · kg−1 | 32.36 ± 1.36 a | 32.15 ± 1.26 a | 18.63 ± 0.67 a | 17.71 ± 2.98 a |
| Cu | 31.34 ± 2.36 a | 29.95 ± 2.72 a | 11.16 ± 1.78 a | 11.32 ± 1.04 a | |
| Zn | 99.5 ± 5.59 a | 97.20 ± 4.31 a | 62.80 ± 3.24 a | 61.00 ± 3.92 a | |
| Mn | 904.99 ± 17.85 a | 857.35 ± 27.27 a | 496.21 ± 38.86 a | 392.16 ± 46.25 b | |
| Co | 29.69 ± 3.45 a | 29.71 ± 5.00 a | 9.85 ± 0.86 a | 9.58 ± 0.35 a | |
| Be | 6.94 ± 0.76 a | 6.61 ± 0.65 a | 3.26 ± 0.56 a | 3.30 ± 0.33 a | |
| Sr | 57.81 ± 1.82 a | 50.29 ± 7.39 a | 29.87 ± 2.32 a | 40.24 ± 9.01 a | |
| Se | 0.66 ± 0.02 a | 0.52 ± 0.06 b | 0.58 ± 0.05 a | 0.49 ± 0.03 b | |
| Ni | 29.02 ± 1.27 a | 28.45 ± 1.96 a | 13.76 ± 0.76 a | 14.92 ± 0.88 a | |
| B | ND | ND | ND | ND | |
| Mo | ND | ND | ND | ND | |
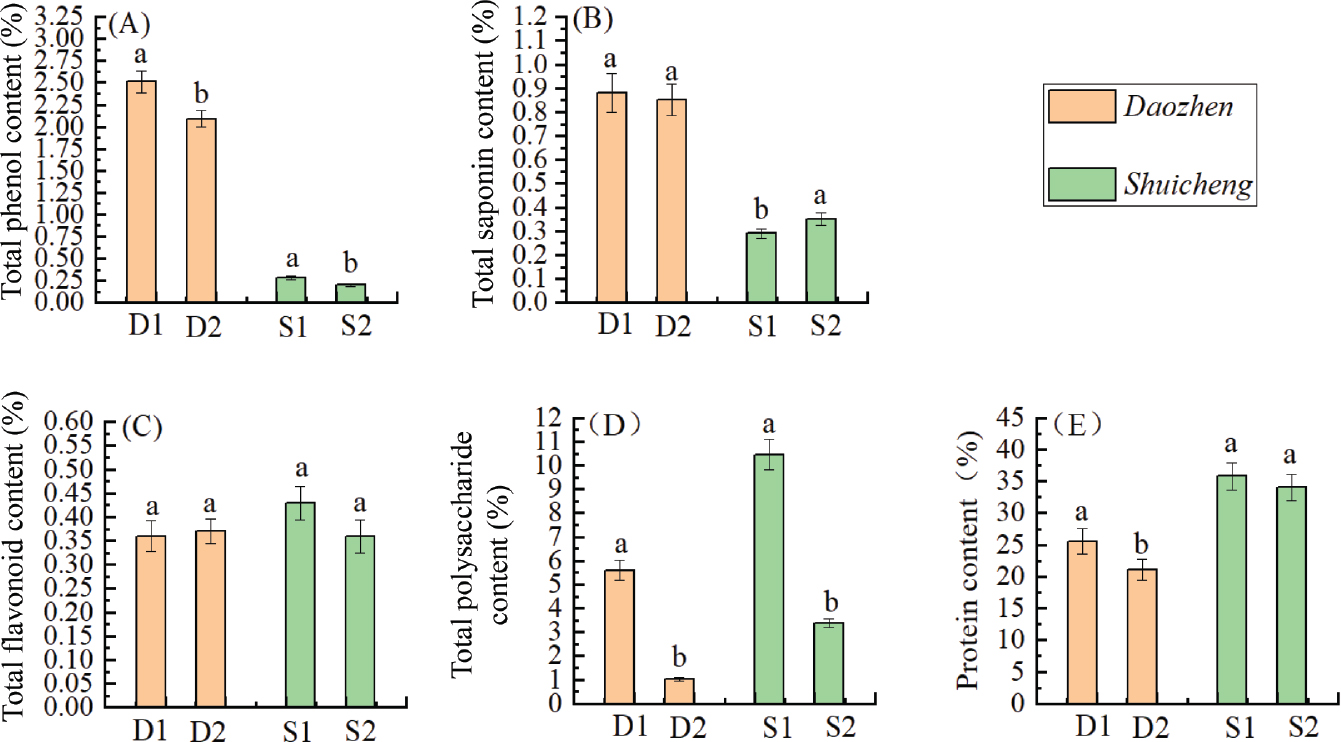
Figure 3.
Effective components of morel mushrooms of different origins. Daozhen cap (D1), Daozhen stalk (D2), Shuicheng cap (S1) and Shuicheng stalk (S2). Total phenol content (A), total saponin content (B), total flavonoid content (C), total polysaccharide content (D), protein content (E). Lowercase letters in the graphs indicate the significance of differences between the caps and stalks of morel mushrooms of the same origin (p < 0.05).
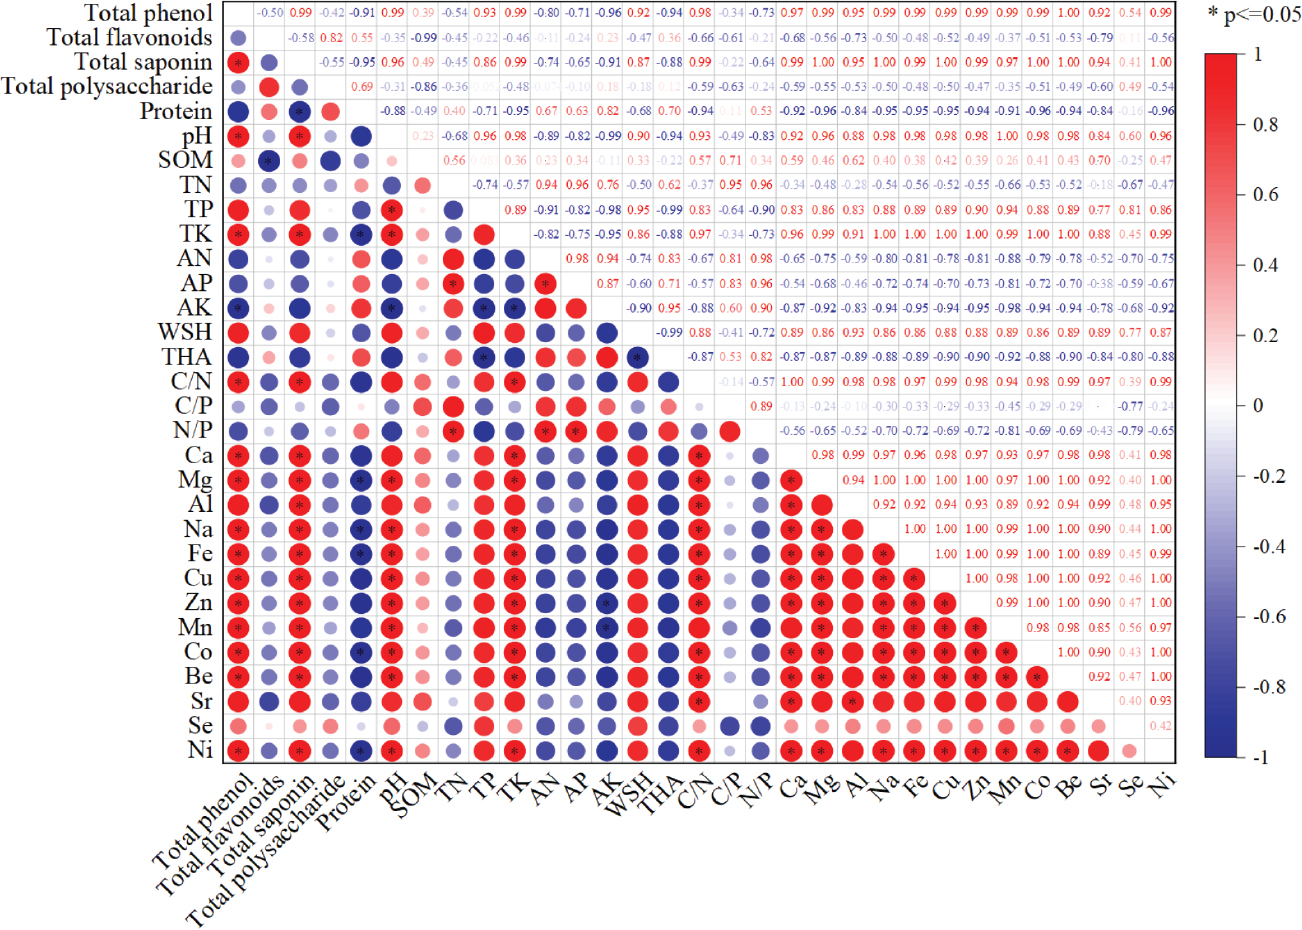
Figure 4.
Heat map showing the correlation analysis between soil factors and the effective components of morel mushrooms. AK, available potassium; AN, alkali-hydrolysable nitrogen; AP, available phosphorus; THA, total humic acid; TK, total potassium; TP, total phosphorus; WSH, water-soluble humic acid.