
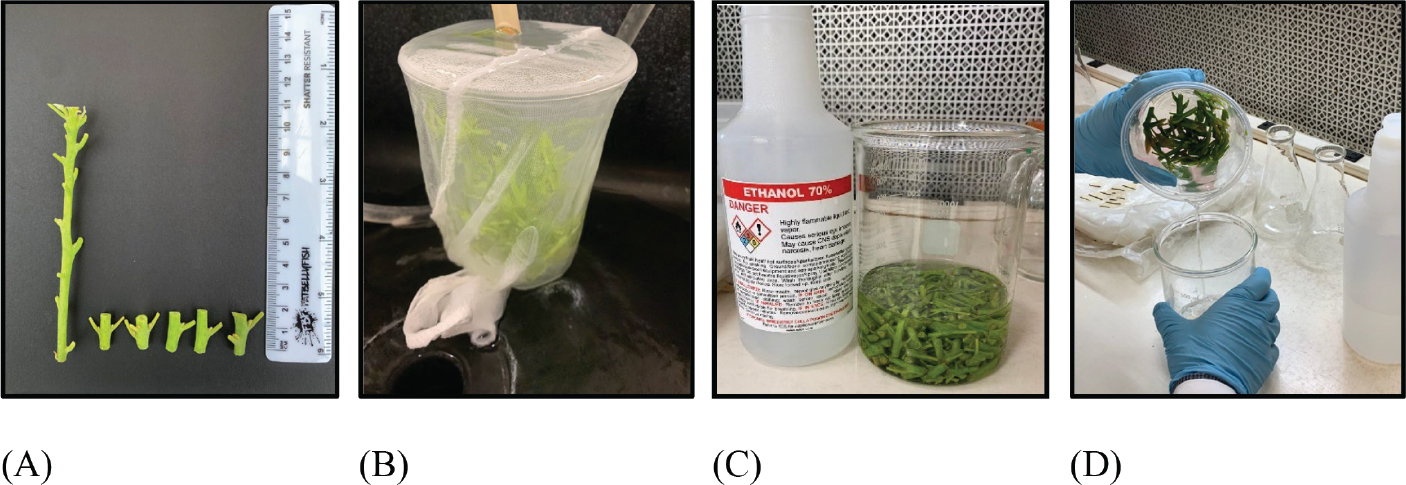
Figure 1.
Preparation of explants for surface sterilisation: the nodal segments measuring 1–2 cm in length (A), rinsing under running tap water (B), soaking in 70% ethyl alcohol (C) and rinsing with deionized distilled water (D).
Table 1.
Types, concentrations and durations of sterilising agents used for the sterilisation of nodal segments.
| Types of sterilising agents | Concentration (%) | Duration (min) |
|---|---|---|
| NaOCl | 5.0, 10.0, 20.0 (v/v) | 10, 20 |
| HgCI2 | 0.1, 0.5, 1.0 (w/v) | 5, 10 |
| Na-merthiolate | 0.01, 0.05, 0.5 (w/v) | 5, 10 |
| NaDCC | 0.15, 0.25, 0.35 (w/v) | 10, 20 |
Table 2.
Composition of the nutrient media used at different stages of micropropagation of ‘Duke 7’ rootstock.
| Different stages | Basal medium | PGR and additives | Carbohydrate source | Gelling agent |
|---|---|---|---|---|
| Establishment | Modified MS | 0.01% AC | 3% sucrose | 0.7% agar |
| Proliferation | Modified MS | BAP (0.00, 2.22, 4.44, 8.88 μM) or KIN (0.00, 2.32, 4.65, 9.29 μM) or TDZ (0.00, 0.45, 2.27, 4.54 μM) with GA3 (0.87 μM) and IAA (0.06 μM) | 3% sucrose | 0.7% agar |
| Rooting | Modified MS | – | 3% sucrose | 0.7% agar |
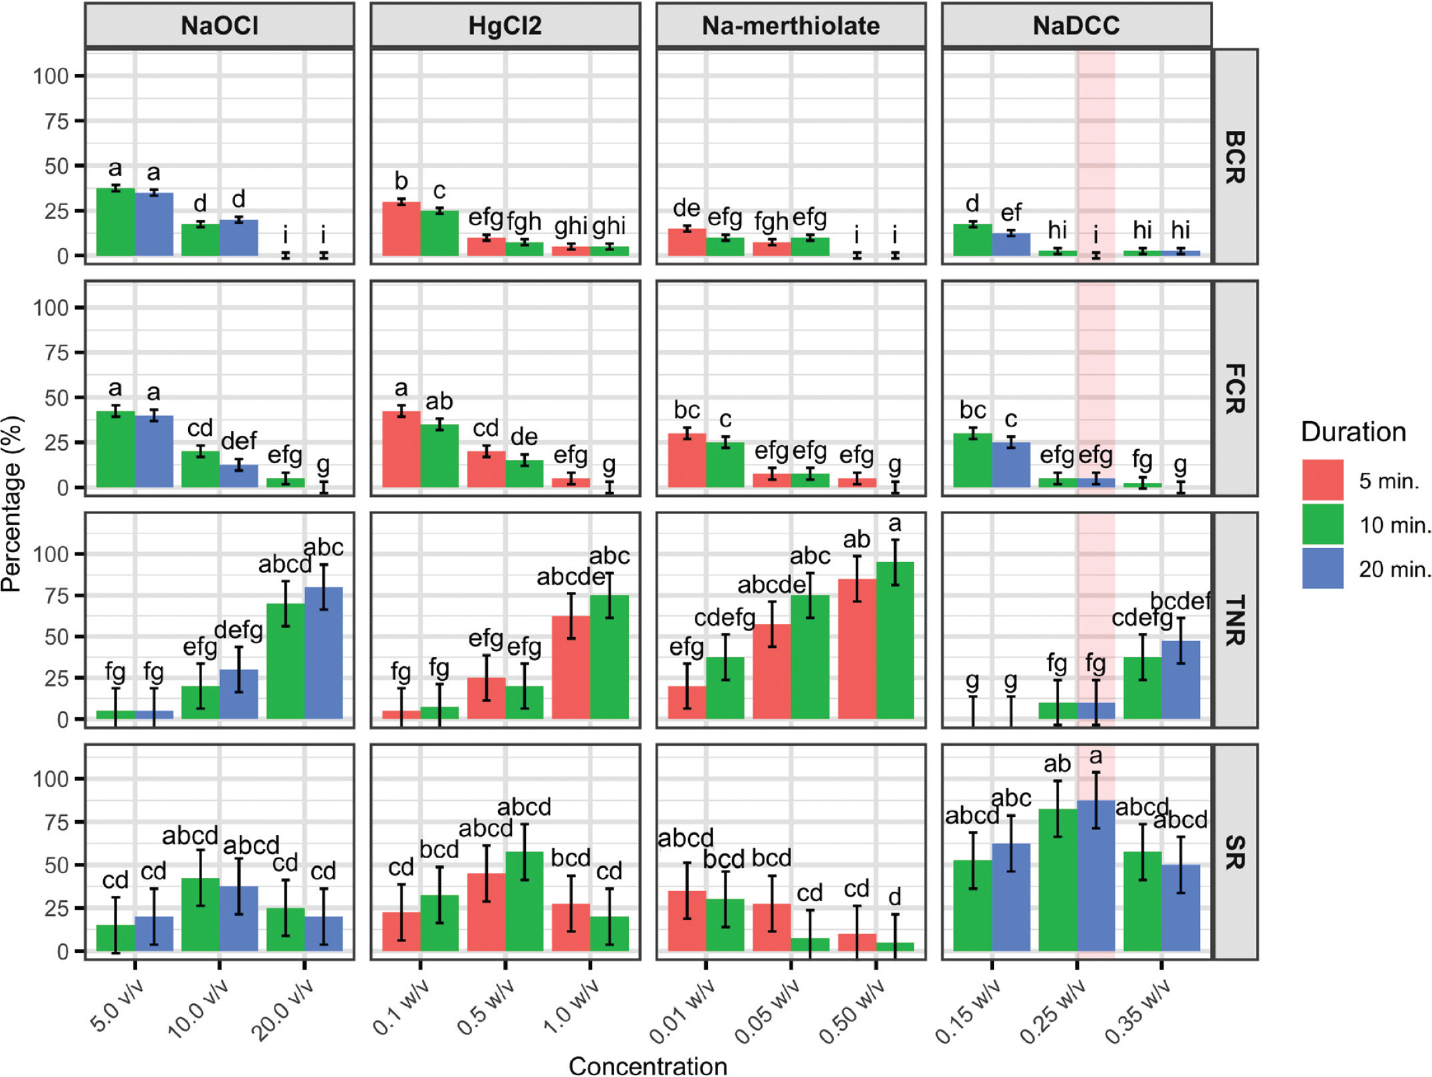
Figure 2.
Mean values of sterilisation traits (BCR, FCR, TNR and SR) for different agent-concentration-duration combinations are presented. Bars with different letters indicate statistically significant differences among all treatment combinations based on Duncan’s multiple range test (p ≤ 0.05), and the whiskers represent the standard error values. Red shading highlights the most desirable agent-concentration-duration combination for overall sterilisation traits. BCR, bacterial contamination (%); FCR, fungal contamination (%); TNR, tissue necrosis rate (%) and SR, survival rate (%).
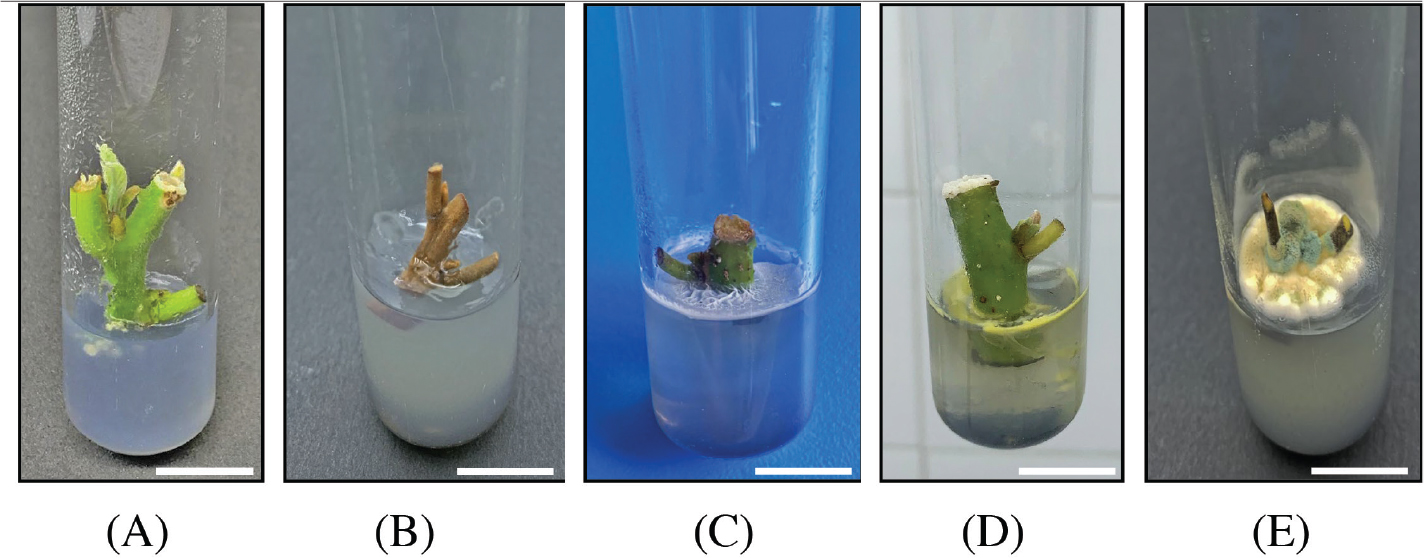
Figure 3.
Representative responses of ‘Duke 7’ nodal segments following different surface sterilisation treatments: healthy nodal segment (A), nodal segment necrosis (B), bacterial contamination (C, D), and fungal contamination (E) on modified MS medium. Scale bar = 1 cm.
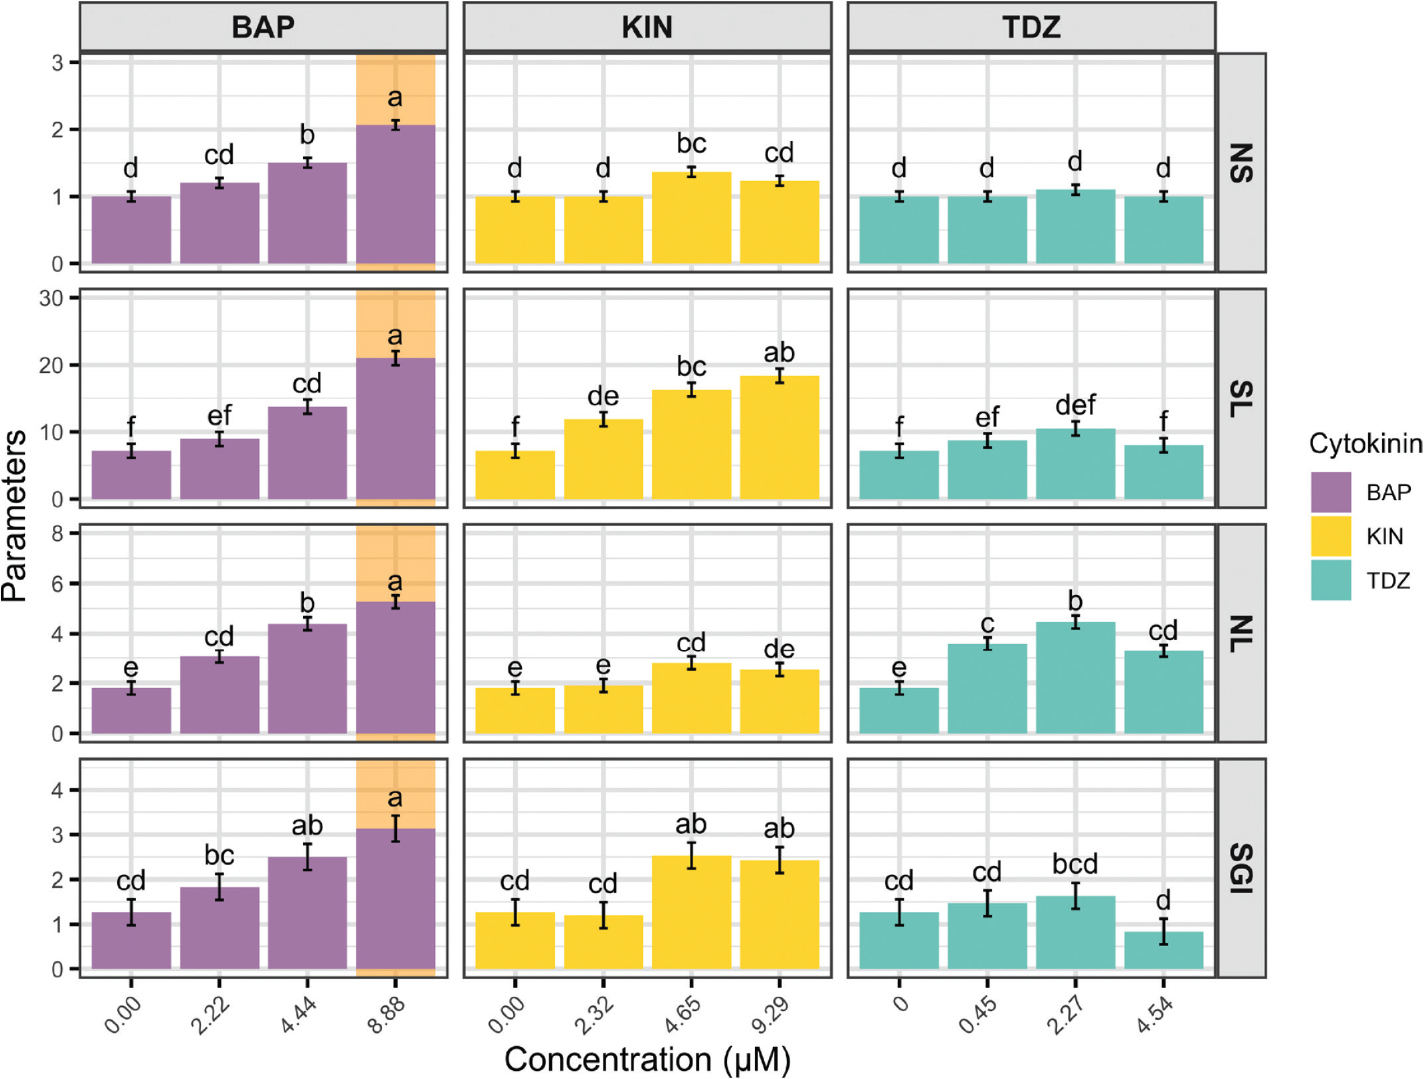
Figure 4.
Mean values of proliferation traits (NS, SL, NL and SGI) for different cytokinin–concentration combinations are presented. Bars with different letters indicate statistically significant differences among all treatment combinations based on Duncan’s multiple range test (p ≤ 0.05), and the whiskers represent the standard error values. Orange shading highlights the most desirable cytokinin-concentration combination for overall proliferation traits. NS, number of shoot (no.); SL: shoot length (mm); NL, number of leaves (no.) and SGI, shoot growth index (0–4).
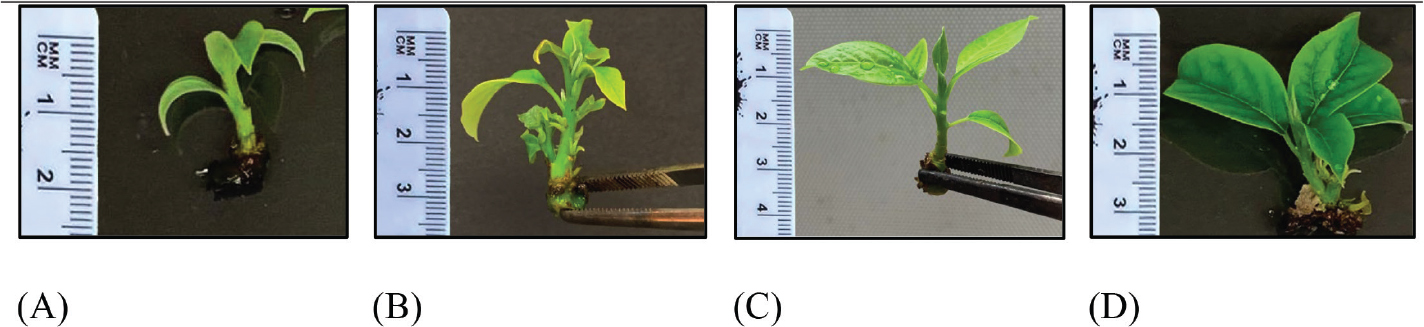
Figure 5.
Representative shoot development at the end of the 12th week of the proliferation stage under different treatments: control (A), 8.88 μM BAP (B), 9.29 μM KIN (C) and 2.27 μM TDZ (D).
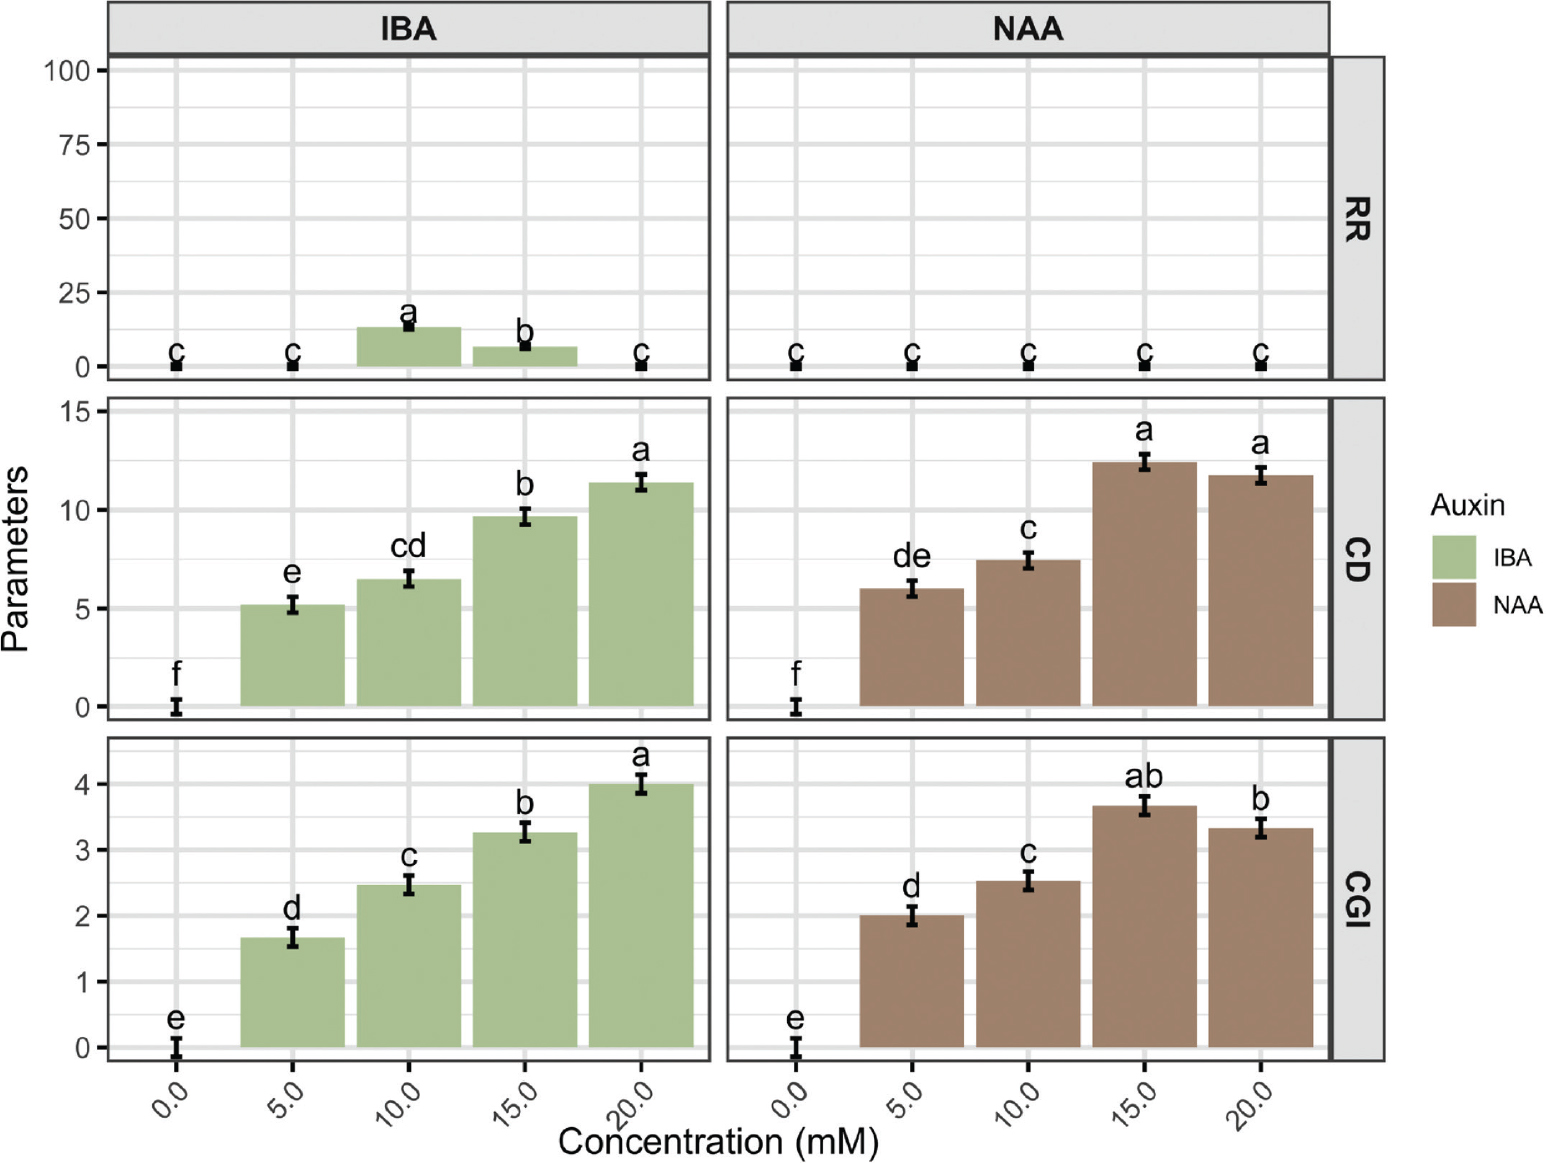
Figure 6.
Mean values of rooting traits (RR, CD and CGI) for different auxin-concentration combinations are presented. Bars with different letters indicate statistically significant differences among all treatment combinations based on Duncan’s multiple range test (p ≤ 0.05) and the whiskers represent the standard error values. RR, rooting rate (%), CD, callus diameter (mm) and CGI, callus growth index (0–4). IBA, indole-3-butyric acid; NAA, naphthalene acetic acid.