
Table 1.
Formula used to calculate papaya seed germination parameters, according to Taghizadeh and Solgi (2017).
| GP | Ng = germinated seeds Nt = total sown seeds | |
| GRI | Gi = the germination on each day after number of days from sowing i = alternate day after sowing | |
| CV | Ni = the number of germinated seeds Ti = the last day of germination | |
| SVI | SVI = (PL + RL) × GP | PL = shoot length RL = root length GP = germination percentage |
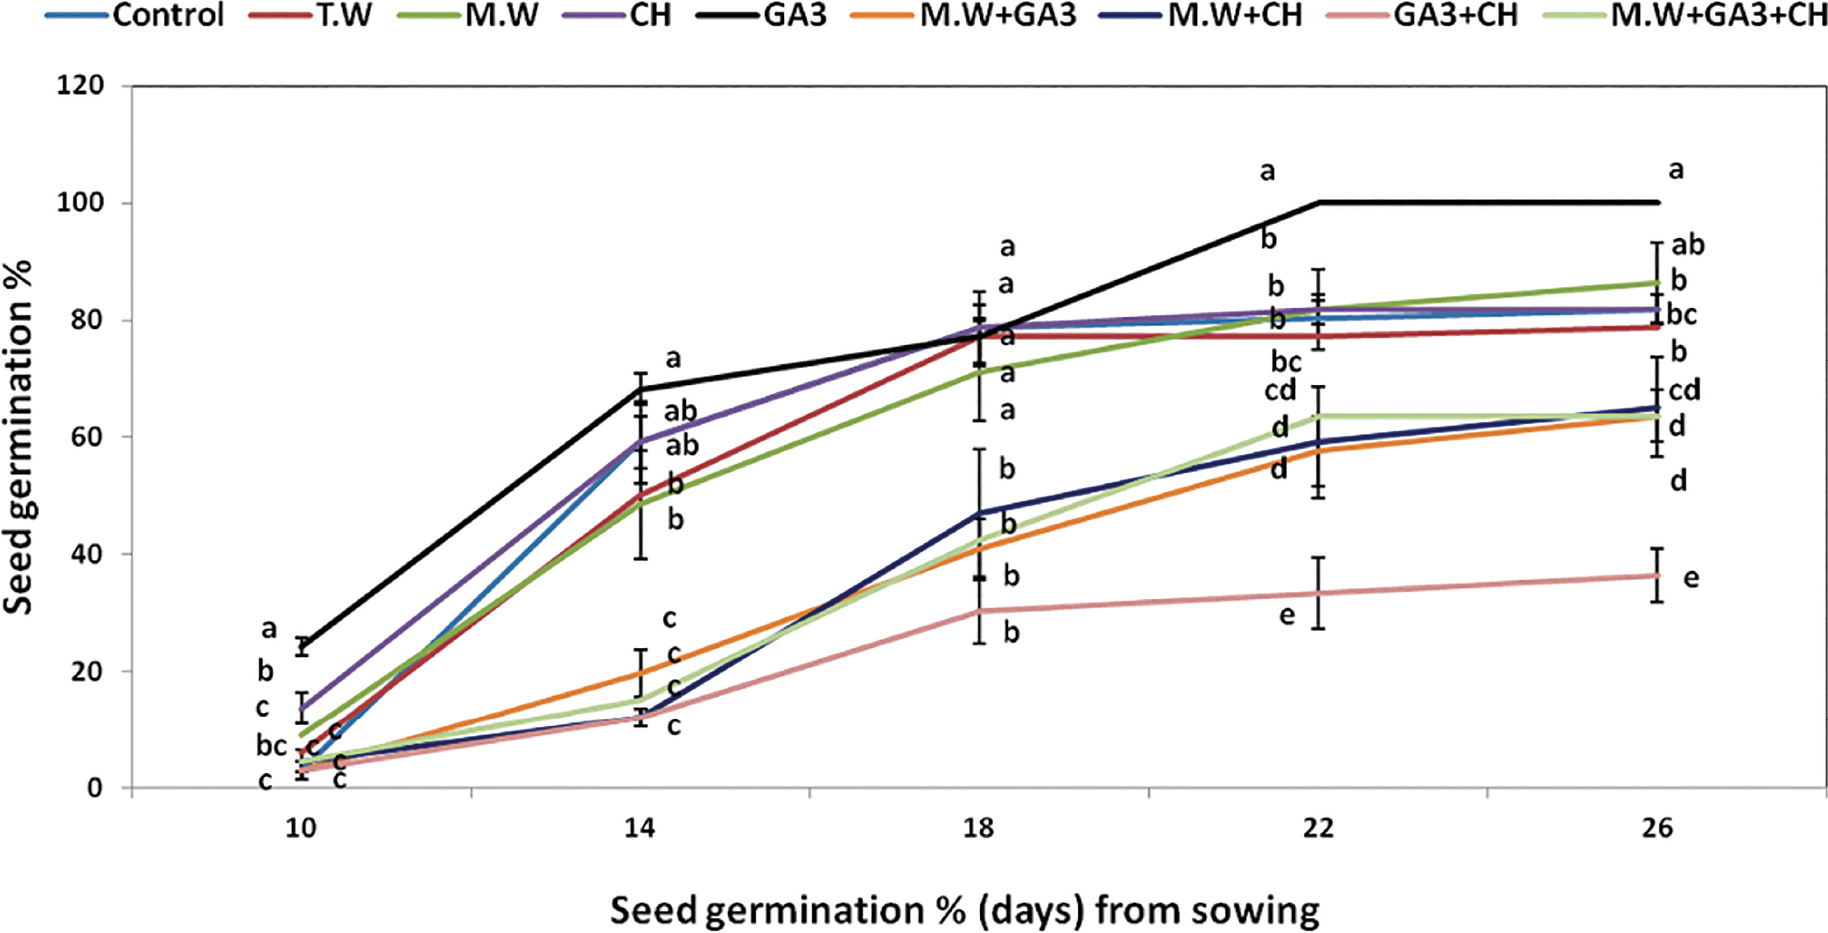
Figure 1.
Effect of papaya seed pre-sowing treatments on seed GP. Data are means of two seasons (2022/2023 and 2023/2024) and three replicates (n = 3) each season. The mean values ± SE of each parameter followed by different alphabetical letters are significantly different according to Duncan’s multiple range test at p ≤ 0.05. Control, dry seeds; T.W, tap water; M.W, magnetic water (2000 Gauss); CH, chitosan (1.5%); GA3, gibberellic acid (1000 ppm); M.W + GA3, magnetic water + gibberellic acid; M.W + CH, magnetic water + chitosan; GA3 + CH, gibberellic acid + chitosan; M.W + GA3 + CH, magnetic water + gibberellic acid + chitosan. GP, germination percentage.
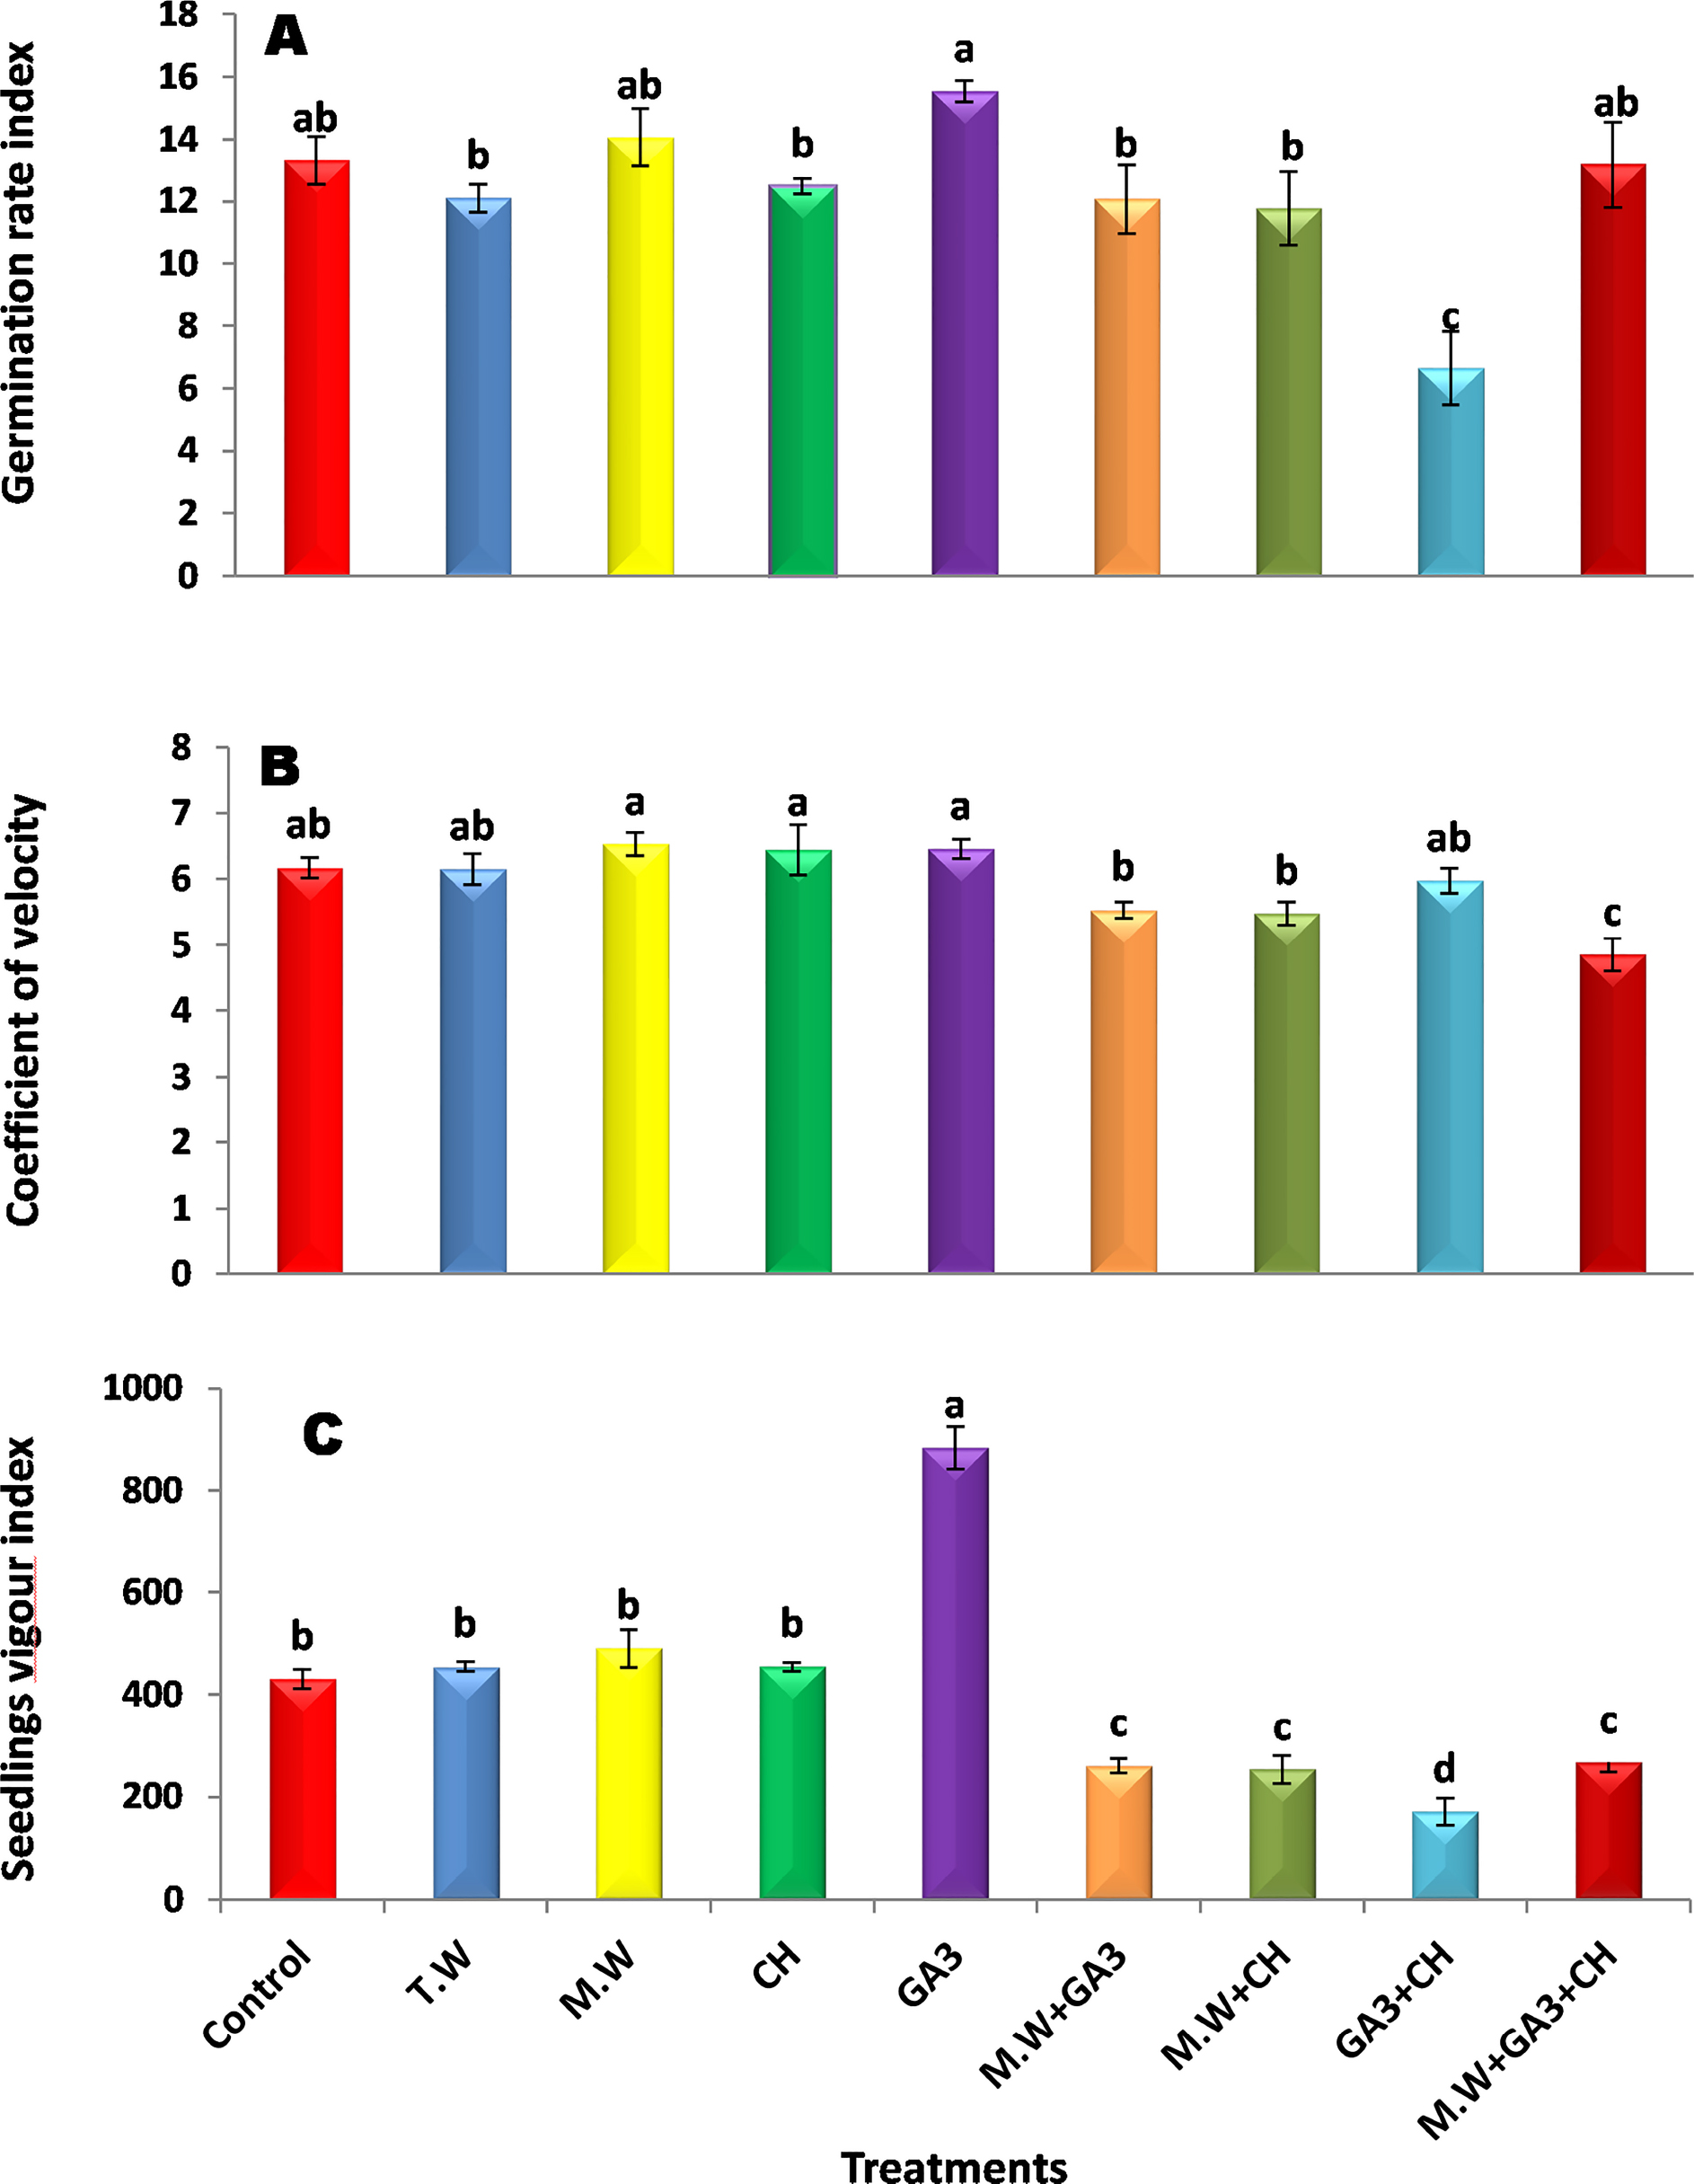
Figure 2.
Effect of papaya seed pre-sowing treatments on germination rate index (A), CV (B) and SVI (C). Data are means of two seasons (2022/2023 and 2023/2024) and three replicates (n = 3) each season. The mean values ± SE of each parameter followed by different alphabetical letters are significantly different according to Duncan’s multiple range test at p ≤ 0.05. Control, dry seeds; T.W, tap water; M.W, magnetic water (2000 Gauss); CH, chitosan (1.5%); GA3, gibberellic acid (1000 ppm); M.W + GA3, magnetic water + gibberellic acid; M.W + CH, magnetic water + chitosan; GA3 + CH, gibberellic acid + chitosan; M.W + GA3 + CH, magnetic water + gibberellic acid + chitosan. CV, coefficient of velocity; GRI, germination rate index; SVI, seedling vigour index.
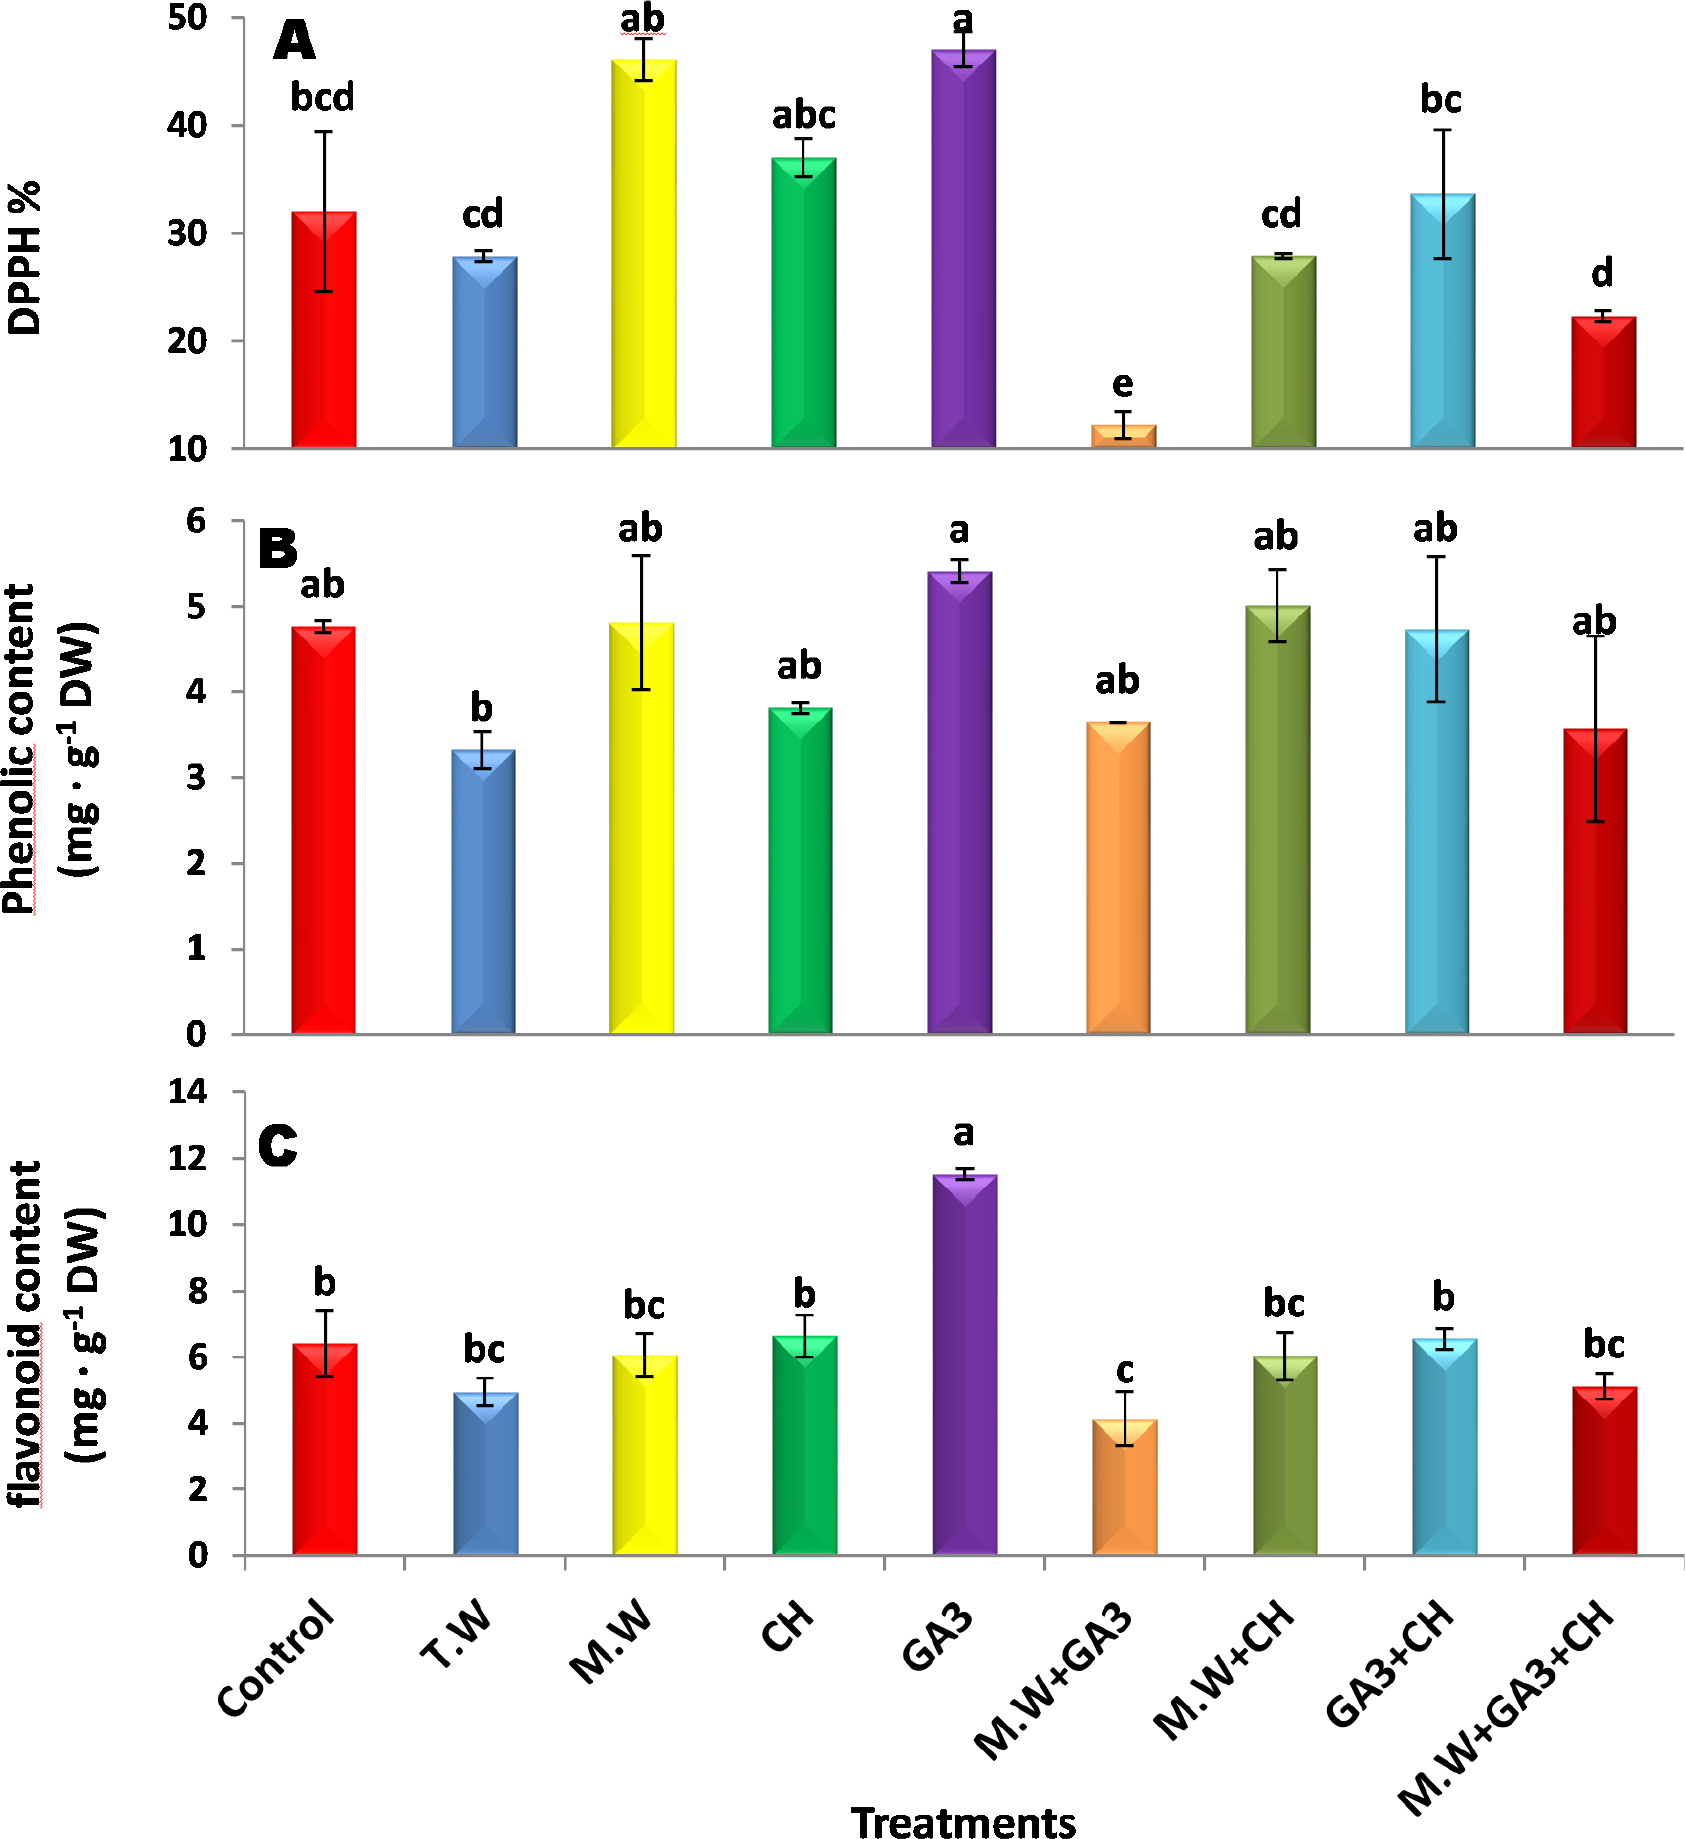
Figure 3.
Effect of papaya seed pre-sowing treatments on seed antioxidant activity (DPPH%) (A), total phenolic content (mg · g−1 DW) (B) and total flavonoid content (mg · g−1 DW) (C). Data are means of two seasons (2022/2023 and 2023/2024) and three replicates (n = 3) each season. The mean values ± SE of each parameter followed by different alphabetical letters are significantly different according to Duncan’s multiple range test at p ≤ 0.05. Control, dry seeds; T.W, tap water; M.W, magnetic water (2000 Gauss); CH, chitosan (1.5%); GA3, gibberellic acid (1000 ppm); M.W + GA3, magnetic water + gibberellic acid; M.W + CH, magnetic water + chitosan; GA3 + CH, gibberellic acid + chitosan; M.W + GA3 + CH, magnetic water + gibberellic acid + chitosan. DPPH, 2,2-diphenyl-1-picrylhydrazyl.
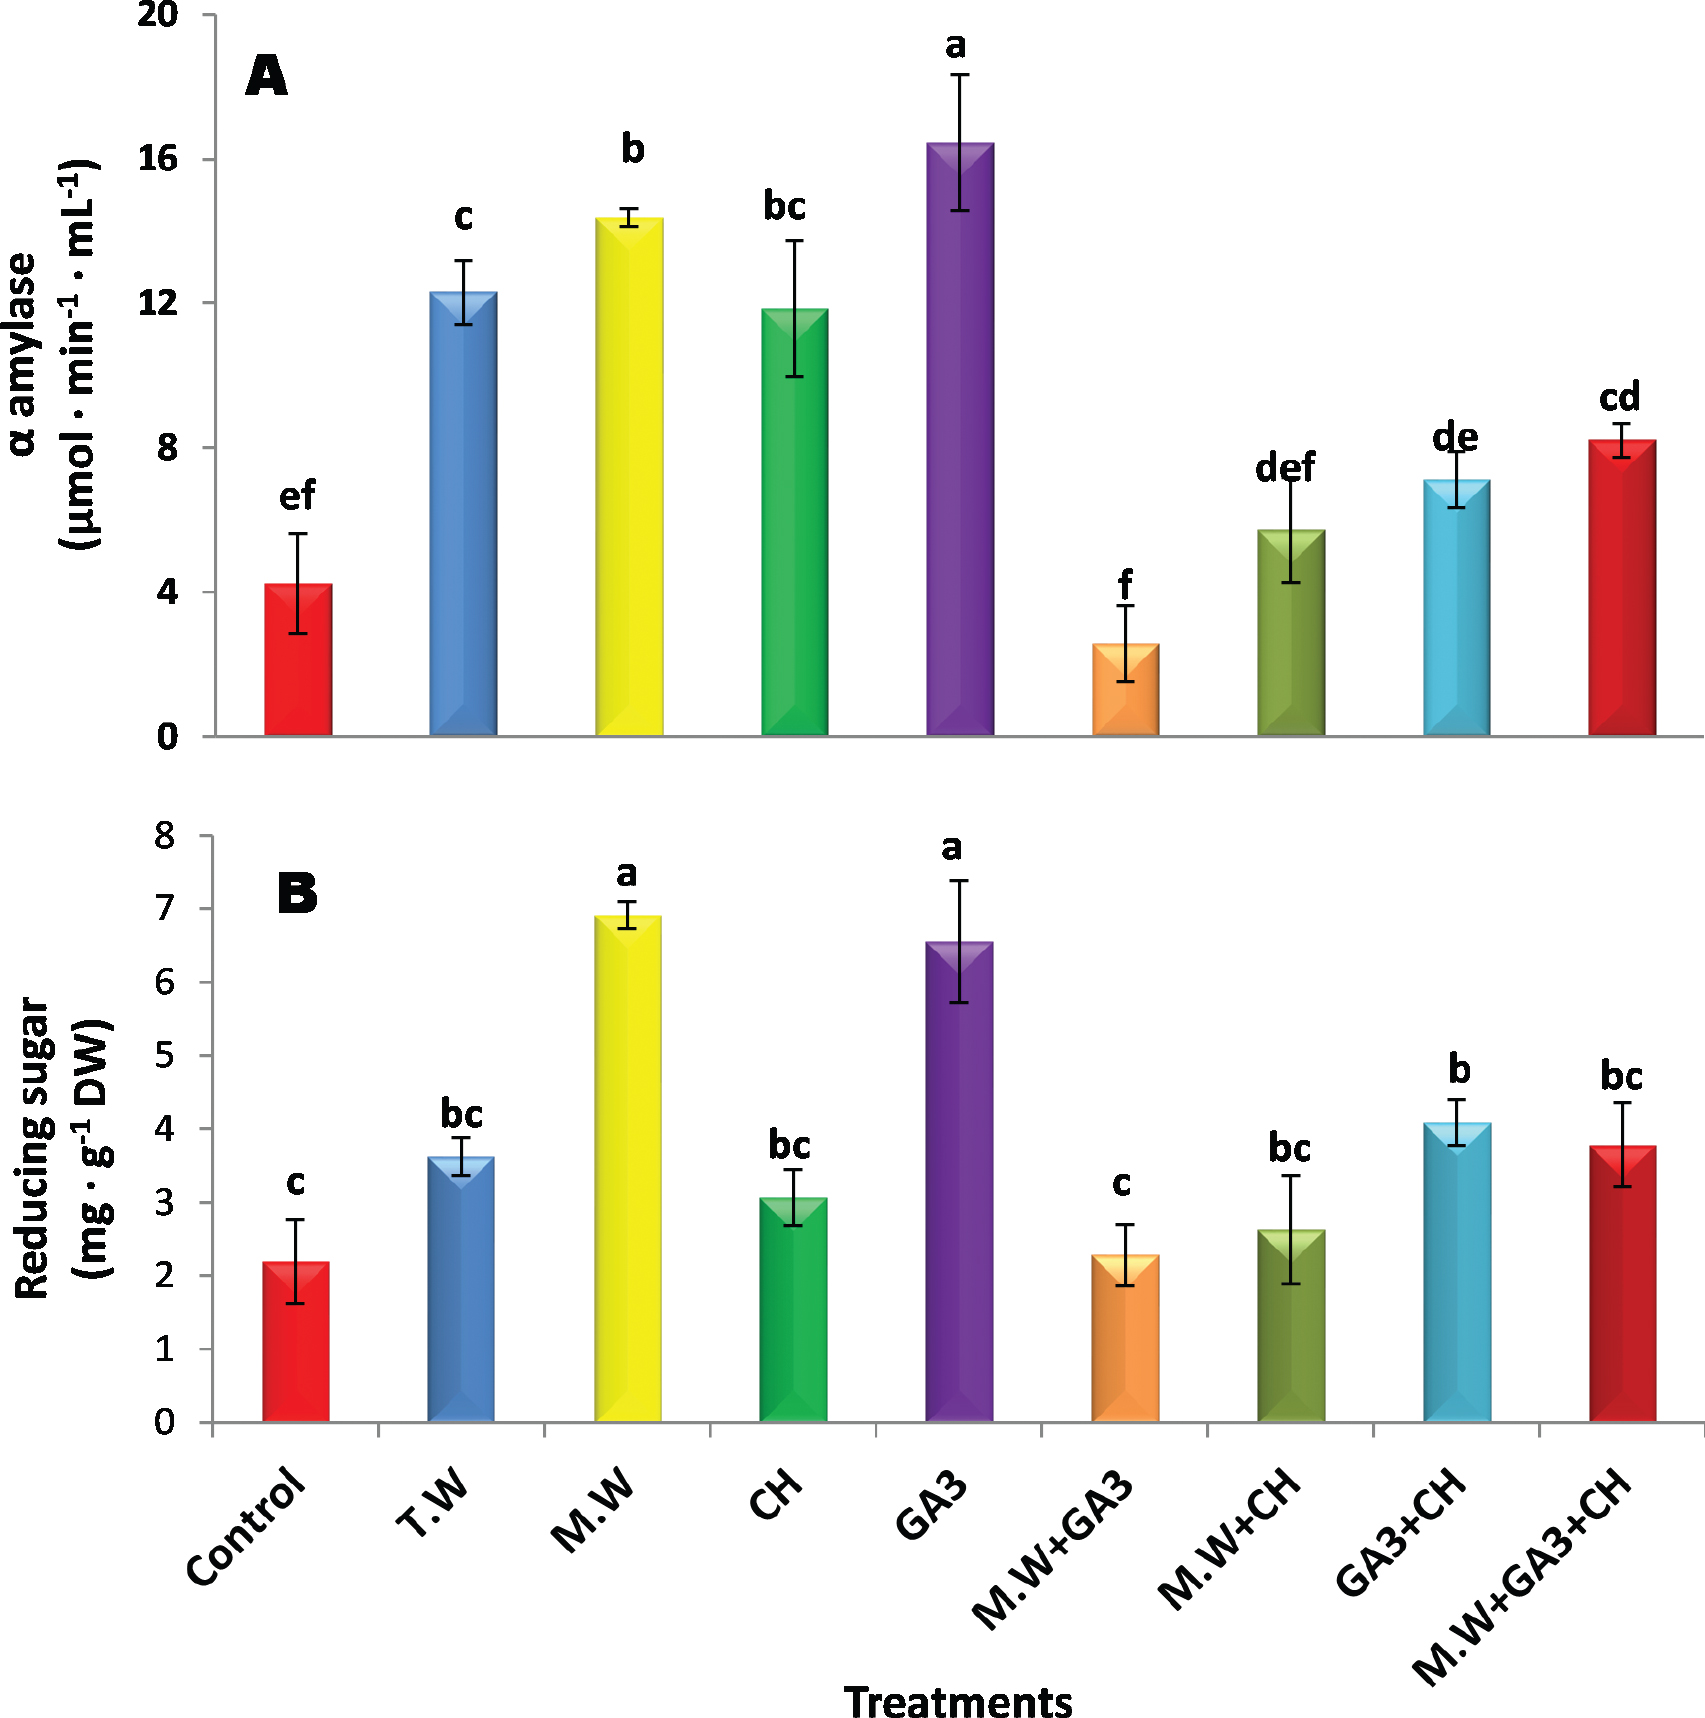
Figure 4.
Effect of papaya seed pre-sowing treatments on α-amylase (μmol · min−1 · mL−1) (A) and RS (mg · g−1 DW) (B). Data are means of two seasons (2022/2023 and 2023/2024) and three replicates (n = 3) each season. The mean values ± SE of each parameter followed by different alphabetical letters are significantly different according to Duncan’s multiple range test at p ≤ 0.05. Control, dry seeds; T.W, tap water; M.W, magnetic water (2000 Gauss); CH, chitosan (1.5%); GA3, gibberellic acid (1000 ppm); M.W + GA3, magnetic water + gibberellic acid; M.W + CH, magnetic water + chitosan; GA3 + CH, gibberellic acid + chitosan; M.W + GA3 + CH, magnetic water + gibberellic acid + chitosan. RS, Reducing sugar.
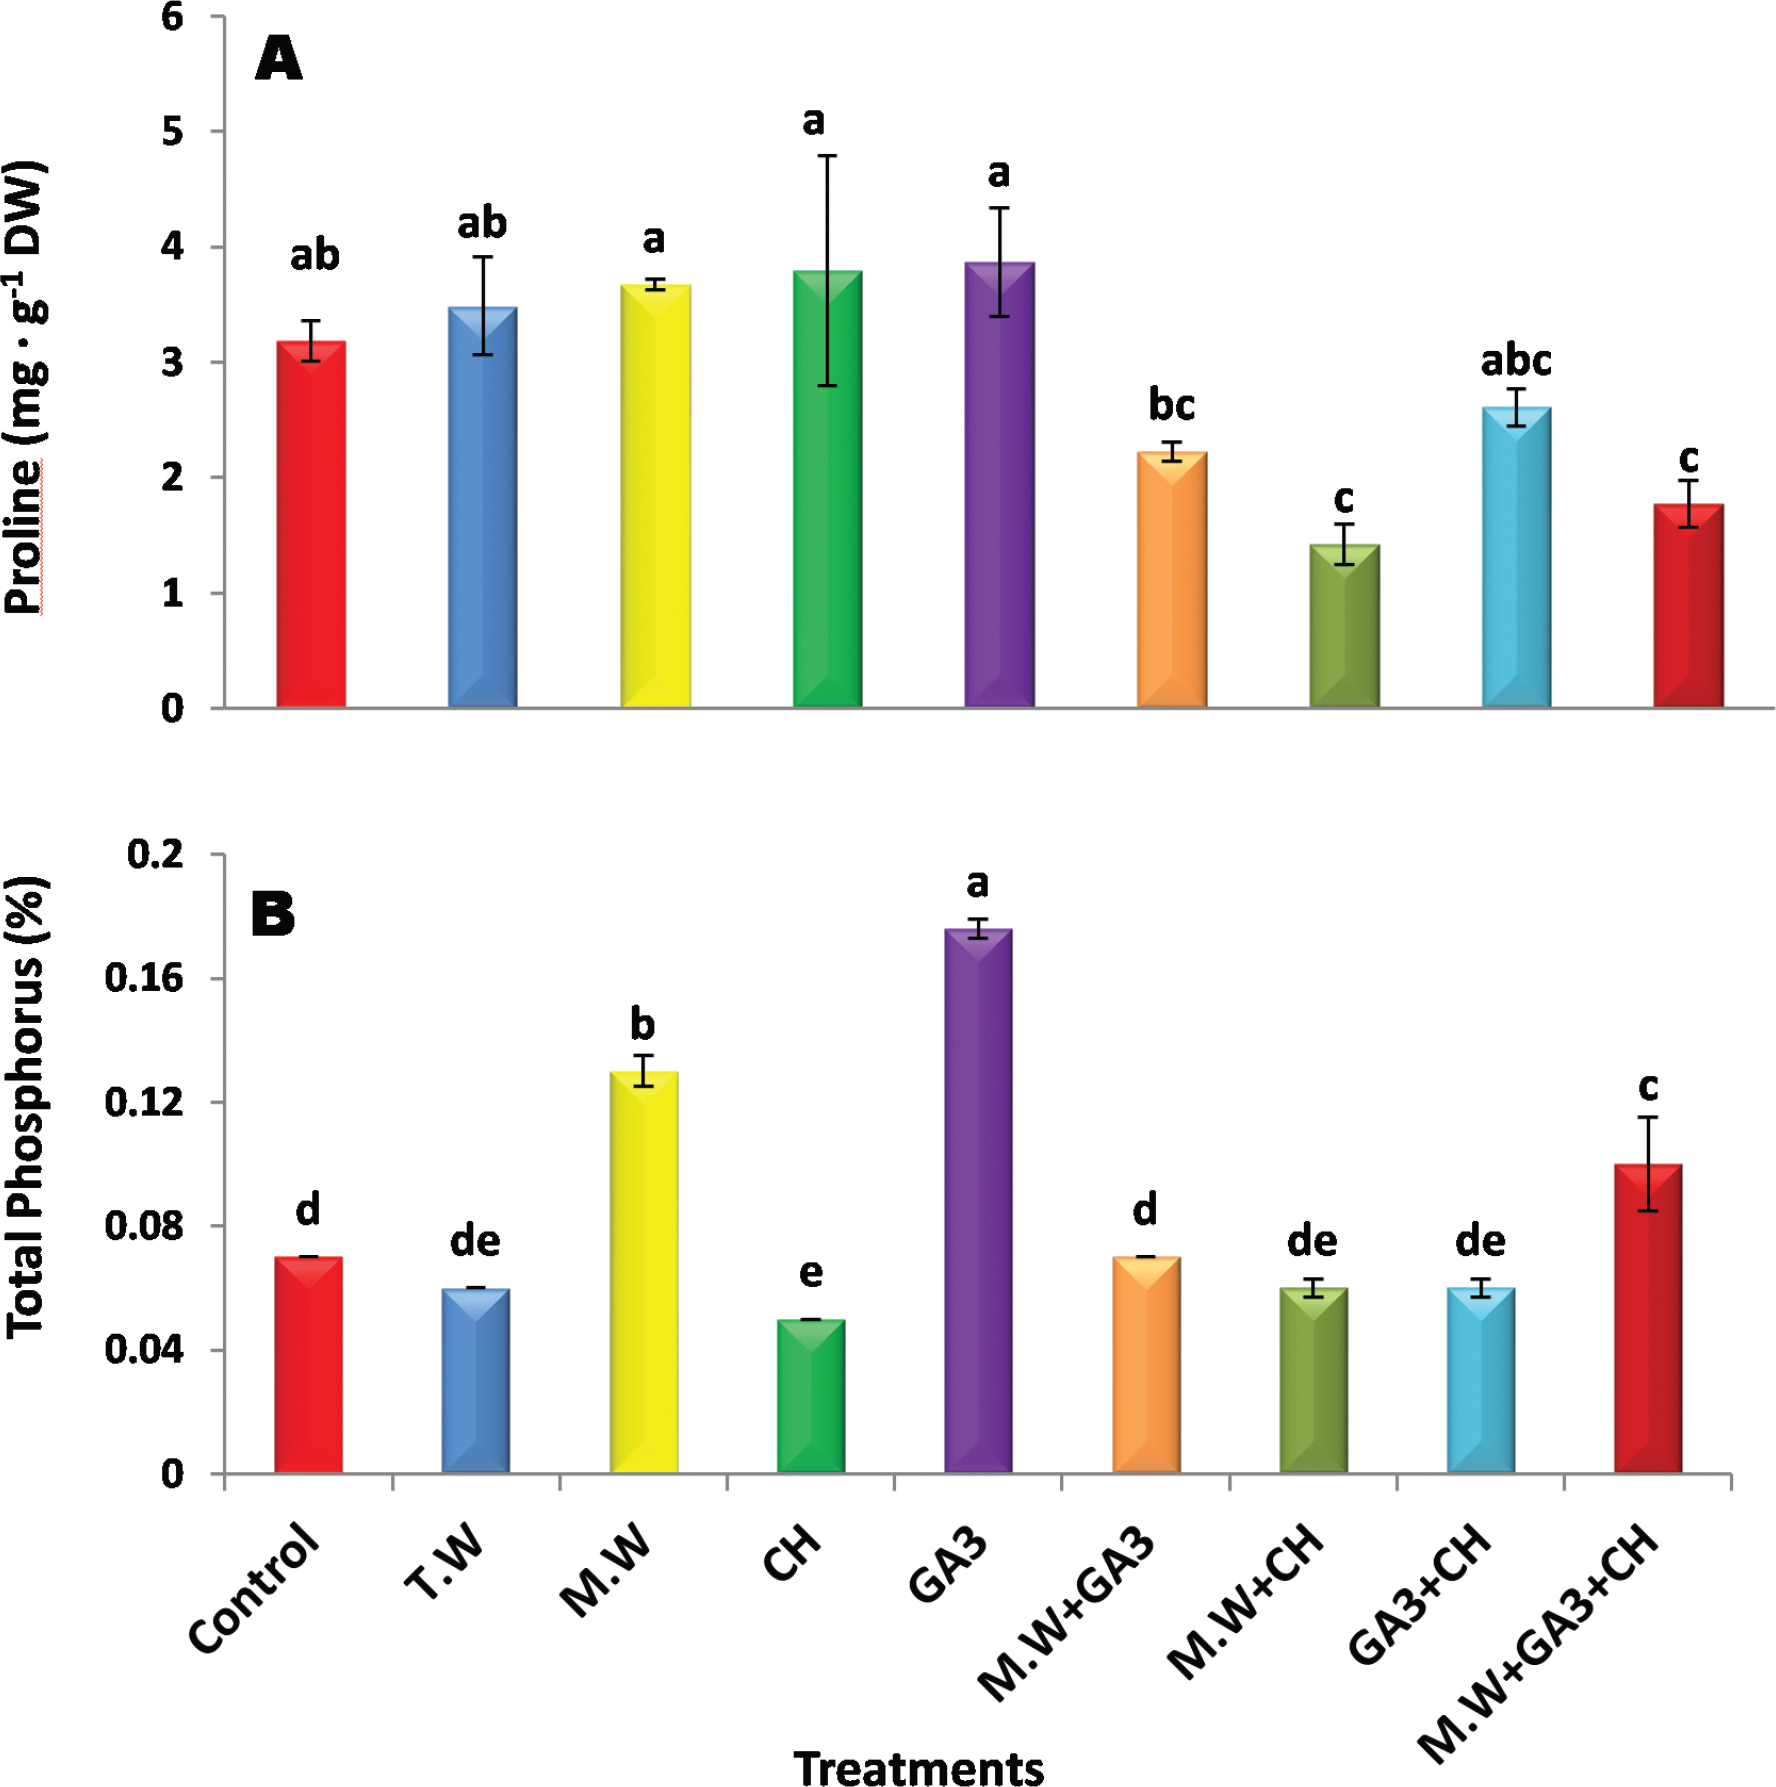
Figure 5.
Effect of papaya seed pre-sowing treatments on proline content (mg · g−1 DW) (A) and total phosphorus (%) (B). Data are means of two seasons (2022/2023 and 2023/2024) and three replicates (n = 3) each season. The mean values ± SE of each parameter followed by different alphabetical letters are significantly different according to Duncan’s multiple range test at p ≤ 0.05. Control, dry seeds; T.W, tap water; M.W, magnetic water (2000 Gauss); CH, chitosan (1.5%); GA3, gibberellic acid (1000 ppm); M.W + GA3, magnetic water + gibberellic acid; M.W + CH, magnetic water + chitosan; GA3 + CH, gibberellic acid + chitosan; M.W + GA3 + CH, magnetic water + gibberellic acid + chitosan.
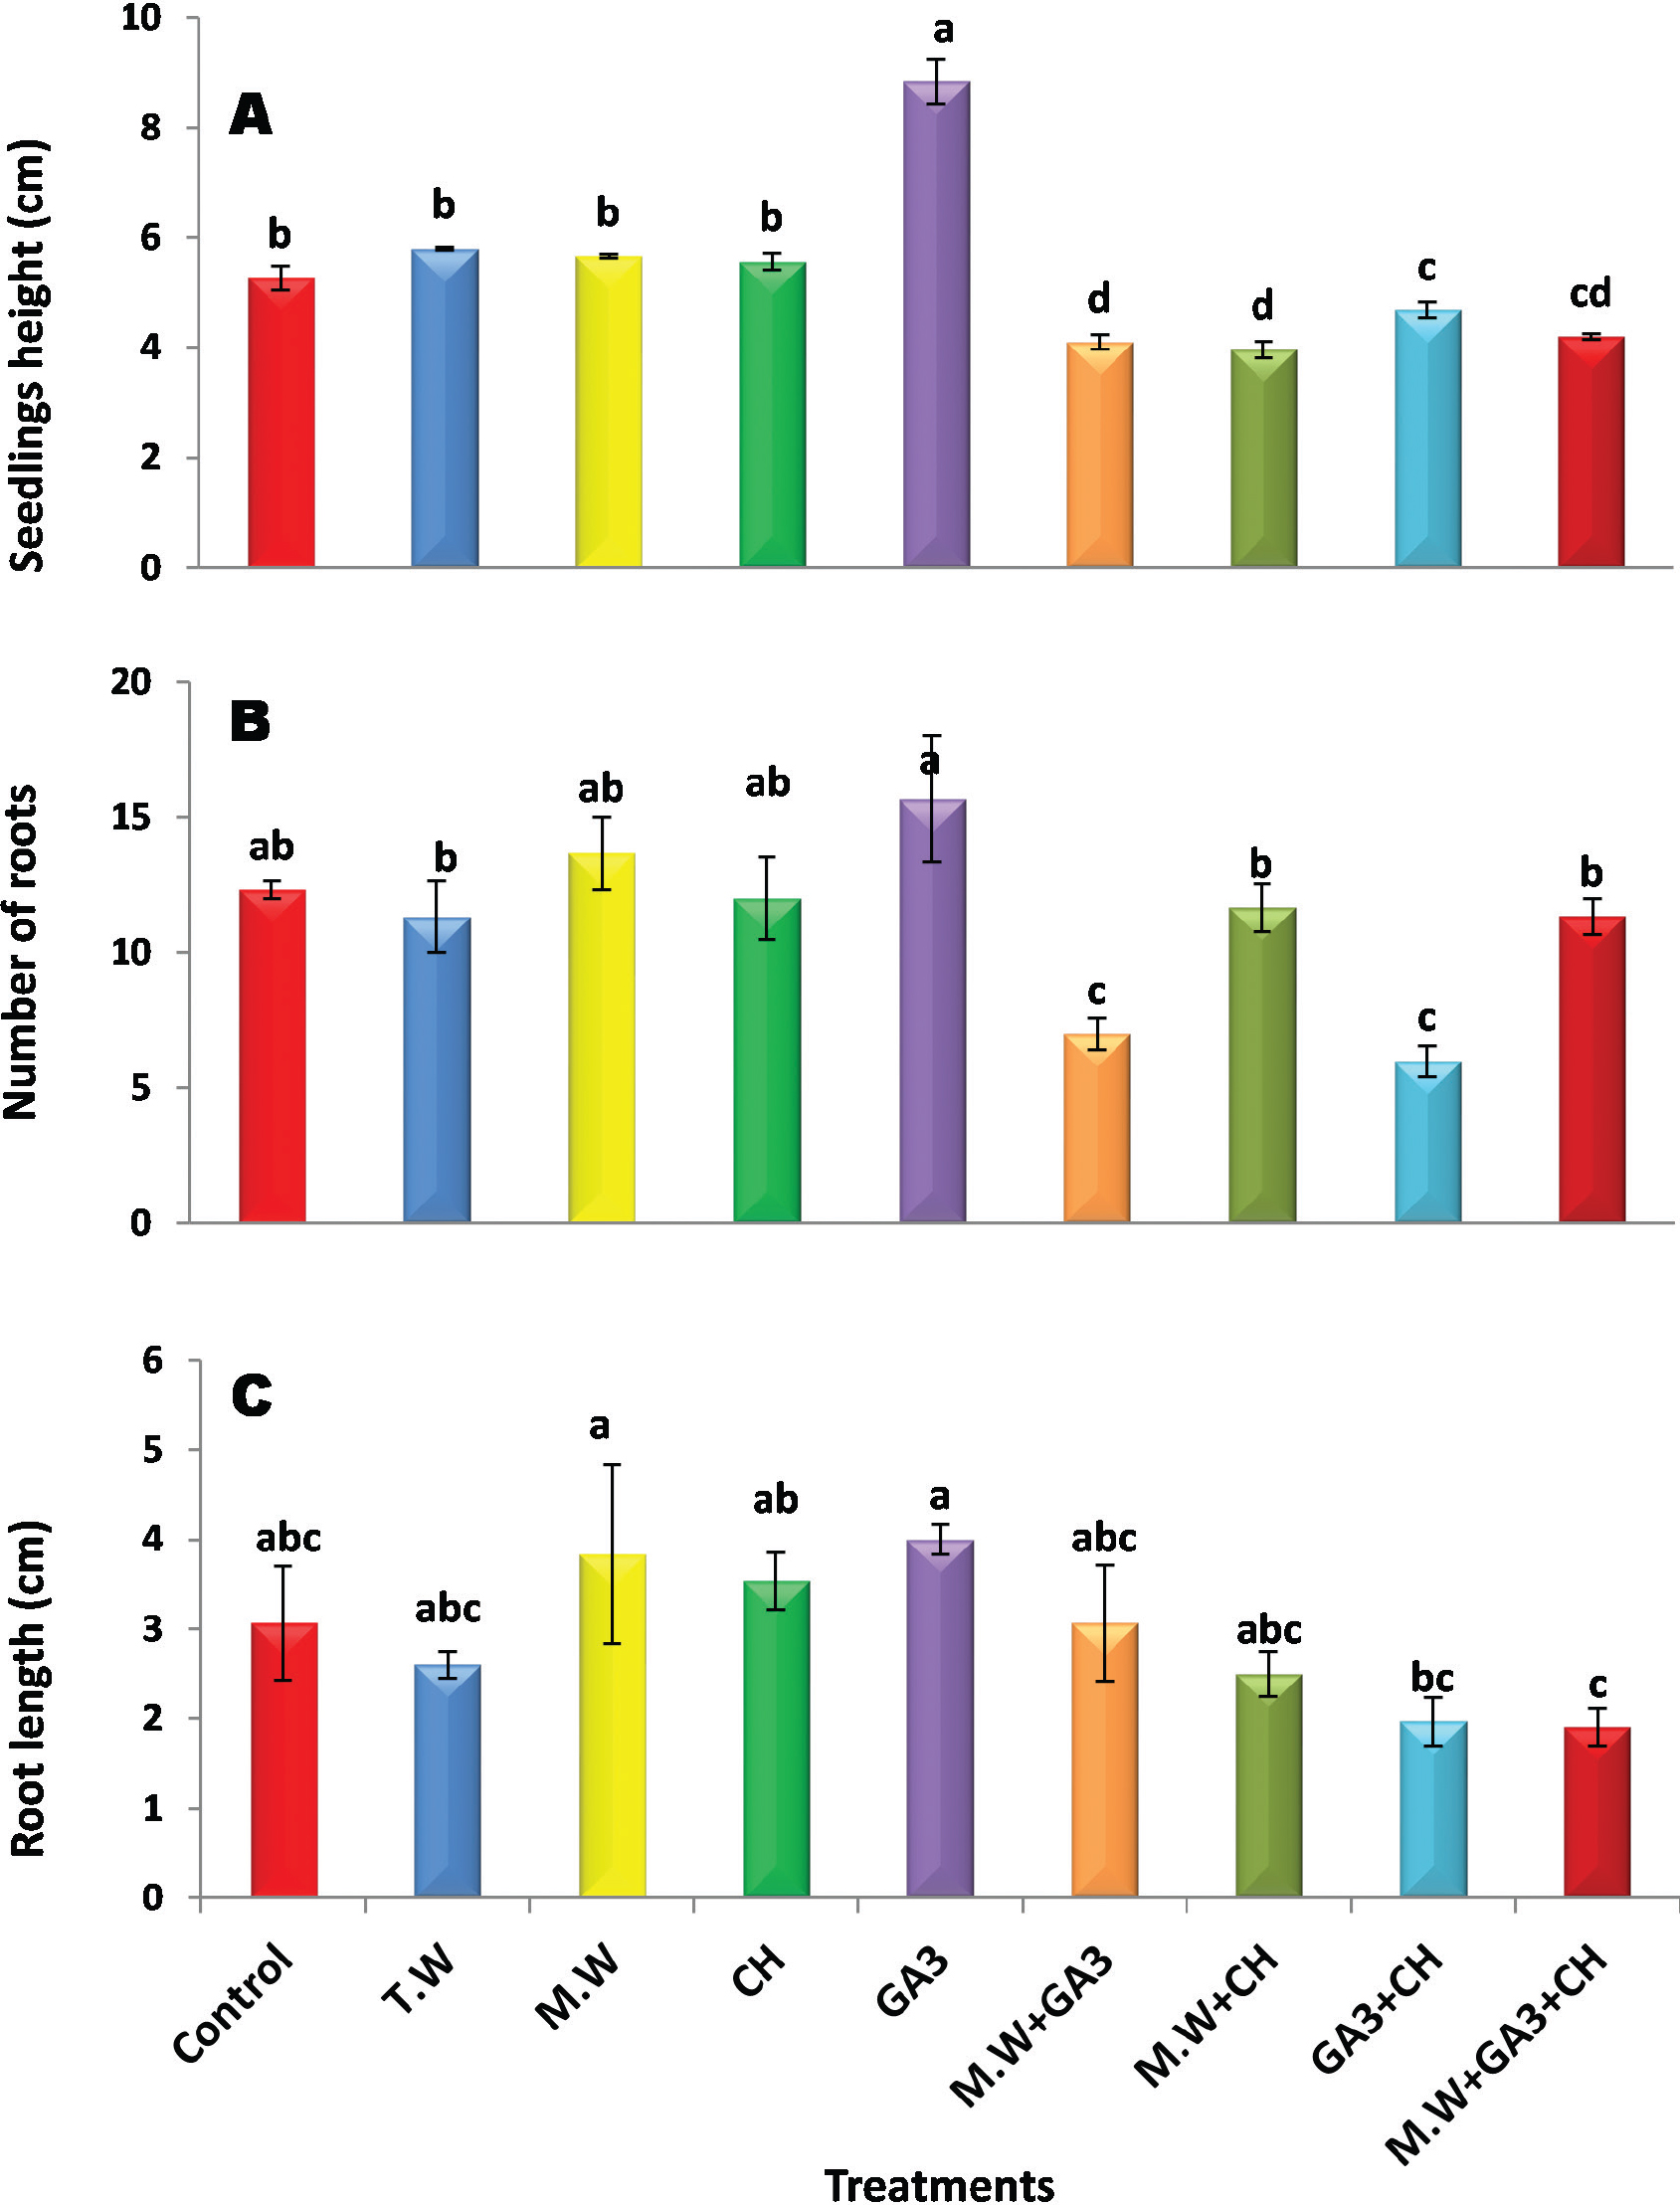
Figure 6.
Effect of papaya seed pre-sowing treatments on seedling height (cm) (A), number of roots (B) and root length (cm) (C). Data are means of two seasons (2022/2023 and 2023/2024) and three replicates (n = 3) each season. The mean values ± SE of each parameter followed by different alphabetical letters are significantly different according to Duncan’s multiple range test at p ≤ 0.05. Control, dry seeds; T.W, tap water; M.W, magnetic water (2000 Gauss); CH, chitosan (1.5%); GA3, gibberellic acid (1000 ppm); M.W + GA3, magnetic water + gibberellic acid; M.W + CH, magnetic water + chitosan; GA3 + CH, gibberellic acid + chitosan; M.W + GA3 + CH, magnetic water + gibberellic acid + chitosan.
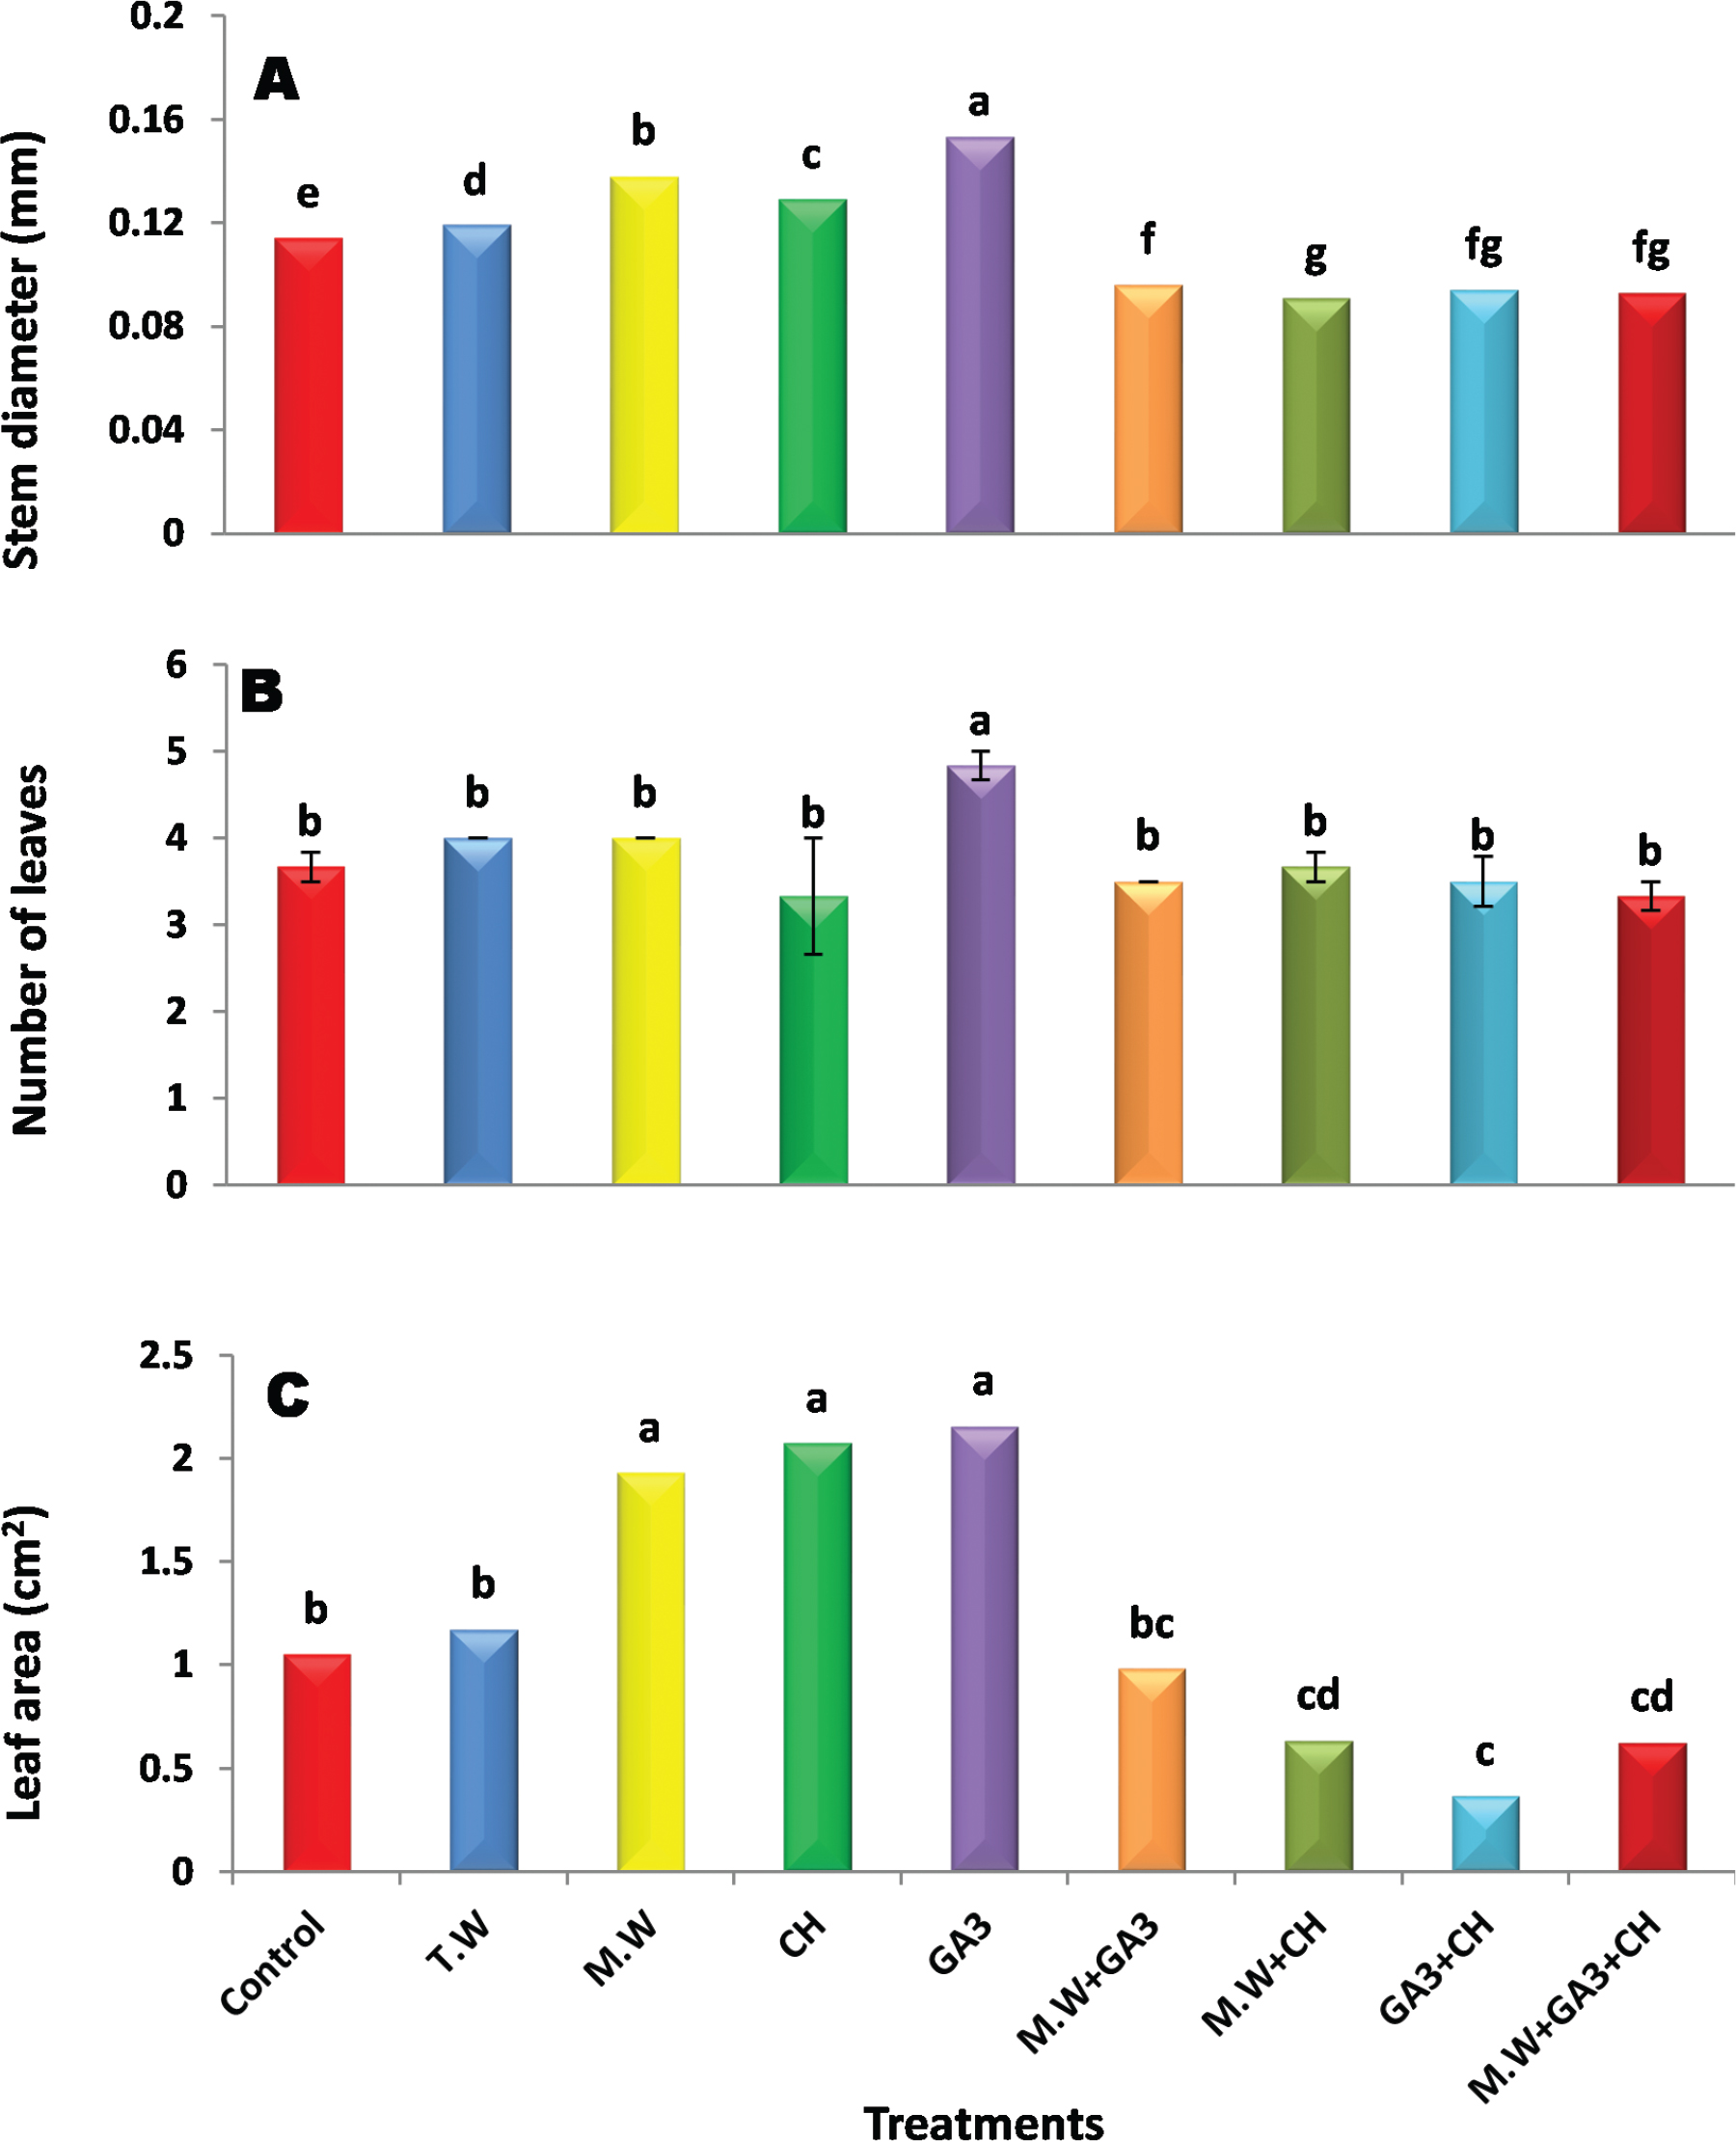
Figure 7.
Effect of papaya seed pre-sowing treatments on stem diameter (A), number of leaves (B) and leaf area (cm2) (C). Data are means of two seasons (2022/2023 and 2023/2024) and three replicates (n = 3) each season. The mean values ± SE of each parameter followed by different alphabetical letters are significantly different according to Duncan’s multiple range test at p ≤ 0.05. Control, dry seeds; T.W, tap water; M.W, magnetic water (2000 Gauss); CH, chitosan (1.5%); GA3, gibberellic acid (1000 ppm); M.W + GA3, magnetic water + gibberellic acid; M.W + CH, magnetic water + chitosan; GA3 + CH, gibberellic acid + chitosan; M.W + GA3 + CH, magnetic water + gibberellic acid + chitosan.
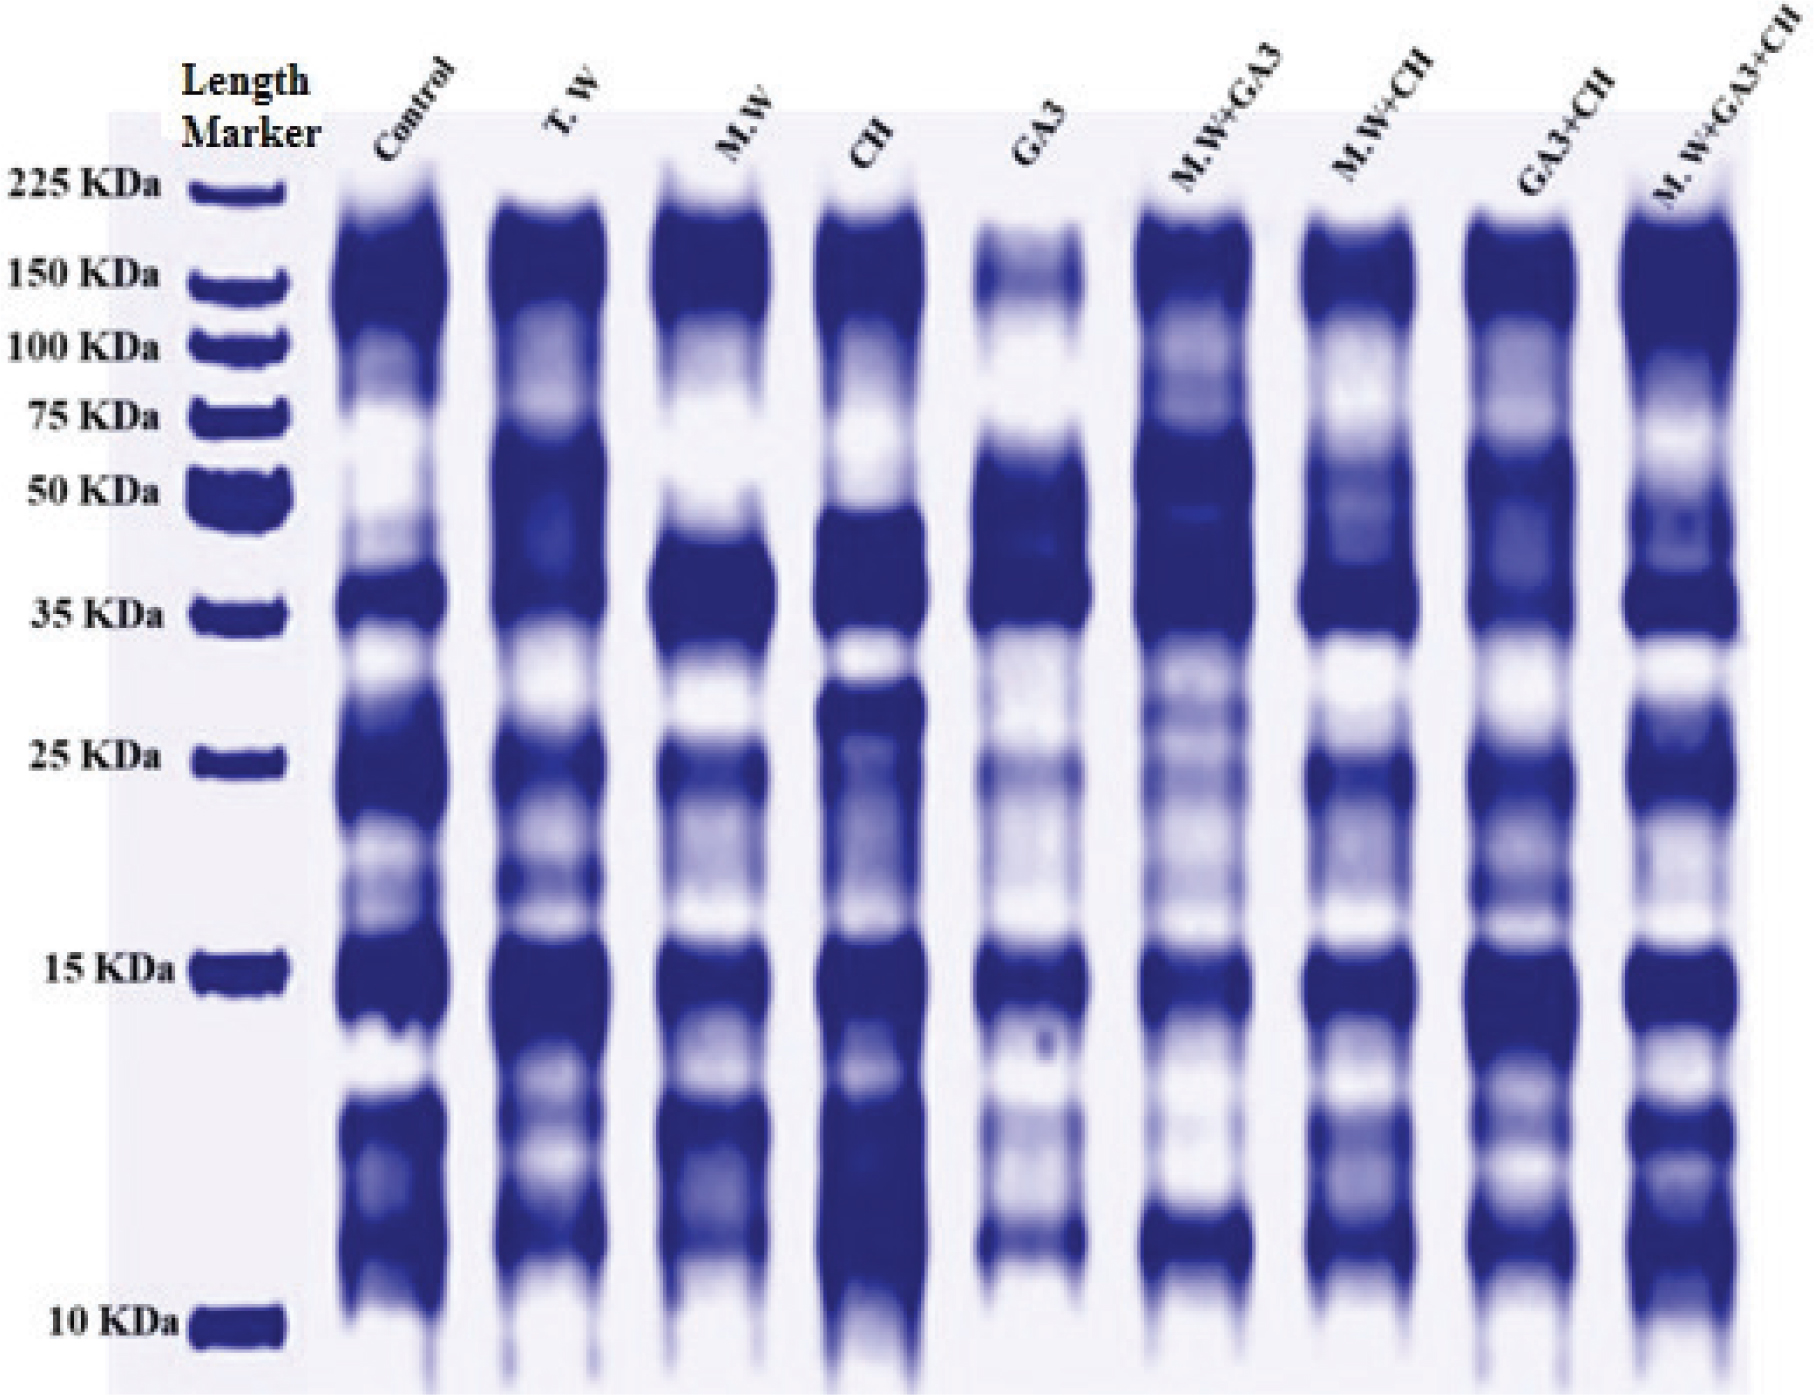
Figure 8.
Electrophotograph generated by SDS-PAGE analysis of protein-banding pattern of untreated and submerged papaya seeds in magnetic water (2000 Gauss), M.W; chitosan (1.5%), CH and gibberellic acid (1000 ppm), GA3 separately or in combination. M, marker; Control, dry seeds; T.W, tap water; M.W, magnetic water (2000 Gauss); CH, chitosan (1.5%); GA3, gibberellic acid (1000 ppm); M.W + GA3, magnetic water + gibberellic acid; M.W + CH, magnetic water + chitosan; GA3 + CH, gibberellic acid + chitosan; M.W + GA3 + CH, magnetic water + gibberellic acid + chitosan; K. Da, Kilo Dalton; SDS-PAGE, sodium dodecyl sulphate polyacrylamide gel electrophoresis.
Table 2.
SDS-PAGE analysis of protein-banding patterns of untreated and submerged papaya seeds in tap water; T.W, magnetic water (2000 Gauss); M.W, chitosan (1.5%); CH, gibberellic acid (1000 ppm); GA3 solutions separately or in combination; %P, % polymorphism.
| No. | Molecular weight (kDa) | Control | Treatments | Band type | |||||||
|---|---|---|---|---|---|---|---|---|---|---|---|
| T.W | M.W | CH | GA3 | MW + ga3 | GA3 + CH | MW + CH | MW + GA3 + CH | ||||
| 1 | 200.20 | 1 | 1 | 0 | 0 | 0 | 0 | 0 | 0 | 0 | P |
| 2 | 178.12 | 1 | 0 | 1 | 1 | 1 | 1 | 1 | 1 | 1 | P[NUM-2] |
| 3 | 171.50 | 0 | 0 | 0 | 0 | 0 | 0 | 0 | 0 | 1 | P[PUM-9] |
| 4 | 151.72 | 1 | 1 | 1 | 1 | 1 | 1 | 1 | 1 | 1 | M80 |
| 5 | 102.25 | 0 | 0 | 0 | 0 | 0 | 0 | 0 | 0 | 1 | P[PUM-9] |
| 6 | 65.42 | 0 | 1 | 0 | 0 | 0 | 1 | 0 | 0 | 0 | P |
| 7 | 56.02 | 0 | 1 | 0 | 0 | 0 | 1 | 1 | 1 | 0 | P |
| 8 | 50.85 | 0 | 0 | 0 | 0 | 1 | 0 | 0 | 0 | 0 | P[PUM-5] |
| 9 | 46.92 | 0 | 0 | 0 | 0 | 1 | 0 | 0 | 0 | 0 | P[PUM-5] |
| 10 | 43.73 | 1 | 0 | 0 | 1 | 0 | 0 | 0 | 0 | 1 | P |
| 11 | 38.87 | 0 | 0 | 1 | 1 | 1 | 1 | 0 | 0 | 0 | P |
| 12 | 36.64 | 0 | 1 | 1 | 1 | 1 | 0 | 1 | 0 | 0 | P |
| 13 | 35.60 | 1 | 0 | 0 | 0 | 0 | 1 | 1 | 1 | 1 | P |
| 14 | 33.42 | 0 | 0 | 1 | 0 | 0 | 0 | 0 | 0 | 0 | P[PUM-3] |
| 15 | 27.73 | 0 | 0 | 0 | 1 | 0 | 1 | 0 | 0 | 0 | P |
| 16 | 26.87 | 1 | 0 | 0 | 0 | 0 | 0 | 0 | 0 | 0 | P[PUM-C] |
| 17 | 25.20 | 1 | 0 | 0 | 0 | 0 | 0 | 0 | 0 | 0 | P[PUM-C] |
| 18 | 24.13 | 1 | 1 | 1 | 1 | 1 | 0 | 1 | 1 | 1 | P[NUM-6] |
| 19 | 23.22 | 0 | 0 | 0 | 0 | 0 | 1 | 0 | 0 | 1 | P |
| 20 | 19.46 | 0 | 0 | 0 | 0 | 1 | 0 | 0 | 0 | 0 | P[PUM-5] |
| 21 | 18.82 | 1 | 1 | 0 | 0 | 0 | 0 | 0 | 0 | 0 | P |
| 22 | 18.19 | 0 | 0 | 0 | 0 | 0 | 1 | 0 | 1 | 0 | P |
| 23 | 15.23 | 1 | 0 | 0 | 0 | 0 | 1 | 0 | 0 | 1 | P |
| 24 | 14.57 | 1 | 1 | 1 | 1 | 1 | 1 | 1 | 0 | 1 | P[NUM-8] |
| 25 | 14.16 | 0 | 0 | 0 | 0 | 0 | 0 | 0 | 1 | 0 | P[PUM-8] |
| 26 | 13.65 | 0 | 1 | 0 | 0 | 0 | 0 | 0 | 1 | 0 | P |
| 27 | 11.54 | 1 | 1 | 1 | 1 | 1 | 0 | 1 | 1 | 1 | P[NUM-6] |
| 28 | 10.93 | 0 | 0 | 0 | 1 | 0 | 0 | 0 | 0 | 0 | P[PUM-4] |
| 29 | 10.58 | 0 | 0 | 0 | 1 | 0 | 0 | 0 | 0 | 0 | P[PUM-4] |
| 30 | 10.46 | 1 | 1 | 1 | 1 | 1 | 1 | 1 | 1 | 1 | M |
| 31 | 10.35 | 1 | 0 | 0 | 0 | 0 | 0 | 0 | 0 | 0 | P[PUM-C] |
| 32 | 10.24 | 0 | 0 | 0 | 0 | 0 | 0 | 0 | 0 | 1 | P[PUM-9] |
| Total bands of each sample | 14 | 11 | 9 | 12 | 11 | 12 | 9 | 10 | 13 | Gel polymorphism % = 93.75% | |
| P% in each sample | 85.71 | 81.81 | 77.78 | 83.33 | 81.82 | 83.33 | 77.78 | 80.00 | 84.62 | ||
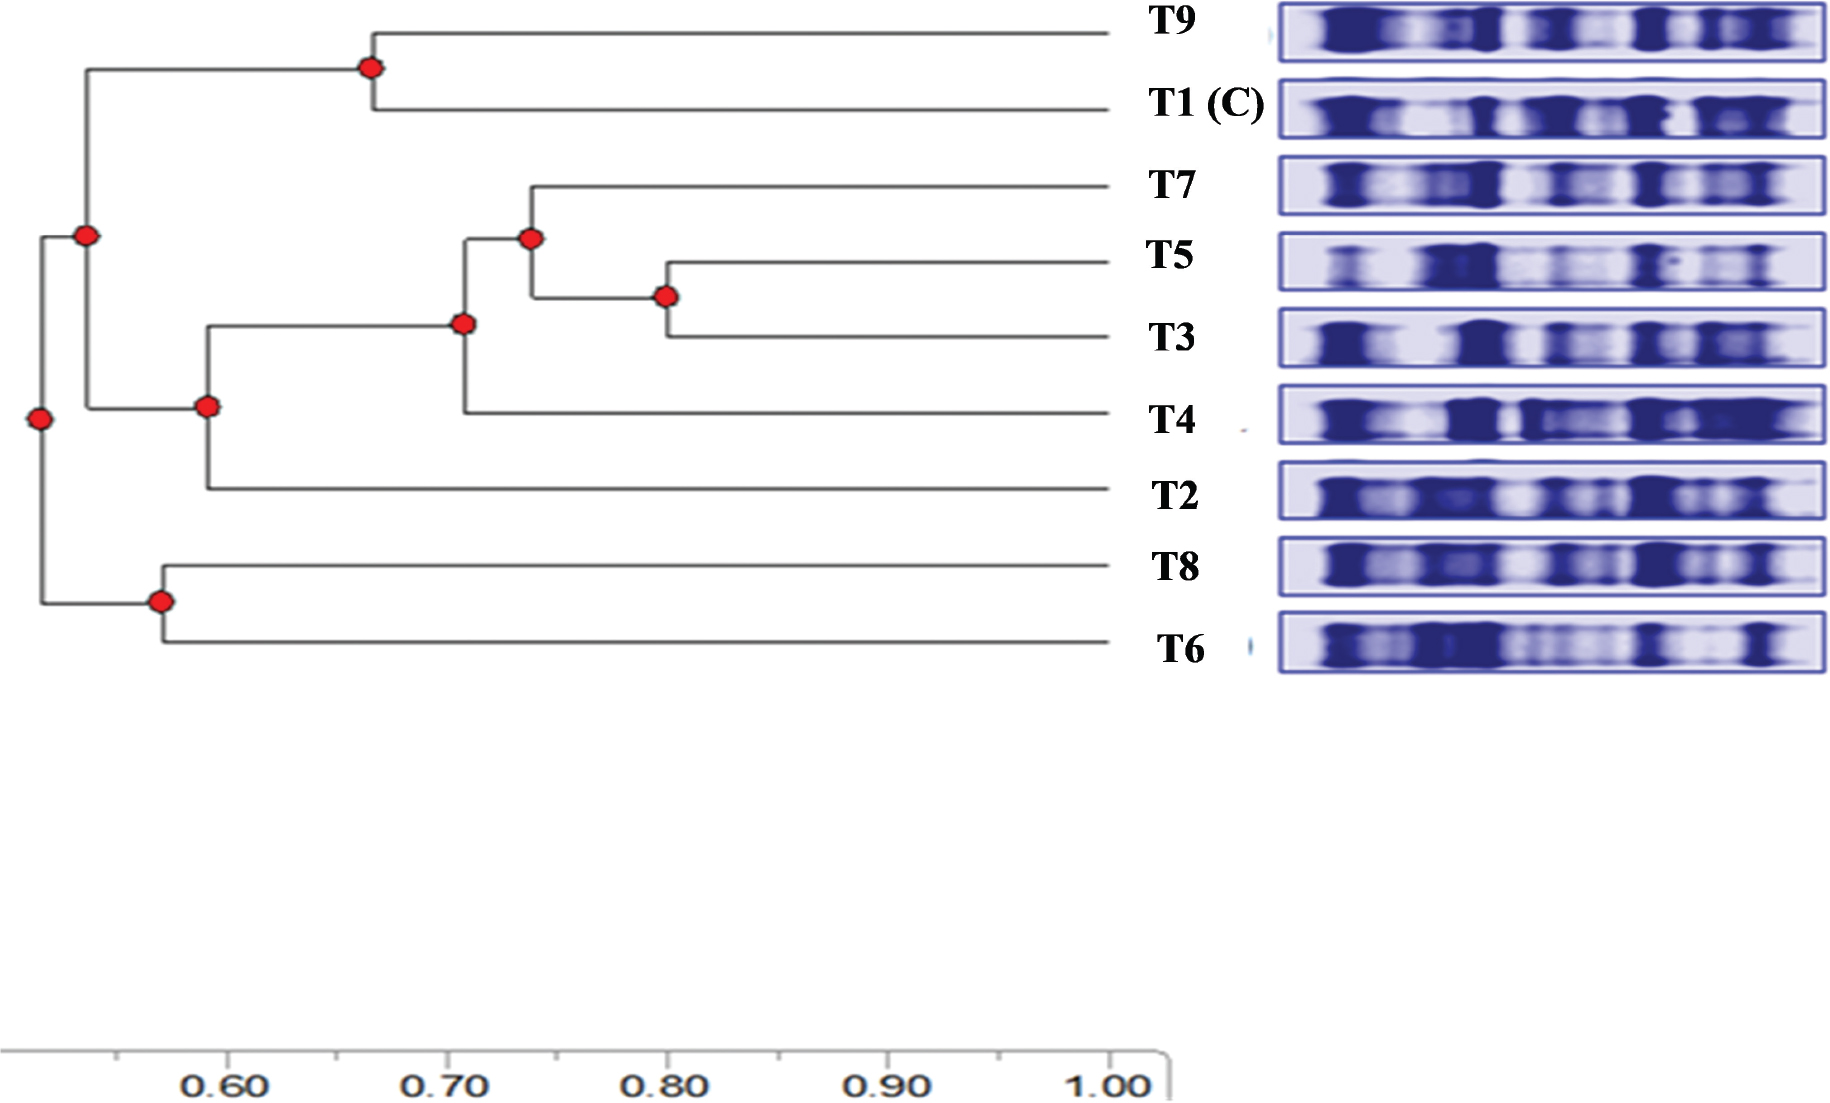
Figure 9.
Dendrogram derived from separate evaluation of SDS-PAGE protein profiles of eight treated and untreated papaya seeds constructed data using UPGMA and similarity matrices computed according to Dice coefficient. T1 (C), Control (dry seeds); T2, tap water (T.W); T3, magnetic water (M.W, 2000 Gauss); T4, chitosan (CH, 1.5%); T5, gibberellic acid (GA3, 1000 ppm); T6, M.W (2000 Gauss) + GA3 (1000 ppm); T7, M.W (2000 Gauss) + CH (1.5%); T8, GA3 (1000 ppm) + CH (1.5%); T9, M.W (2000 Gauss) + GA3 (1000 ppm) + CH (1.5%). SDS-PAGE, sodium dodecyl sulphate polyacrylamide gel electrophoresis; UPGMA, unweighted pair-group method with arithmetic averages.
Table 3.
Number of DS and S bands recorded by separate evaluation of protein profiles of treated and untreated papaya seeds and their genetic similarity indices as computed according to Dice coefficient.
| Treatments | Control | T.W | M.W | CH | GA3 | M.W + GA3 | GA3 + CH | M.W + CH | M.W + GA3 + CH |
|---|---|---|---|---|---|---|---|---|---|
| Control | 100%0DS,32S | 80%11DS,21S | 80%11DS,21S | 77%12DS,20S | 75%13DS,19S | 72%14DS,18S | 84%9DS,23S | 77%12DS,20S | 849DS,23S |
| T.W | 100%0DS,32S | 868DS,24S | 79%11DS,21S | 81%10DS,22S | 75%13DS,19S | 90%26DS,6S | 84%9DS,23S | 75%13DS,19S | |
| M.W | 1000DS,32S | 92%5DS,27S | 93%4DS,22S | 80%11DS,21S | 93%4DS,28S | 84%9DS,23S | 82%10DS,22S | ||
| CH | 100%0DS,32S | 88%7DS,25S | 77%12DS,20S | 88%7DS,25S | 77%12DS,20S | 79%11DS,21S | |||
| GA3 | 100%0DS,32S | 75%13DS,19S | 90%6DS,26S | 79%11DS,21S | 77%12DS,20S | ||||
| M.W + GA3 | 100%0DS,32S | 84%9DS,23S | 86%8DS,24S | 79%11DS,21S | |||||
| GA3 + CH | 100%0DS,32S | 92%5DS,27S | 86%8DS,24S | ||||||
| M.W + CH | 100%0DS,32S | 80%11DS,21S | |||||||
| M.W + GA3 + CH | 100%0DS,32S |
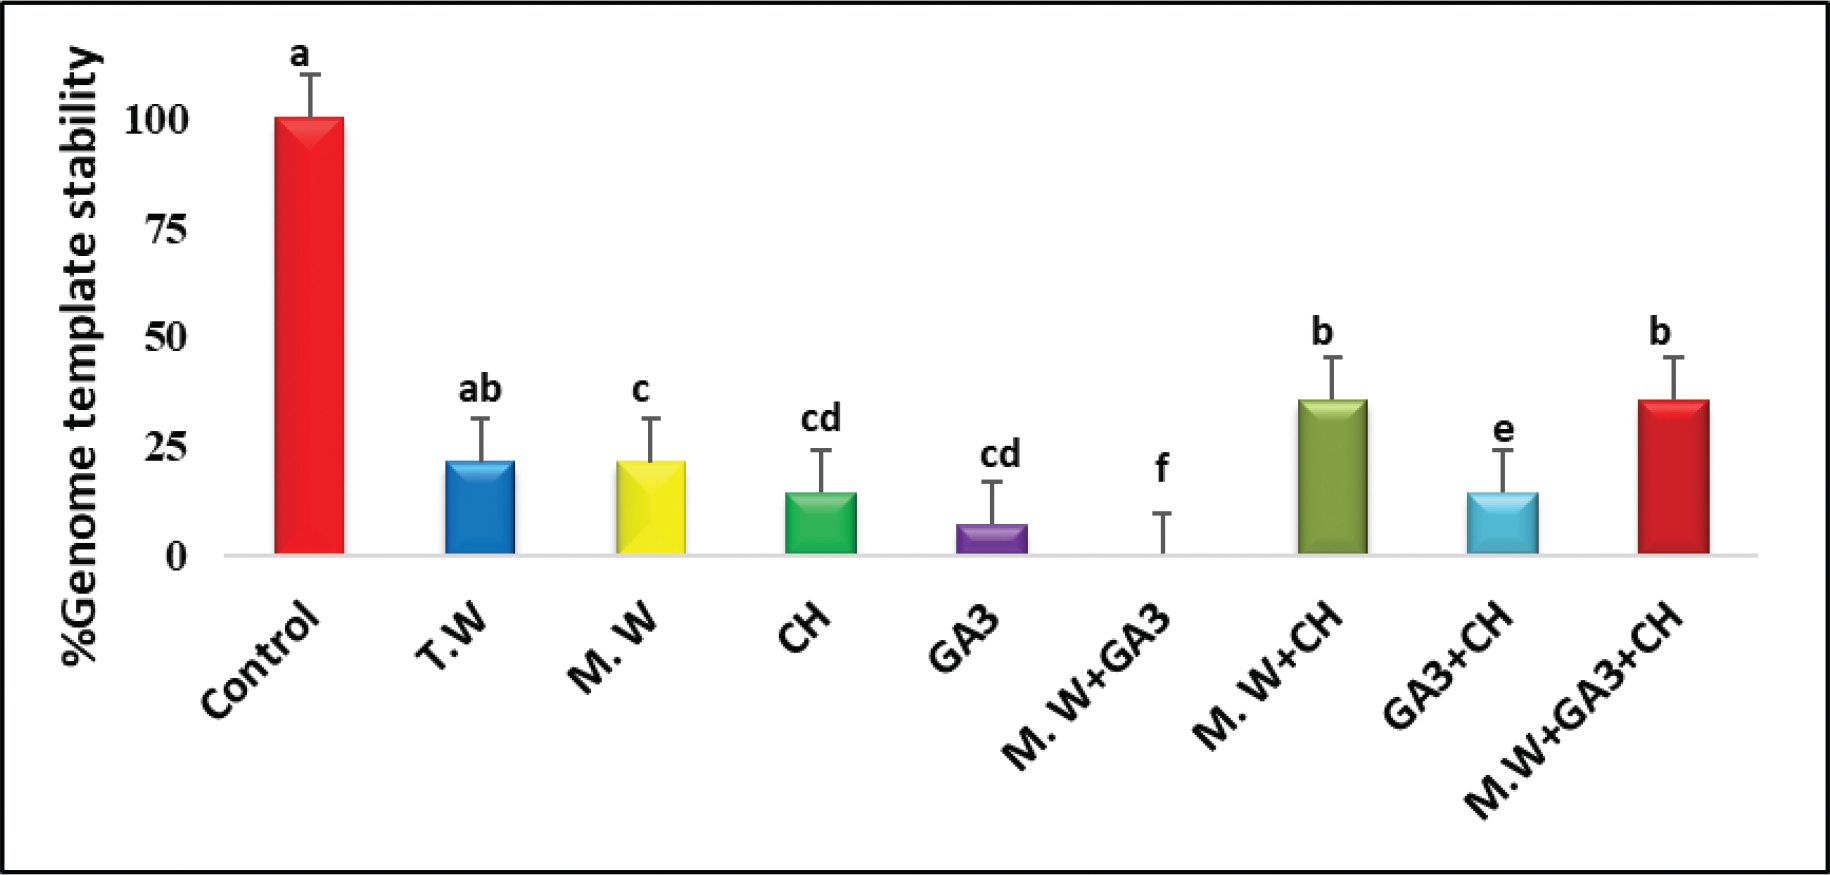
Figure 10.
GTS% based on changes in SDS-PAGE protein electrophoretic banding pattern of untreated and pre-sowed papaya seeds in magnetic water (2000 Gauss), M.W; chitosan (1.5%), CH and gibberellic acid (1000 ppm), GA3 separately or in combination. Vertical bars represent GTS% ± standard error. Control, dry seeds; T.W, tap water; M.W, magnetic water (2000 Gauss); CH, chitosan (1.5%); GA3, gibberellic acid (1000 ppm); M.W + GA3, magnetic water + gibberellic acid; M.W + CH, magnetic water + chitosan; GA3 + CH, gibberellic acid + chitosan; M.W + GA3 + CH, magnetic water + gibberellic acid + chitosan. GTS%, genome template stability percentage. SDS-PAGE, sodium dodecyl sulphate polyacrylamide gel electrophoresis.
Table 4.
GTS% based on changes in SDS-PAGE protein electrophoretic banding pattern of untreated and submerged papaya seeds in magnetic water (2000 Gauss), M.W; chitosan (1.5%), CH; gibberellic acid (1000 ppm), GA3; separately or in combination. a, number of newly developed bands; b, number of diminished bands; a + b, polymorphic bands
| Control total bands | Treatments | ||||||||||||||||
|---|---|---|---|---|---|---|---|---|---|---|---|---|---|---|---|---|---|
| T.W | M.W | CH | GA3 | M.W + GA3 | M.W + CH | GA3 + CH | M.W + GA3 + CH | ||||||||||
| a | b | a | b | a | b | a | b | a | b | a | b | a | b | a | b | ||
| 14 | 4 | 7 | 3 | 8 | 5 | 7 | 5 | 8 | 6 | 8 | 2 | 7 | 4 | 8 | 4 | 5 | |
| a + b | 11 | 11 | 12 | 13 | 14 | 9 | 12 | 9 | |||||||||
| GTS% | 100 | 21.43 | 21.43 | 14.29 | 7.14 | 0.00 | 35.71 | 14.29 | 35.71 | ||||||||
Table 5.
Genomic-DNA template stability (GTS) and correlated % growth parameters and phytochemical changes among untreated and submerged papaya seeds.
| GTS-Growth parameters | ||||||||||
|---|---|---|---|---|---|---|---|---|---|---|
| GTS% | Seedling height | SVI | Stem diameter | Number of leaves | Root length | Leaf area | Root number | % Germination | CV | |
| GTS% | 1.00 | –0.17 | –0.09 | –0.16 | –0.13 | –0.10 | –0.09 | 0.22 | 0.10 | –0.05 |
| GTS-Phytochemicals | ||||||||||
| GTS | DPPH | α-Amylase | Proline | RSs | Total phenolics | Flavonoids | Phosphorous | |||
| GTS% | 1.00 | 0.29 | –0.15 | 0.29 | –0.11 | 0.22 | 0.10 | 0.38* | ||