
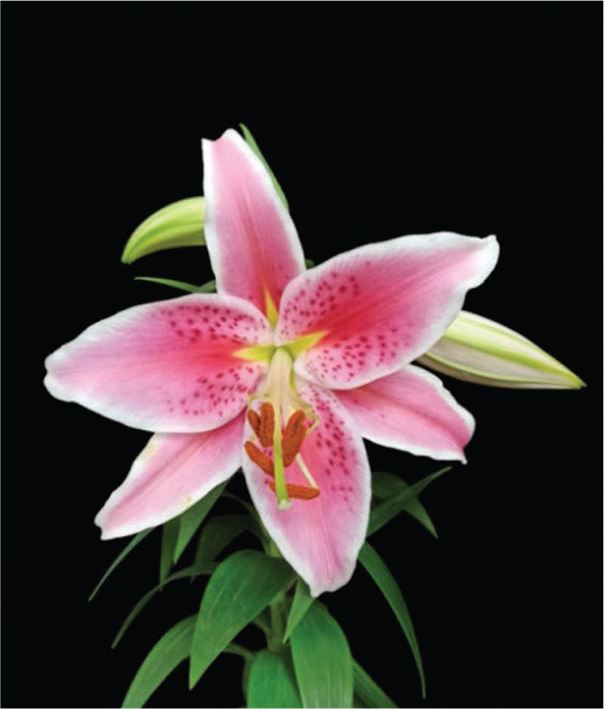
Figure 1.
L. orientalis’Sorbonne’.
Table 1.
Primers used for amplification and expression analysis of LiDXS2.
| Primers | Primer sequence (5′-3′) |
|---|---|
| Actin-F | TGTGCTTTCCCTCTACGCCAGT |
| Actin-R | TCCCTCACGATTTCCCGCTCT |
| LiDXS2-F | ATGGCTTTCTCAGGCTCTCTC |
| LiDXS2-R | CTAGCTCAGATGCATGGCCT |
| egLiDXS2-F | CAGTCACCTGCAAAACAACATGGCTTTCTCAGGCTCTCT |
| egLiDXS2-R | CAGTCACCTGCAAAATACAGCTCAGATGCATGGCCTCTT |
| ecLiDXS2-F | ACGGGGGACTCTAGAGGATCCATGGCTTTCTCAGGCTCTCTCA |
| ecLiDXS2-R | CGATCGGGGAAATTCGAGCTCCTAGCTCAGATGCATGGCCTCT |
| LiDXS2-qF | GGATGATAAACCCCGCTGG |
| LiDXS2-qR | CCCTTCCCTTTCTCCGTGA |
| AtDXR-F | GAGGTCATTGAAGCGCATTATT |
| AtDXR-R | GCCAAGTTACTTCAGAACAAGG |
| AtHDR-F | TTCAGATTGCATATGAAGCACG |
| AtHDR-R | GGTCGGGTTATGAATGATTTCG |
| AtGPPS-F | GAGCAGCGTTATAGTATGGACT |
| AtGPPS-R | CCATACTCAAAAGCTAACACGG |
| AtMCT-F | GAAATCGATGTGAACTCTGAGC |
| AtMCT-R | ACCATCTTTAAGGACCTTCTCG |
| AtActin-F | GAAGTCTTGTTCCAGCCCTCGTTTG |
| AtActin-R | GAACCACCGATCCAGACACTGTACT |
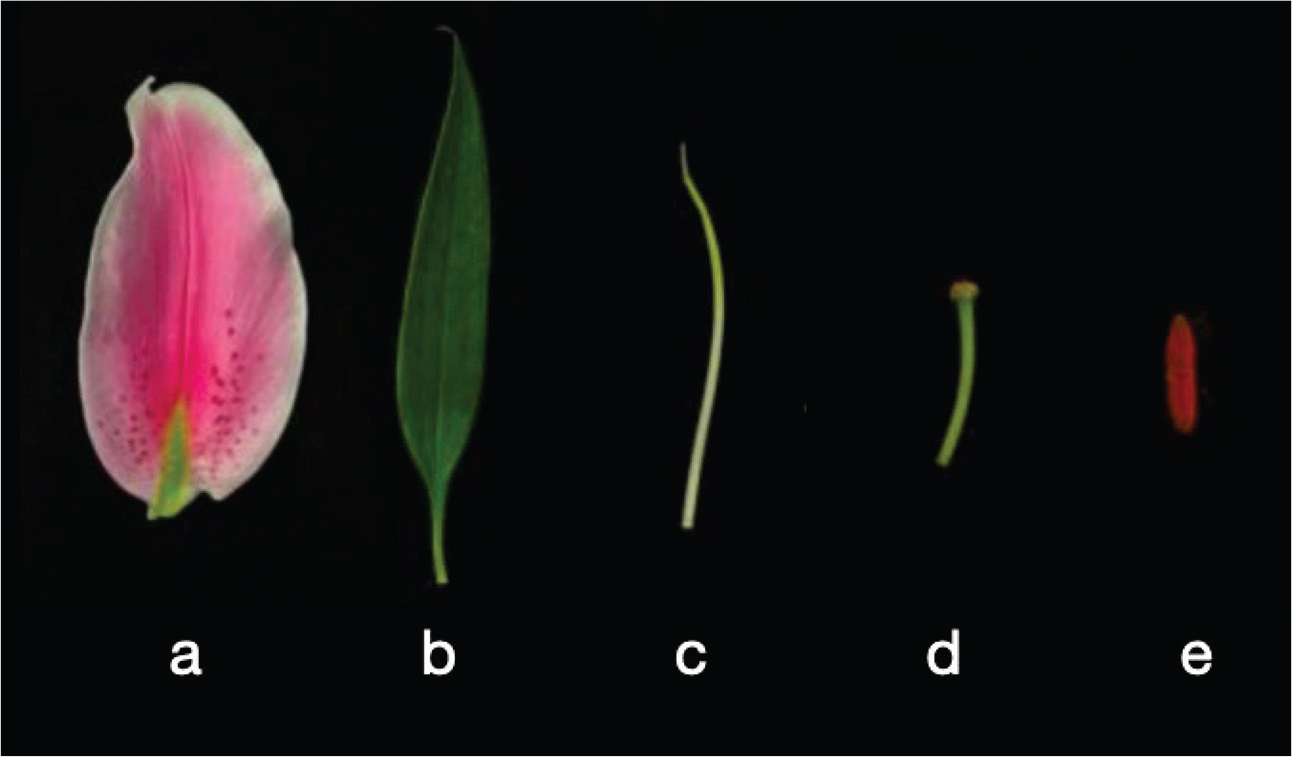
Figure 2.
Parts of the flower of L. orientalis’Sorbonne’: (A) petal, (B) leaf, (C) filament, (D) stigma and (E) anther.
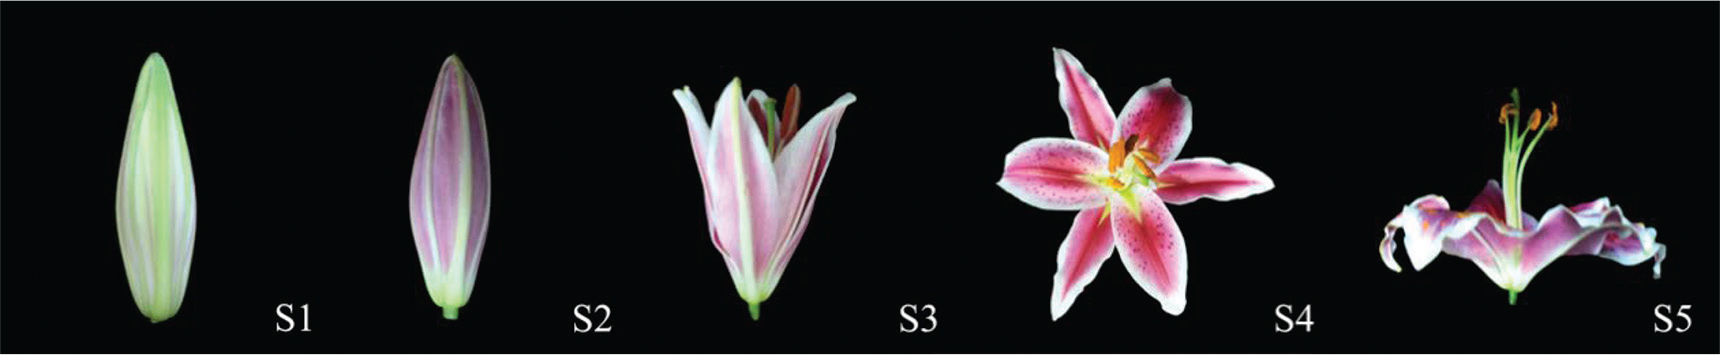
Figure 3.
L. orientalis’Sorbonne’ flower development stages: (S1) green bud stage, (S2) pink bud stage, (S3) halfopening stage, (S4) full blooming stage and (S5) decay stage.
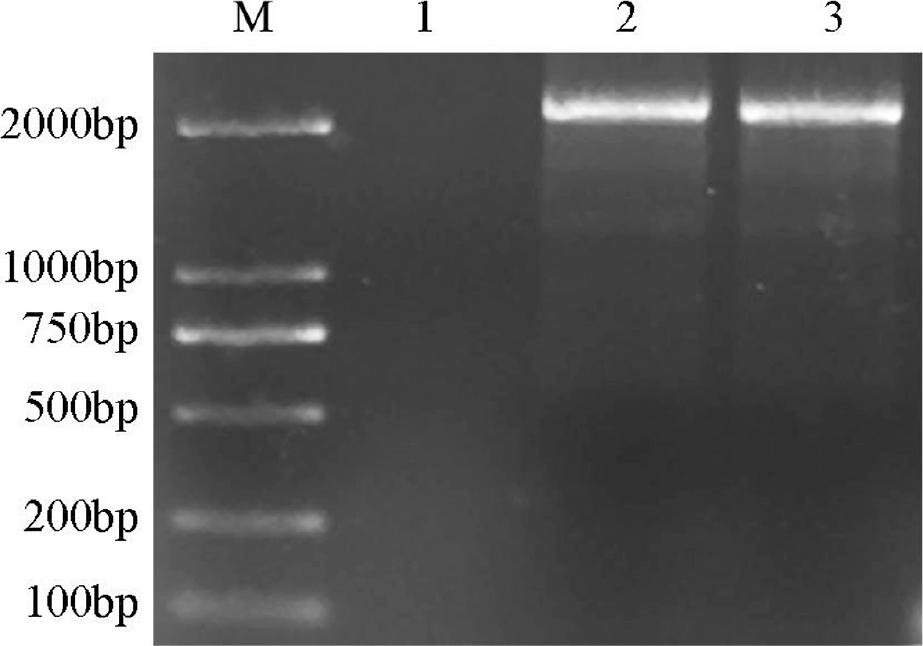
Figure 4.
Agarose gel electrophoresis of the polymerase chain reaction product. The amplification product of LiDXS2. (M) DL2000 DNA marker. (1) Negative control, (2) and (3) LiDXS2.
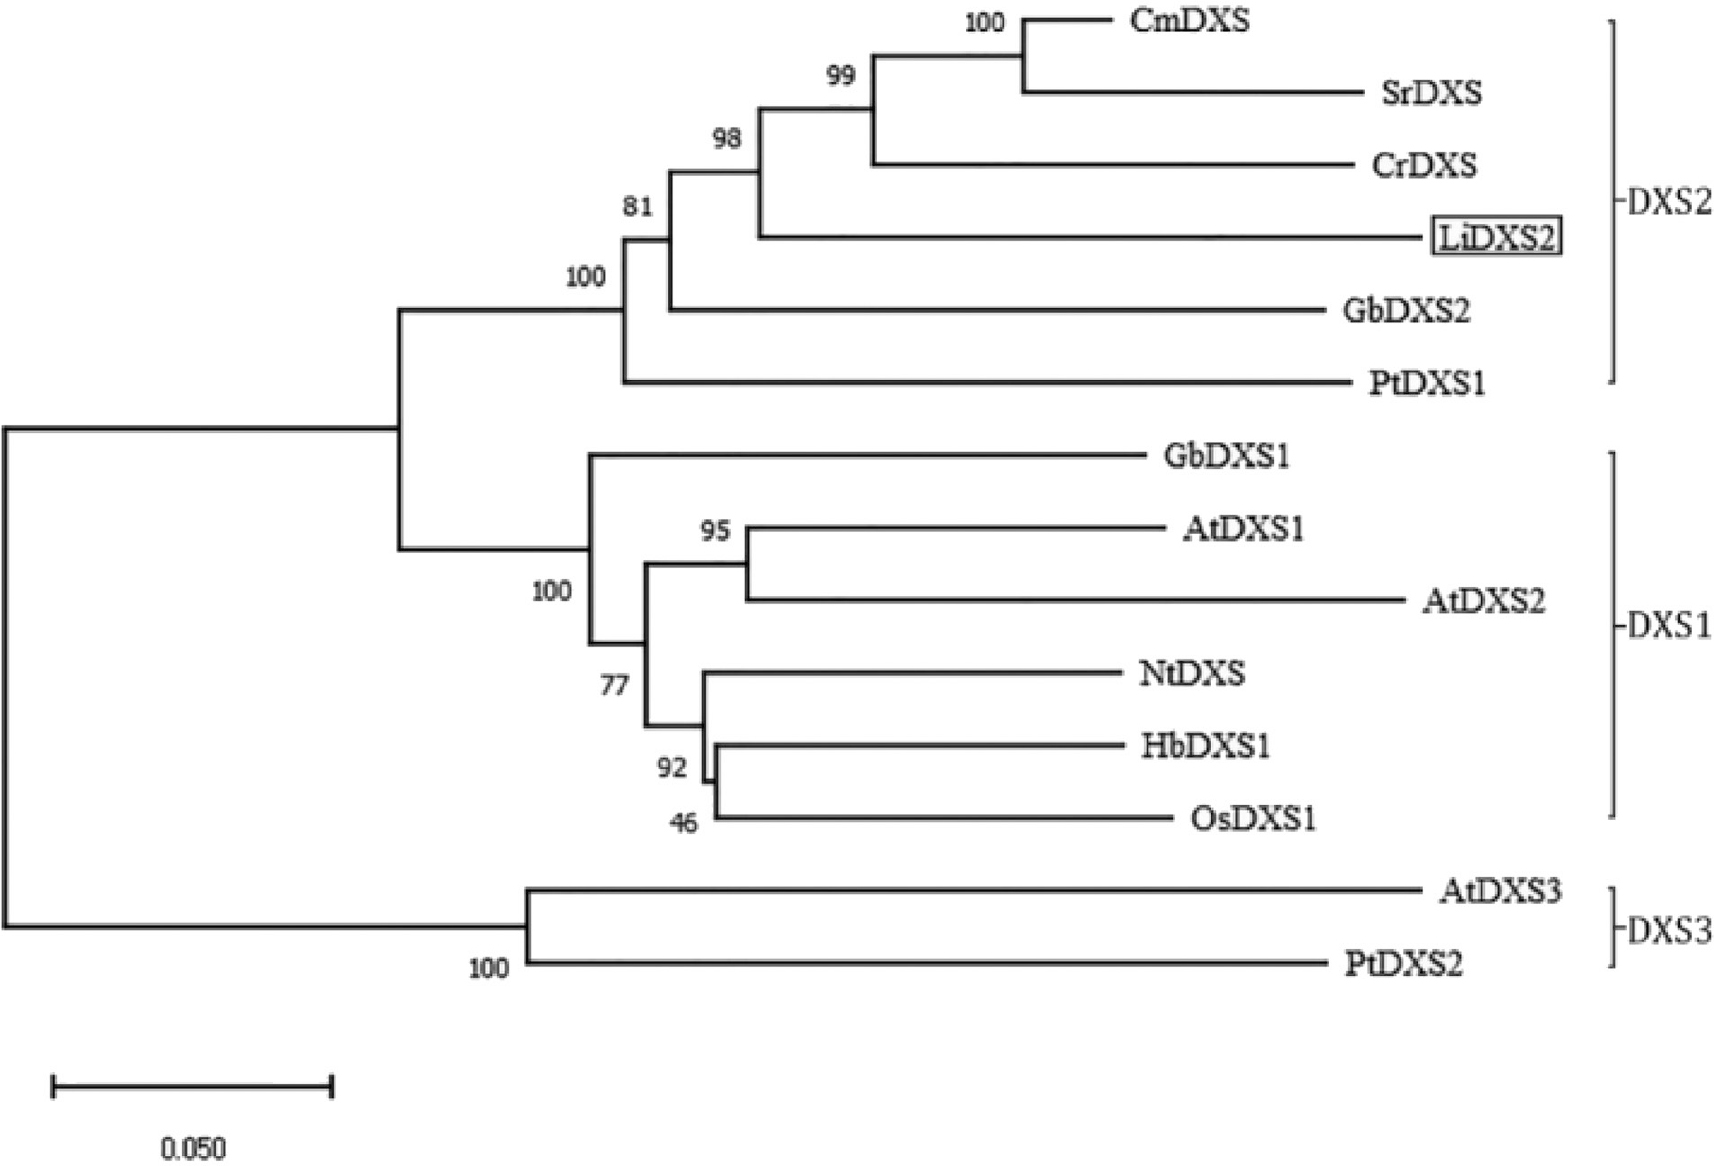
Figure 5.
Phylogenetic analysis of LiDXS2 and DXS from other plants: GbDXS1 (Ginkgo biloba DXS1, AAS89341.1); GbDXS2 (Ginkgo biloba DXS2, AAR95699.1); AtDXS1 (Arabidopsis thaliana DXS1, NP_193291.1); AtDXS2 (Arabidopsis thaliana DXS2, NP_850620.2); AtDXS3 (Arabidopsis thaliana DXS3, NP_196699.1); CmDXS (Chrysanthemum morifolium DXS, BAE79547.1); HbDXS1 (Hevea brasiliensi DXS1, AAS94123.1); CrDXS (Catharanthus roseus DXS, CAA09804.2); OsDXS1 (Oryza sativa DXS1, XP_015640505.1); OsDXS2 (Oryza sativa DXS2, XP_015642490.1); PtDXS1 (Populus trichocarpa DXS1, XP_006381844.1); PtDXS2 (Populus trichocarpa DXS2, XP_024460342.1); NtDXS (Nicotiana tabacum DXS, CBA12009.1); SrDXS (Stevia rebaudiana DXS, CAD22155.2) and AaDXS (Artemisia annua DXS, PWA87995.1).
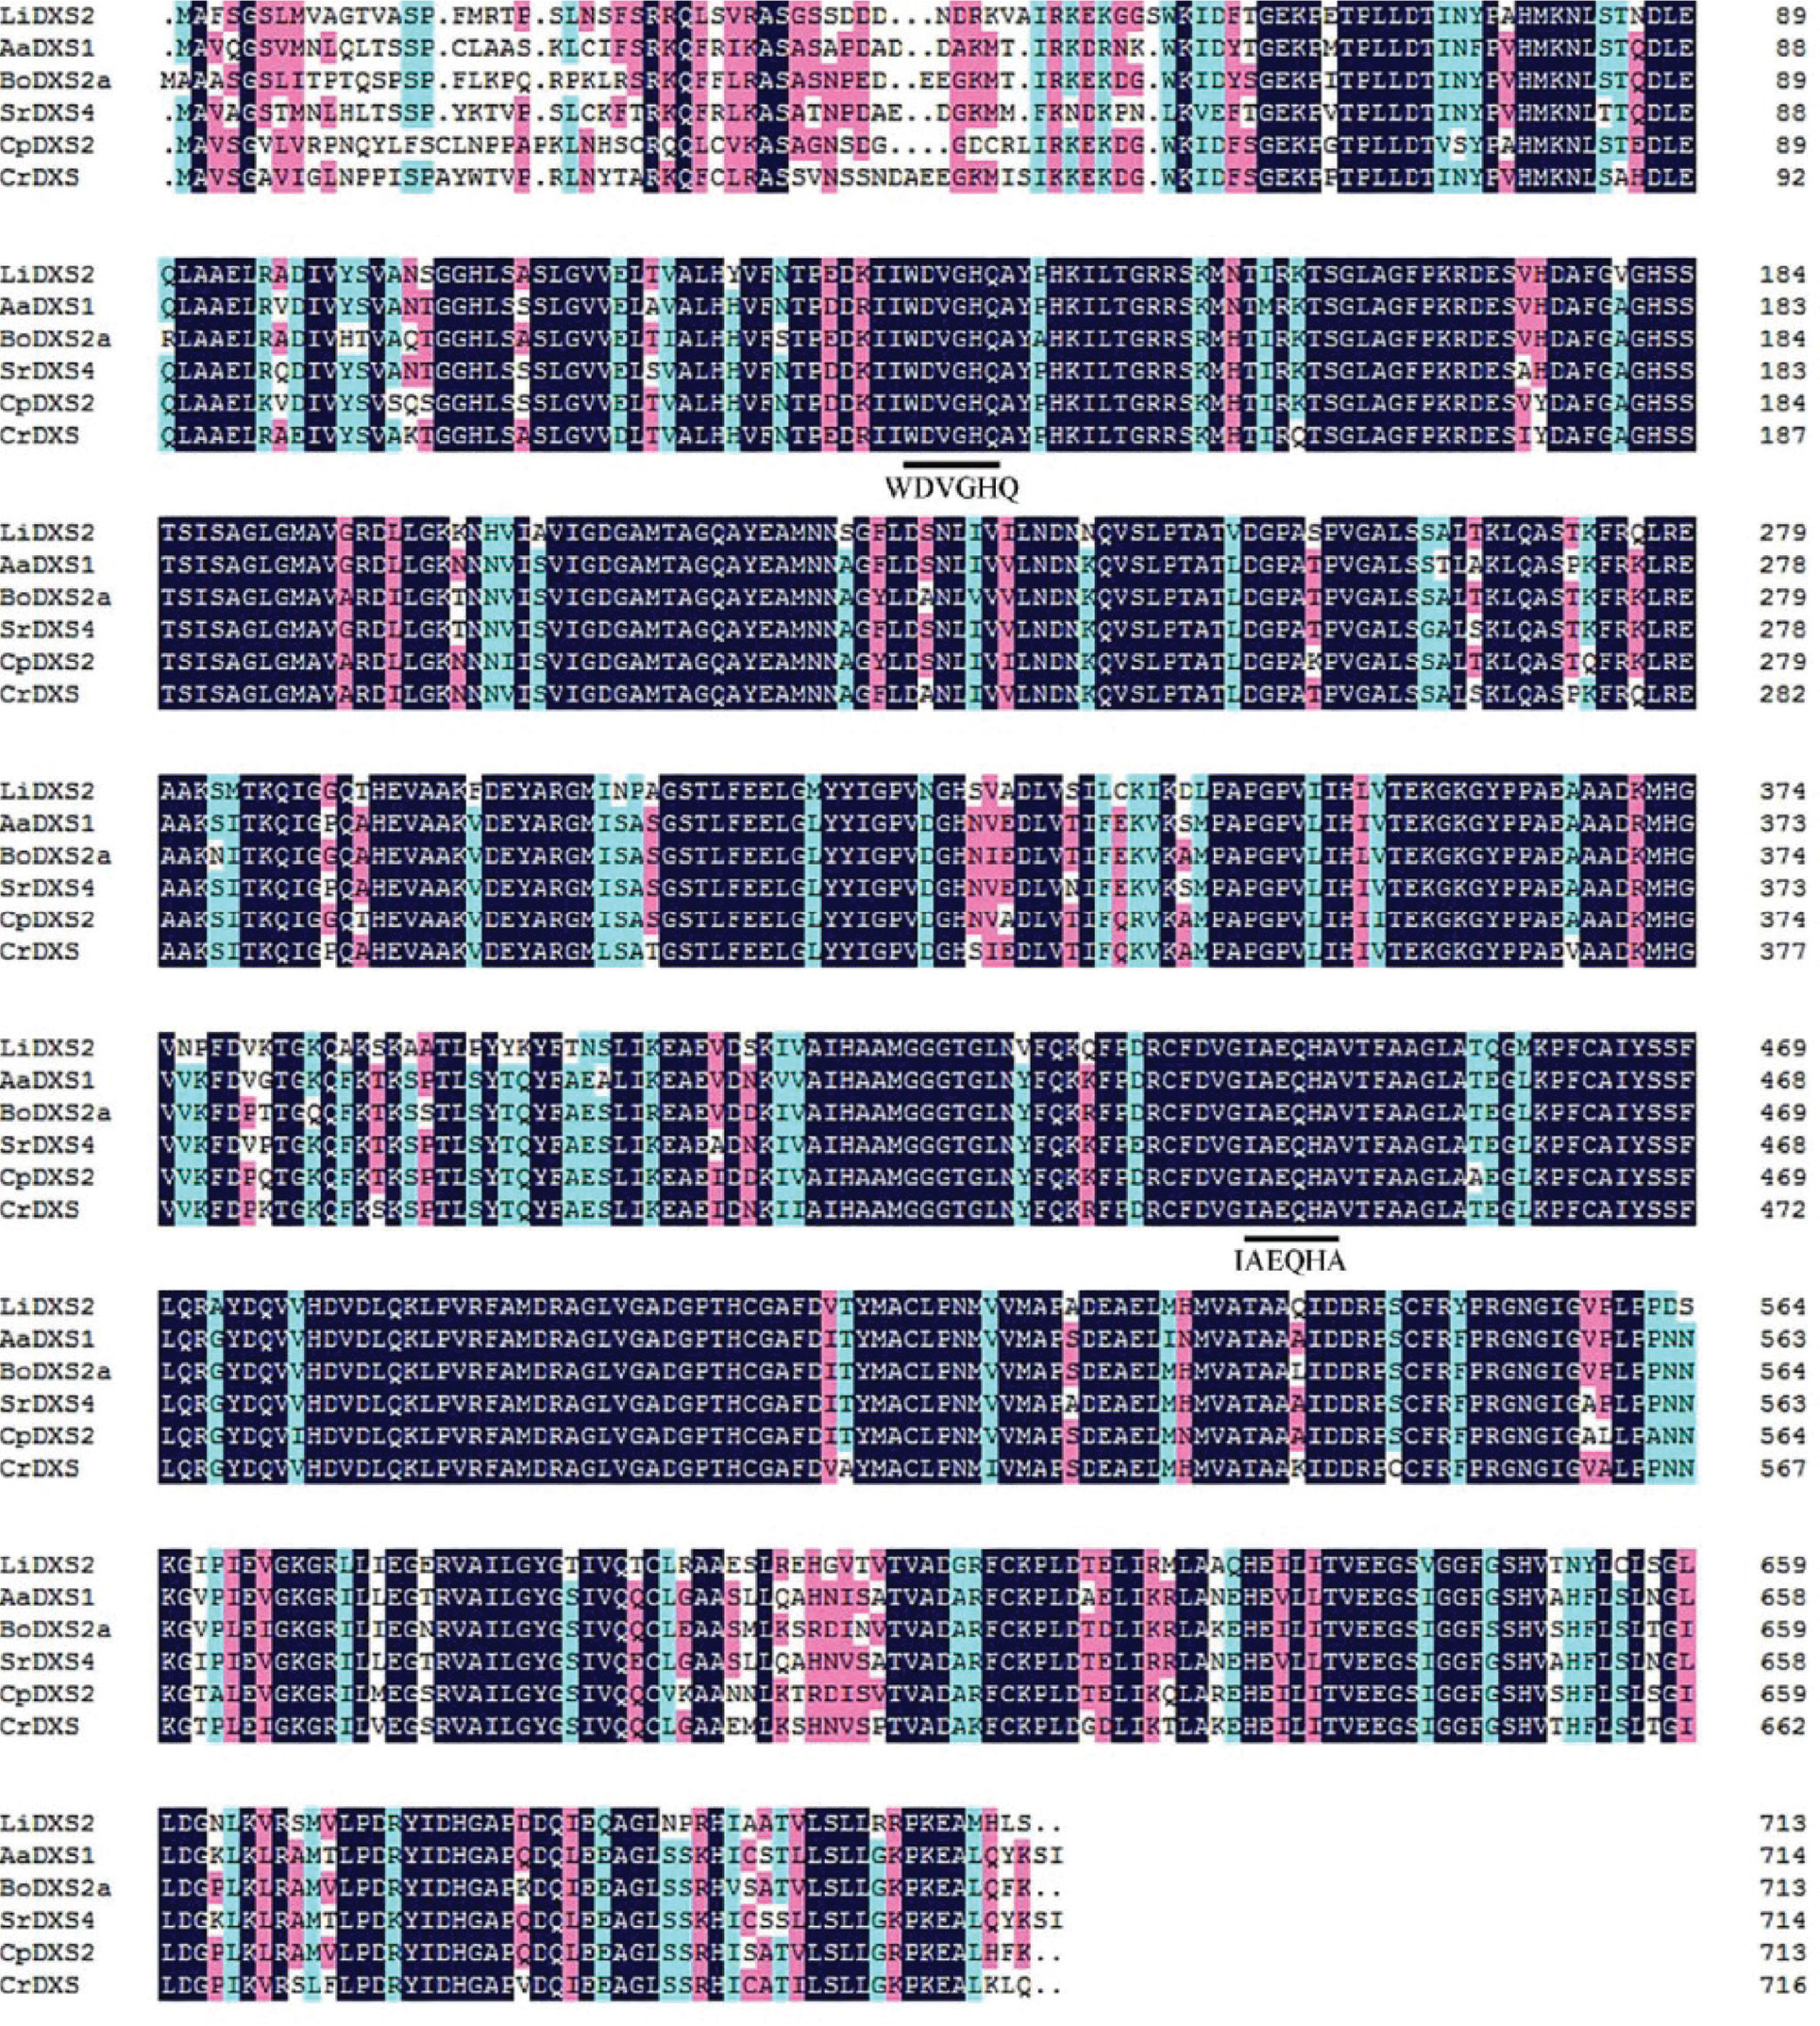
Figure 6.
Amino acid sequence homology comparison alignment of LiDXS2 and DXS from other plants: AaDXS1 (Artemisia annua DXS1, PWA87995.1); BoDXS2a (Bixa orellana DXS2a, AMJ39460.1); SrDXS (Stevia rebaudiana DXS4, ALJ30089.1); CpDXS2 (Crataegus pinnatifida var. major DXS2, ALL29183.1) and CrDXS (Catharanthus roseus DXS, CAA09804.2).
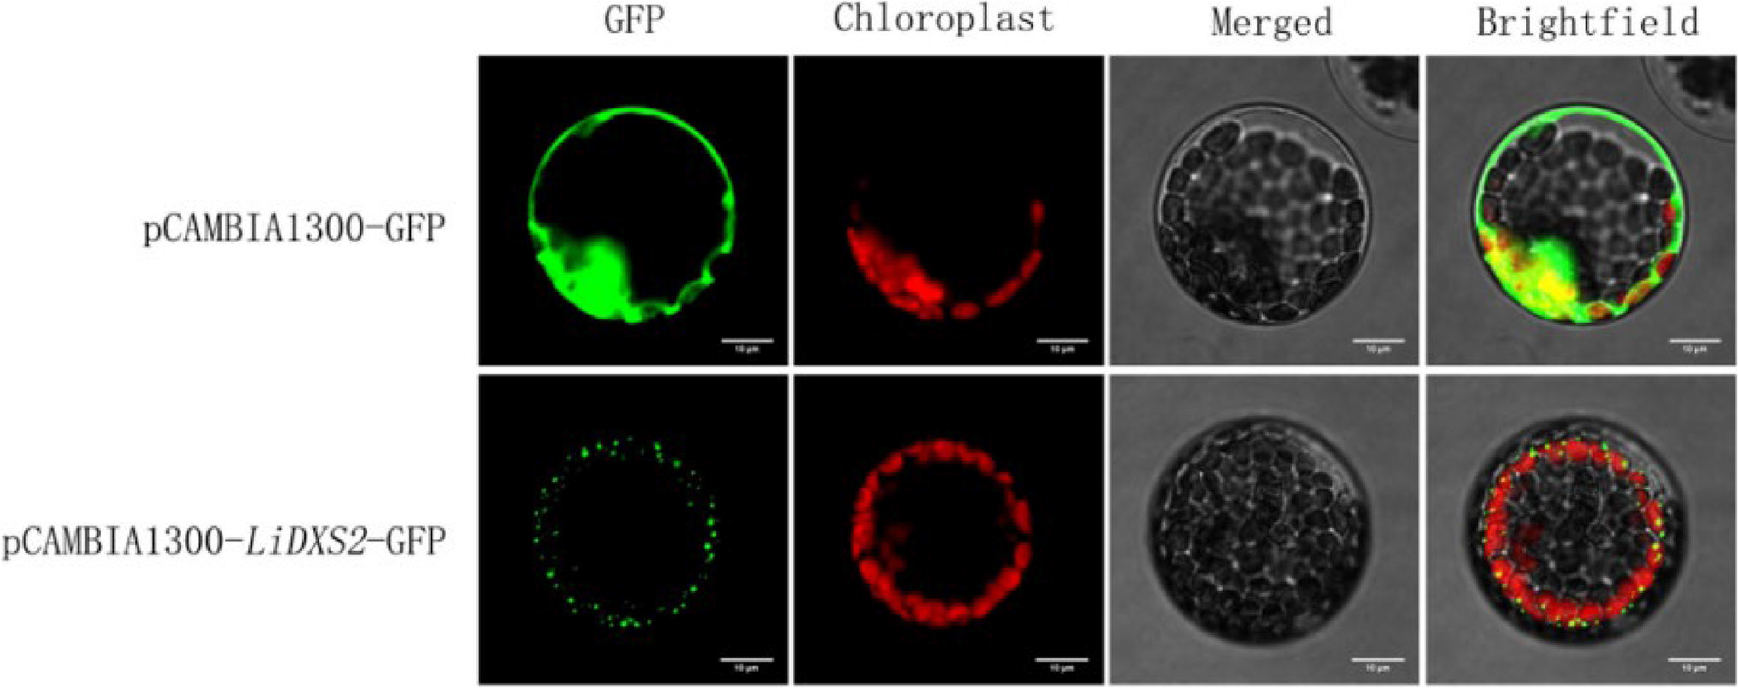
Figure 7.
Subcellular localisation of LiDXS2. The fusion proteins PCAMBIA1300-LiDXS2-GFP and PCAMBIA1300-GFP as control proteins were detected using a confocal laser scanning microscope. Bar = 10 μm.
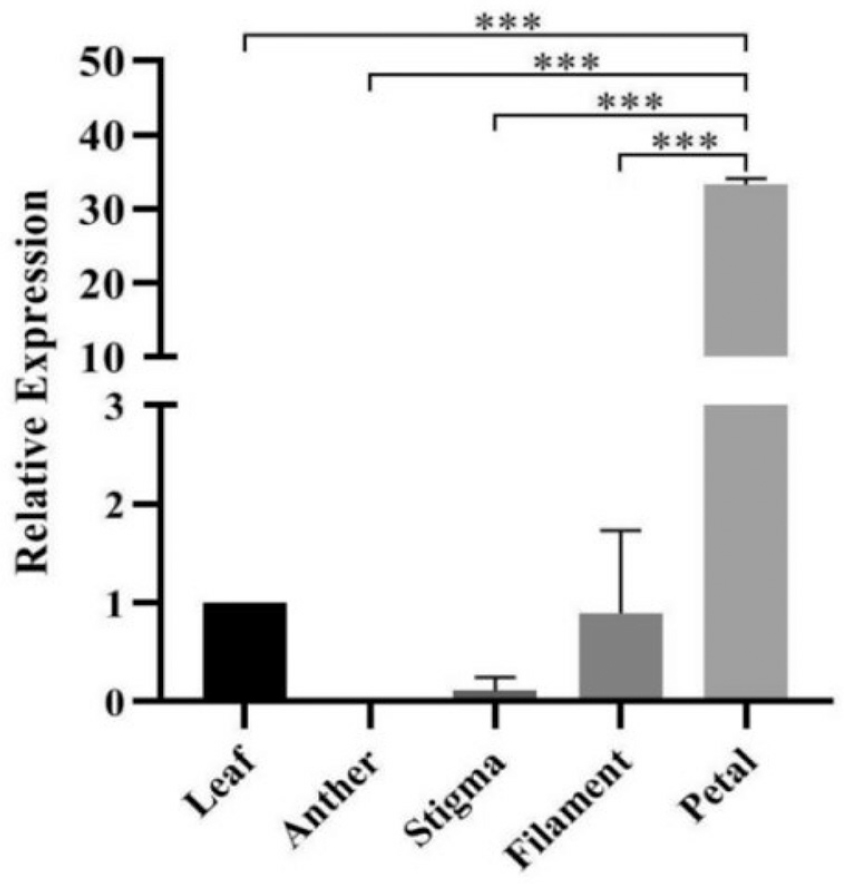
Figure 8.
Relative expression levels of LiDXS2 in different flower parts at the first full-blooming day. ***p < 0.001.
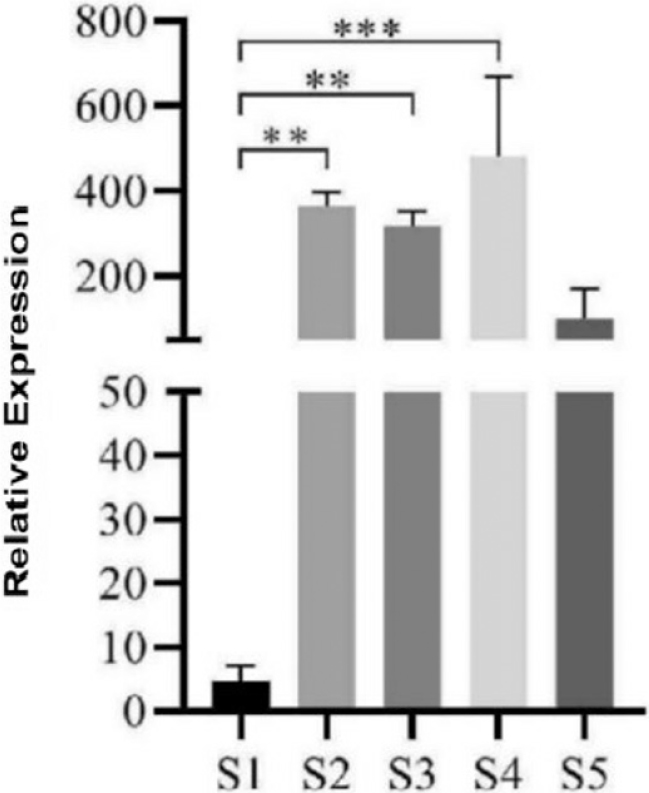
Figure 9.
Relative expression analysis of flower developmental stage of the LiDXS2 gene in the Lilium Oriental hybrids. (S1) Green bud stage, (S2) pink bud stage, (S3) half-opening stage, (S4) full blooming stage and (S5) decay stage. ***p < 0.001.
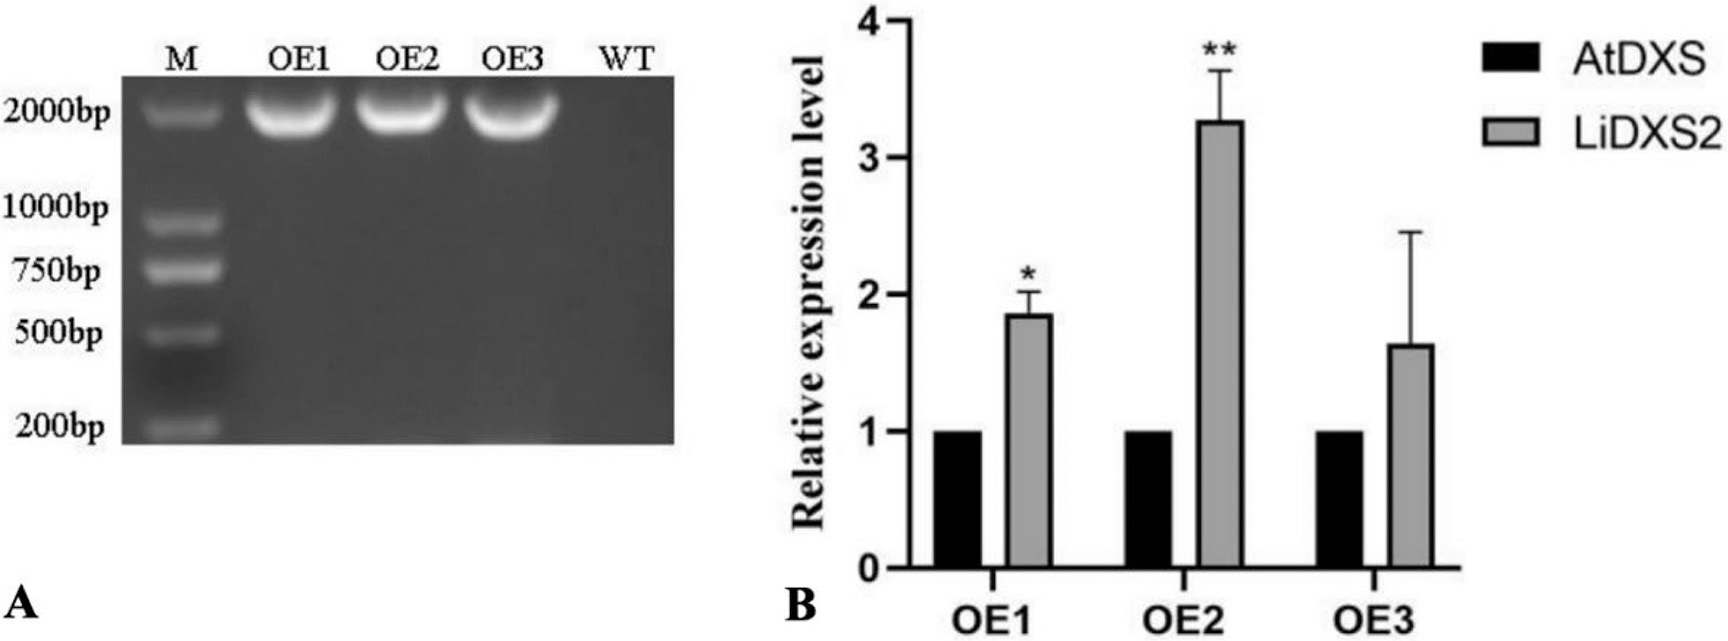
Figure 10.
Identification of transgenic A. thaliana: (A) agarose gel electrophoresis of transgenic plants; (M) DL2000 DNA marker; (OE1, OE2, OE3) expression level of LiDXS2 in transgenic plants, (B) expression level of LiDXS2 in transgenic plants.
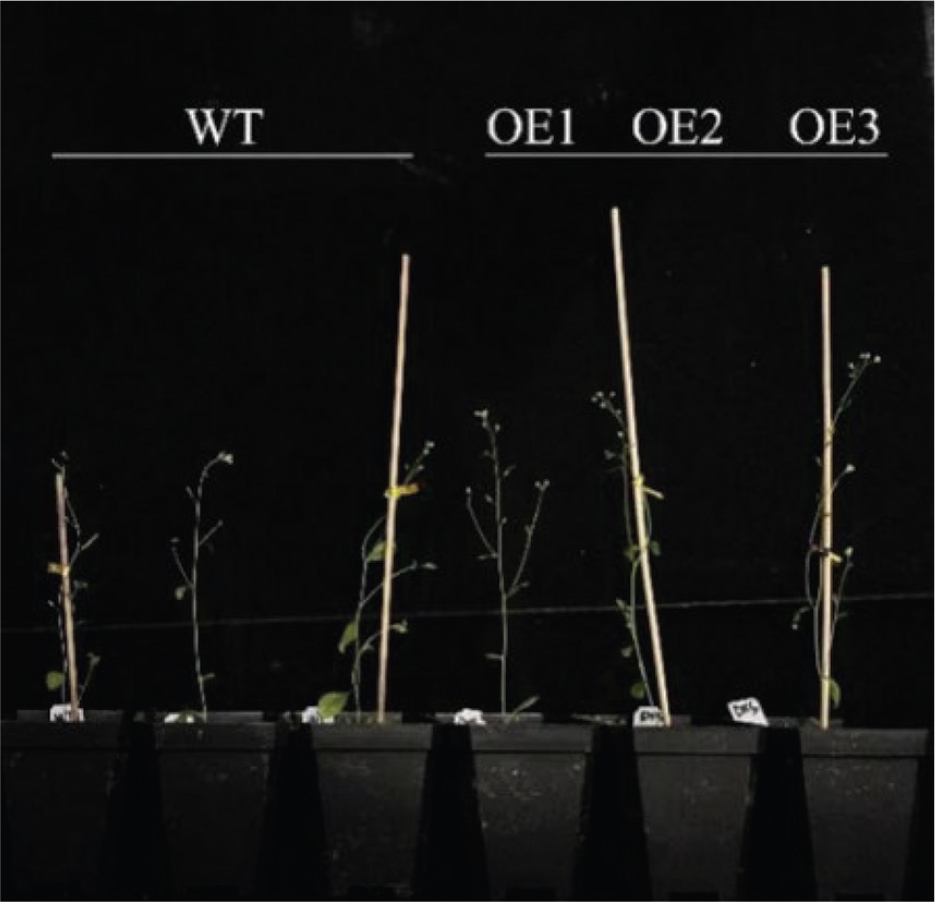
Figure 11.
Phenotype observation of T3-generation positive plants in transgenic Arabidopsis; (OE1, OE2, OE3) expression level of LiDXS2 in transgenic plants, (WT) wild type.
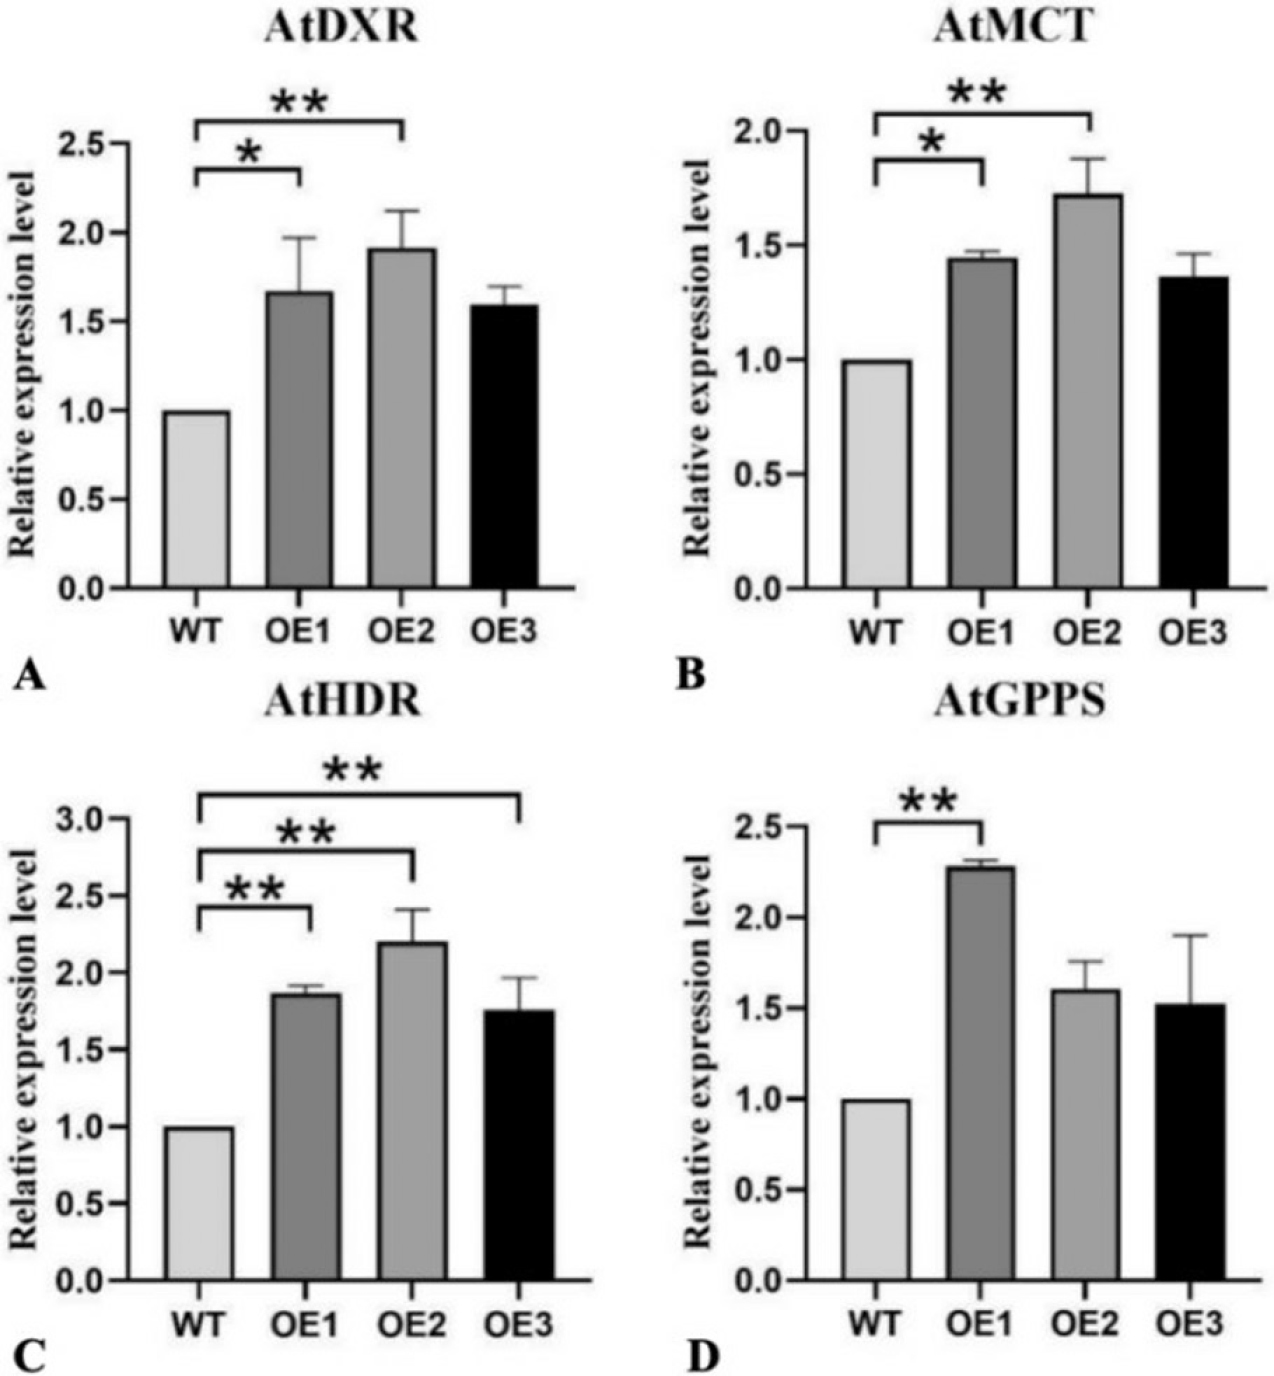
Figure 12.
Gene expression levels in transgenic A. thaliana. (A) AtDXR; (B) AtMCT; (C) AtHDR and (D) AtGPPS. The expression levels of MEP pathway-related genes in different transgenic lines were determined by qRT-PCR. A. thaliana Actin (AtActin) was used as the internal reference. (OE1, OE2, OE3) expression level of LiDXS2 in transgenic plants, (WT) wild type. The columns represent average expression values for each line and the error bars show the standard deviation of three biological replicates. The GraphPad statistical analysis was used for testing significant differences in expression levels. *p < 0.05, **p < 0.01.
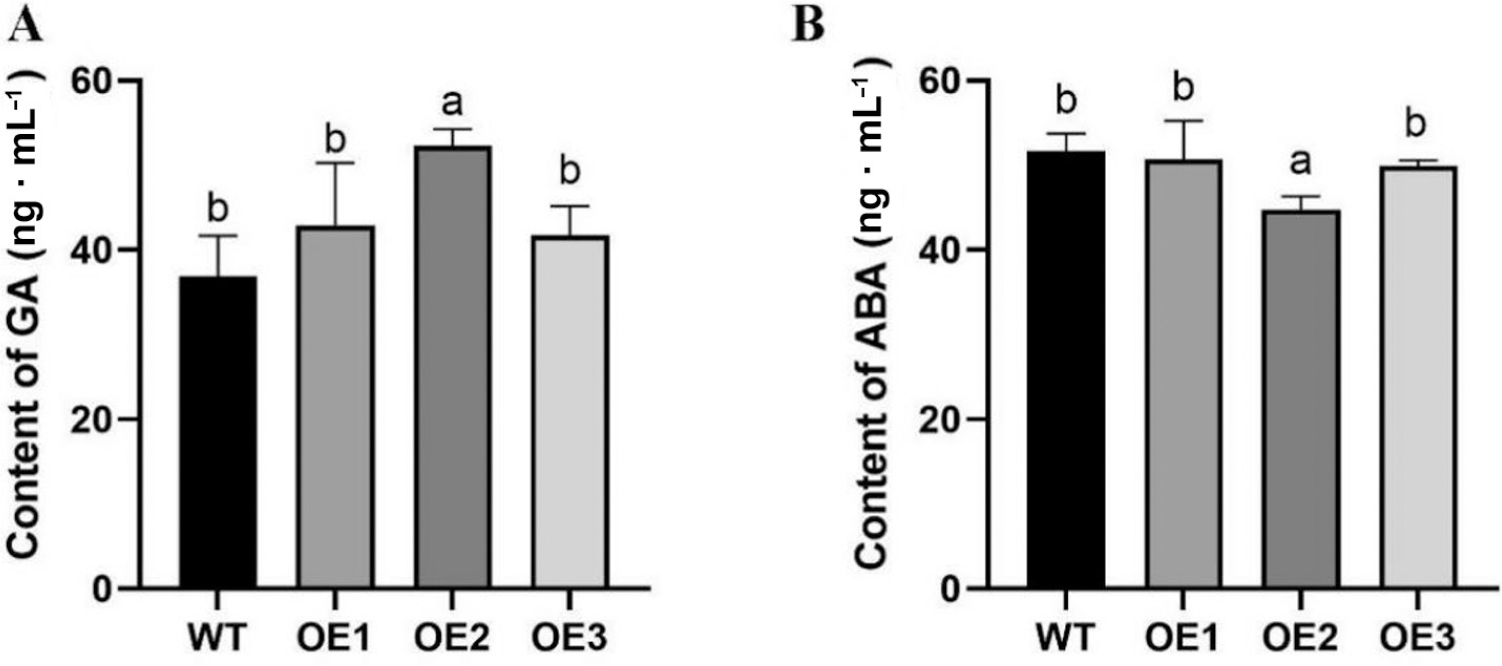
Figure 13.
Determination of ABA and GA contents in LiDXS2 transgenic Arabidopsis and WT Arabidopsis. (A) GA content of transgenic and WT of A. thaliana leaves; (B) ABA content of transgenic and WT of A. thaliana leaves. (OE1, OE2, OE3) expression level of LiDXS2 in transgenic plants, (WT) wild type. “a”: significant difference at p < 0.05.