
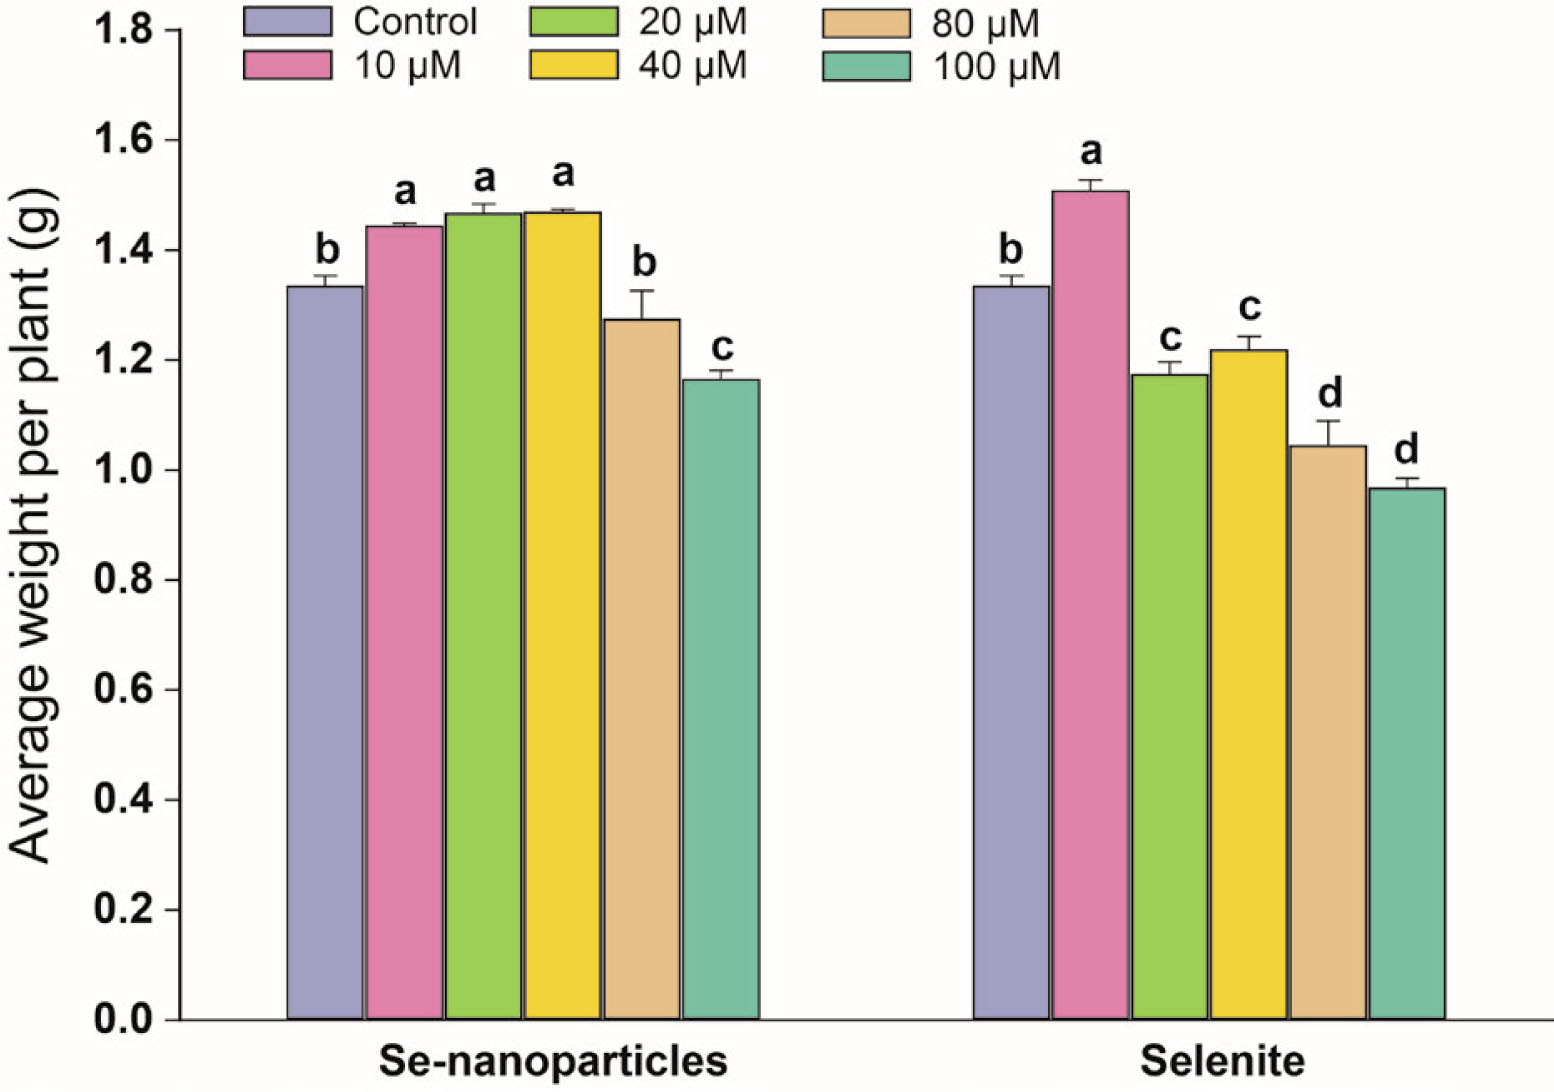
Figure 1
Biomass statistics of soybean sprouts. Different letters above the columns indicate significant differences at p < 0.05.
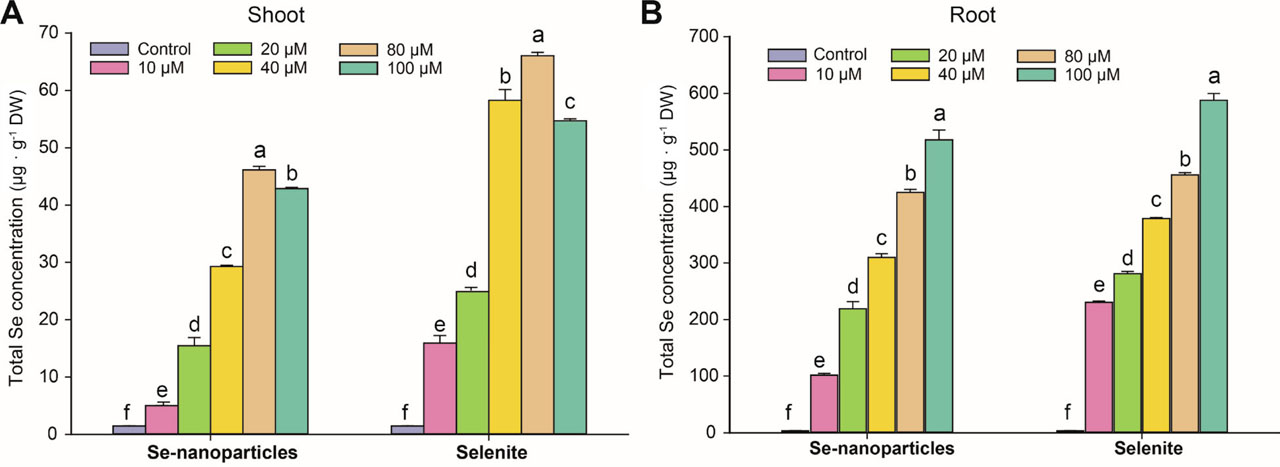
Figure 2
Total Se concentrations in the shoots (A) and roots (B) of soybean sprouts treated with SeNPs and selenite. Different letters above the columns indicate significant differences at p < 0.05.
Table 1
Selenium speciation in soybean shoots and roots.
| Tissue | Treatment | Selenium speciation (μg · g−1 DW) | ||||
|---|---|---|---|---|---|---|
| SeCys2 | MeSeCys | SeMet | Se4+ | Se6+ | ||
| Shoot | 0 | nd | nd | 0.193 ± 0.021 d | 0.035 ± 0.008 c | nd |
| N20 | 0.188 ± 0.022 b | 0.185 ± 0.048 c | 2.182 ± 0.258 c | 0.071 ± 0.023 c | 0.453 ± 0.001 b | |
| N100 | 1.192 ± 0.199 a | 0.953 ± 0.097 a | 3.789 ± 0.611 b | 0.147 ± 0.025 b | 0.792 ± 0.092 a | |
| S20 | 0.093 ± 0.019 b | 0.087 ± 0.008 d | 1.857 ± 0.189 c | 0.048 ± 0.005 c | nd | |
| S100 | 0.969 ± 0.041 a | 0.696 ± 0.012 b | 4.796 ± 0.065 a | 0.248 ± 0.006 a | nd | |
| Root | 0 | nd | nd | 0.127 ± 0.015 d | 0.034 ± 0.008 e | nd |
| N20 | 2.245 ± 0.214 d | 2.292 ± 0.286 c | 3.897 ± 0.240 c | 0.888 ± 0.051 d | 2.444 ± 0.057 b | |
| N100 | 6.318 ± 0.377 b | 7.224 ± 0.336 b | 5.734 ± 0.250 b | 1.759 ± 0.066 b | 6.870 ± 0.356 a | |
| S20 | 3.613 ± 0.084 c | 2.188 ± 0.255 c | 3.601 ± 0.178 c | 1.046 ± 0.015 c | nd | |
| S100 | 11.135 ± 0.716 a | 8.698 ± 0.235 a | 14.213 ± 0.059 a | 1.970 ± 0.021 a | nd | |
[i] Different letters behind the data indicate significant differences at p < 0.05.
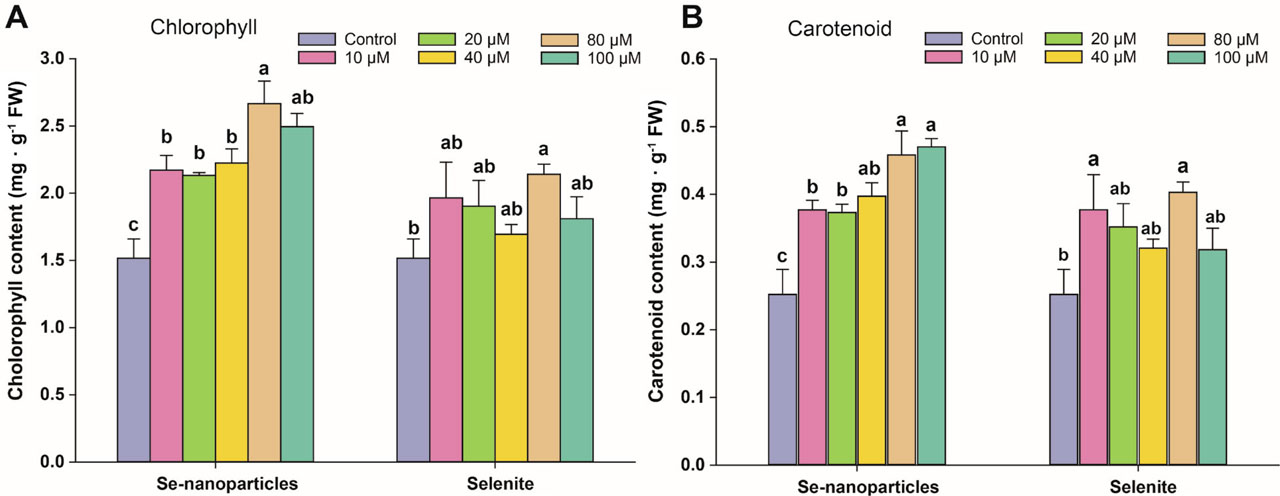
Figure 3
Chlorophyll (A) and carotenoid (B) contents of soybean sprouts treated with SeNPs and selenite. Different letters above the columns indicate significant differences at p < 0.05. SeNPs, selenium nanoparticles.
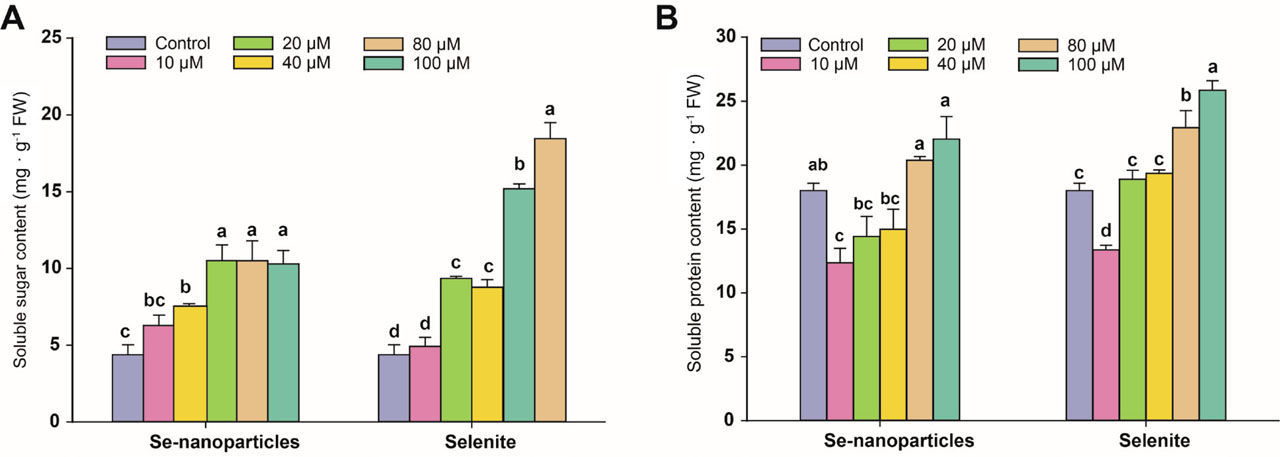
Figure 4
Soluble sugar (A) and protein (B) contents of soybean sprouts treated with SeNPs and selenite. Different letters above the columns indicate significant differences at p < 0.05. SeNPs, selenium nanoparticles.
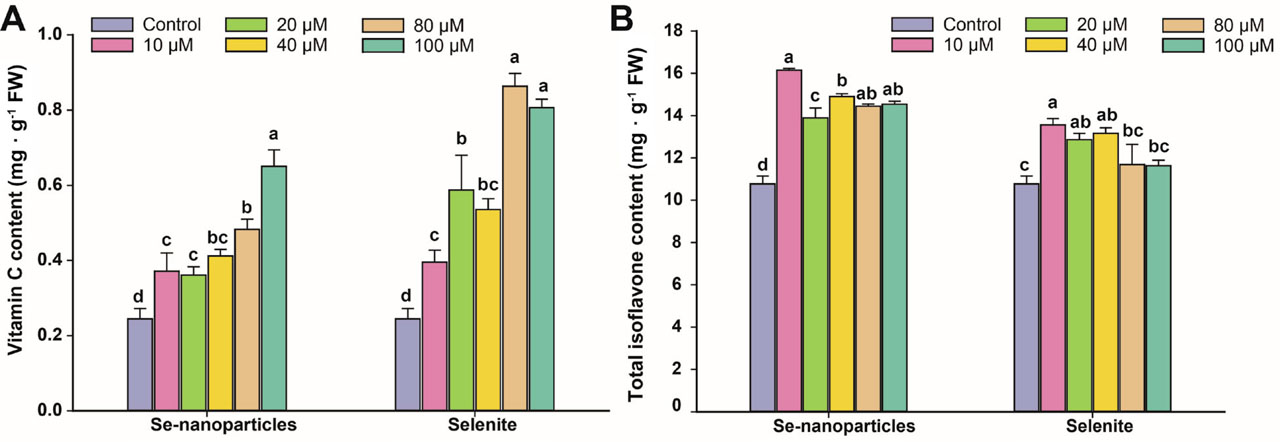
Figure 5
Vitamin C (A) and total isoflavone (B) contents of soybean sprouts treated with SeNPs and selenite. Different letters above the columns indicate significant differences at p < 0.05. SeNPs, selenium nanoparticles.
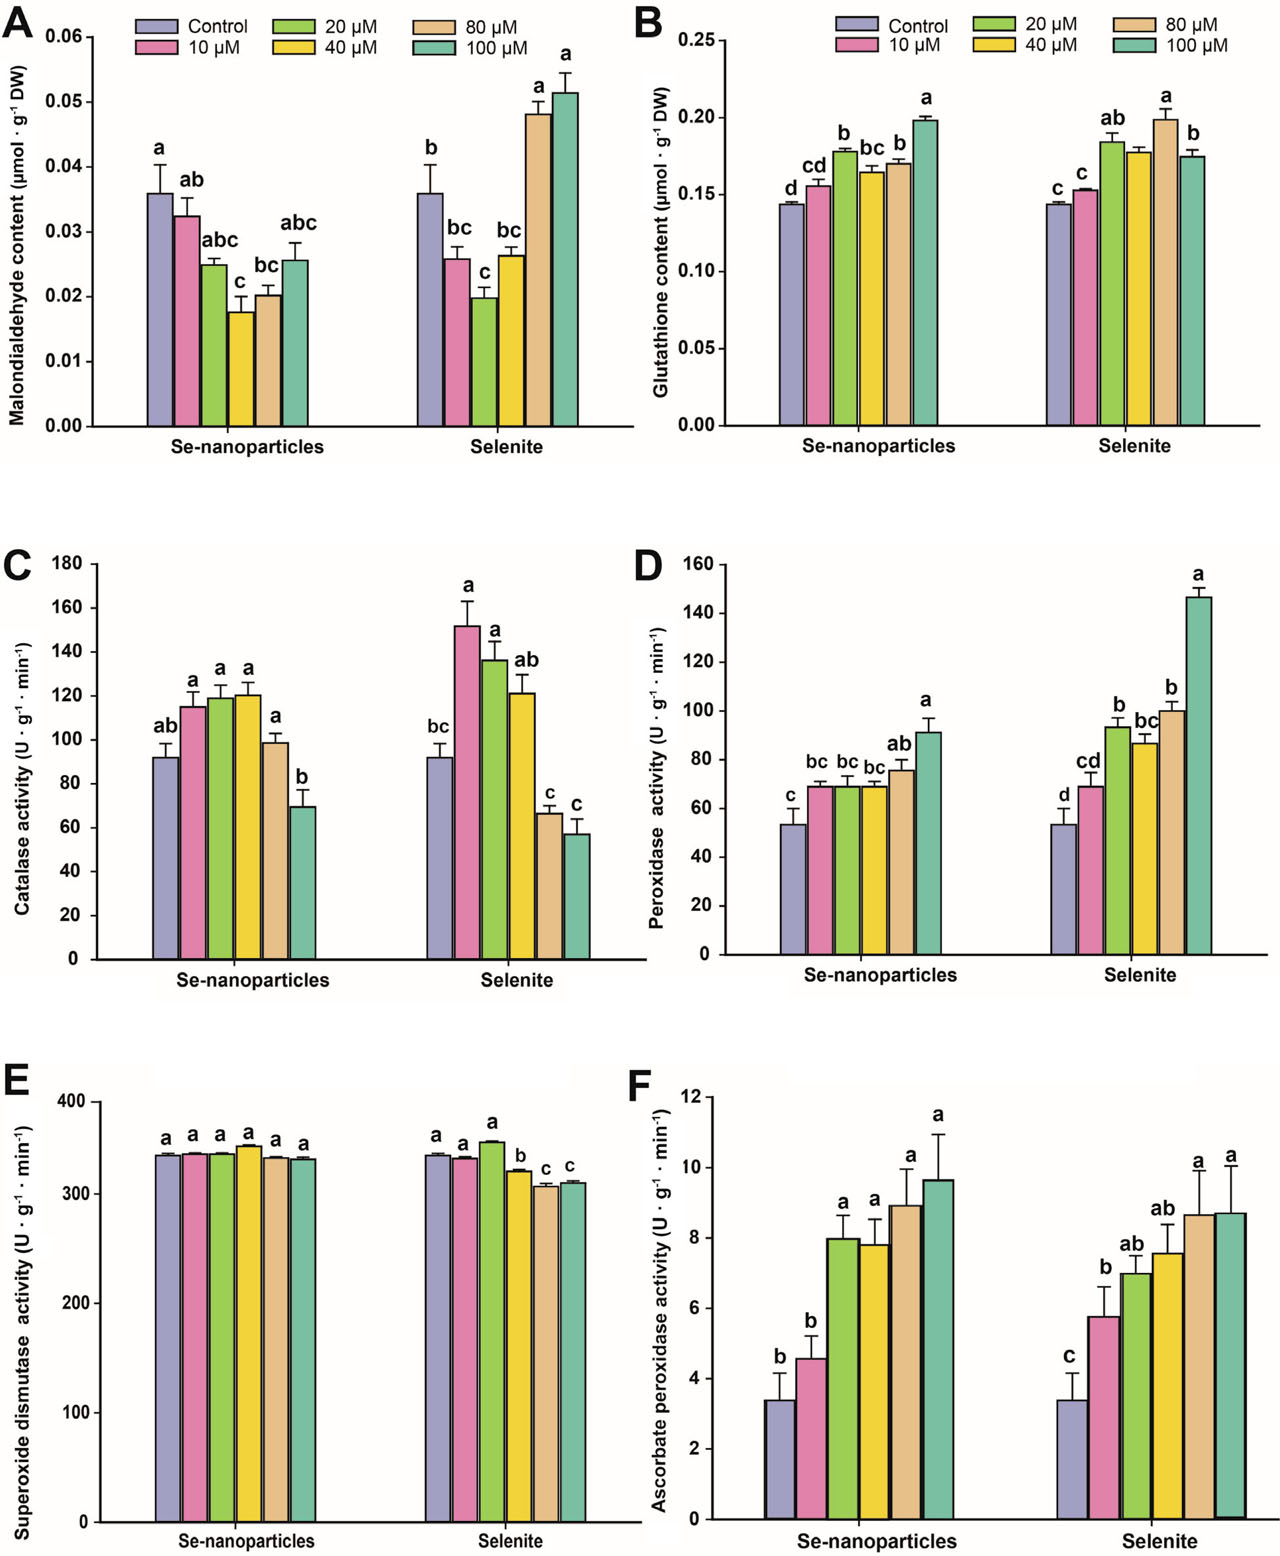
Figure 6
Changes in the MDA and antioxidant system of soybean sprouts treated with SeNPs and selenite. (A) MDA content; (B) GSH content; (C) CAT activity; (D) POD activity; (E) SOD activity and (F) APX activity. Different letters above the columns indicate significant differences at p < 0.05. APX, ascorbate peroxidase; CAT, catalase; GSH, glutathione; MDA, malonaldehyde; POD, peroxidase; SeNPs, selenium nanoparticles; SOD, superoxidase dismutase.
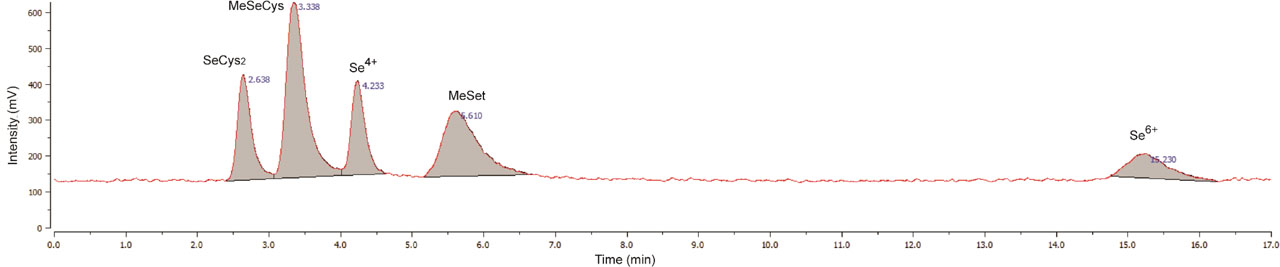
Figure S1
The spectrogram of the Se speciations by LC-AFS. LC-AFS, liquid chromatography-atomic fluorescence spectrometry; Se4+, selenite; Se6+, selenate; SeCys2, selenocystine; SeMeCys, methyl selenocysteine; SeMet, selenomethionine.