
Table 1
Treatment combinations.
| Group | Name | Treatment |
|---|---|---|
| T1 | Negative control | Distilled water |
| T2 | Positive control | Strain PC3 (L. amnigena) |
| T3 | PC3 + 0.5 mM SA | Inoculation of strain PC3 + 0.5 mM SA |
| T4 | PC3 + 1.0 Mm SA | Inoculation of strain PC3 + 1.0 mM SA |
| T5 | PC3 + 1.5 Mm SA | Inoculation of strain PC3 + 1.5 mM SA |
| T6 | PC3 + 2.0 Mm SA | Inoculation of strain PC3 + 2.0 mM SA |
[i] SA, salicylic acid.
Table 2
Gene description and primers sequences used for the qRT-PCR.
| Gene symbol | Description | Primer sequence (5′–3′) | Experiment |
|---|---|---|---|
| SOD | Manganese superoxide dismutase | F-GCTGGTGCTAGAGTAGCCTG R-TCAAAGTTATCTGCCGTTCTCCA | Antioxidant activity test |
| POD | Peroxidase | F-GTTGCCTTATCAGGTTTGTTCTTT R-CGGACGTGTTTGAATCAACTT | Antioxidant activity test |
| CAT | Catalase | F-TTTCAGGAGATGTGCAGCGT R-ATGTATGAGGCTTTTATGCTGCT | Antioxidant activity test |
| GST | Glutathione S-transferase | F-AGCTGGTGCCCATCAATCTC R-CCCTCTGAGACTCCTAATGATCC | Antioxidant activity test |
| ACT | Actin-related protein Actin | F-GCTCCTAGAGCTGTATTCCCAAGT R-CAGTCGAAACGTGGTATCTTGACT | Antioxidant activity test |
[i] CAT, catalase; GST, Glutathione S-transferase; POD, Peroxidase; qRT-PCR, quantitative real-time PCR; SOD, superoxide dismutase.
Table 3
Production of extracellular enzymes by suspensions (3.6 CFU · mL−1 × 10⁷ CFU · mL−1) from L. amnigena.
| Extracellular enzymes | Enzyme activity (U · mL−1) |
|---|---|
| Pectinase | 77.27 ± 3.441 b |
| Protease | 91.25 ± 4.672 a |
| Pectin lyase | 2.22 ± 0.102 c |
| Cellulase | 0.08 ± 0.009 c |
[i] Data are presented as mean ± standard error (SE) of three independent experiments performed in triplicate. Different letters indicate a significant difference according to Duncan's multiple range test (p < 0.05).
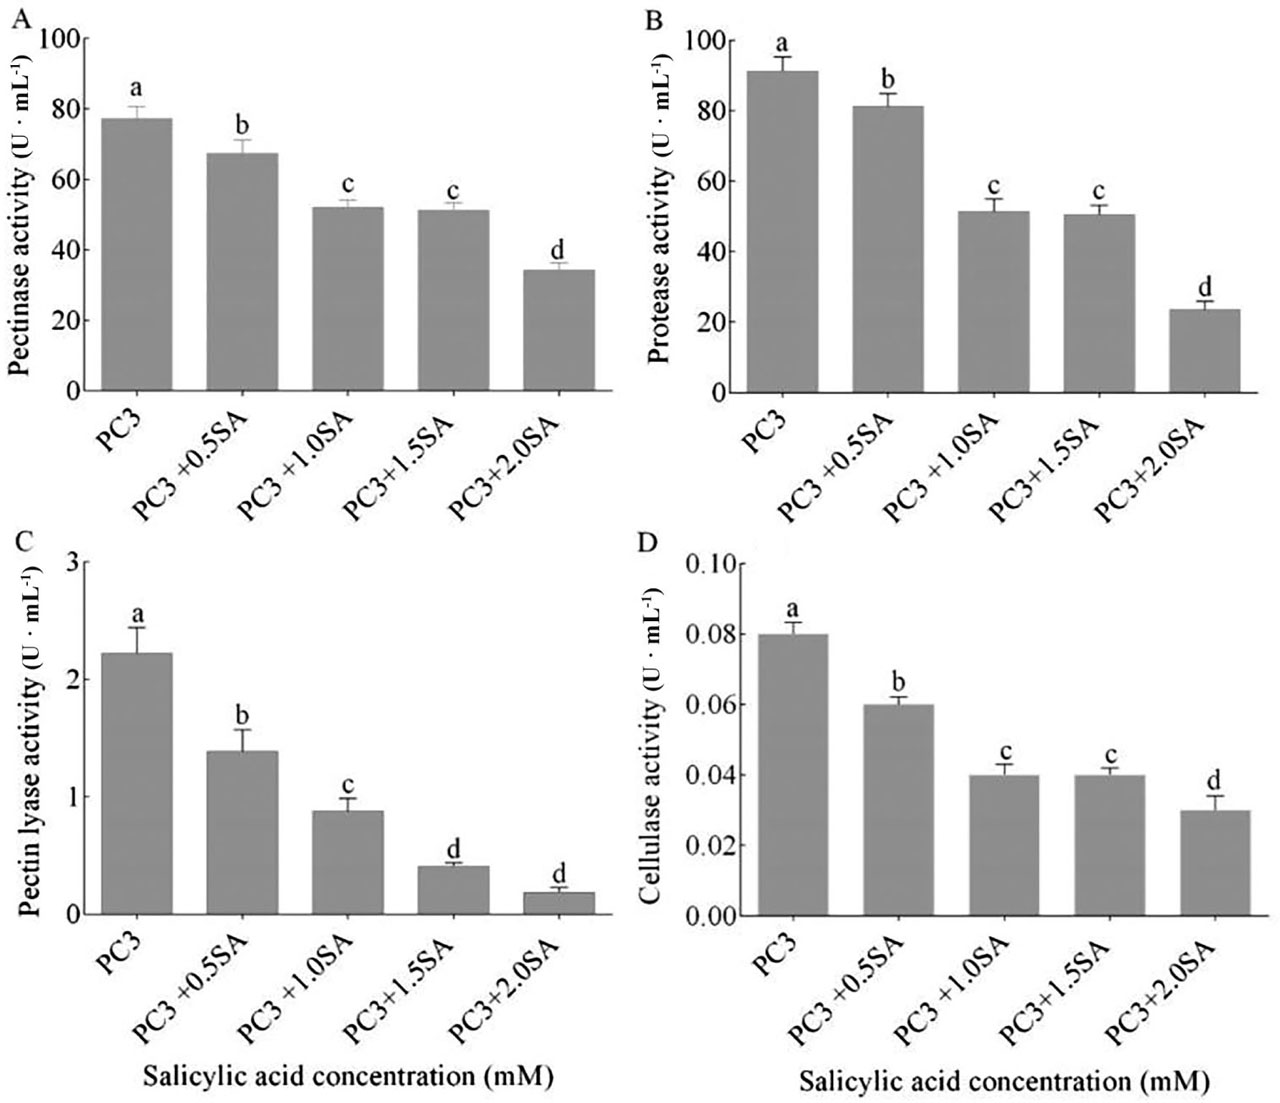
Figure 1
Effect of SA on (A) pectinase, (B) protease, (C) pectin lyase and (D) cellulase production of L. amnigena (Strain PC3) stress. Data are presented as mean ± SE. Different letters indicate a significant difference according to Duncan's multiple range test (p < 0.05). SA, salicylic acid.
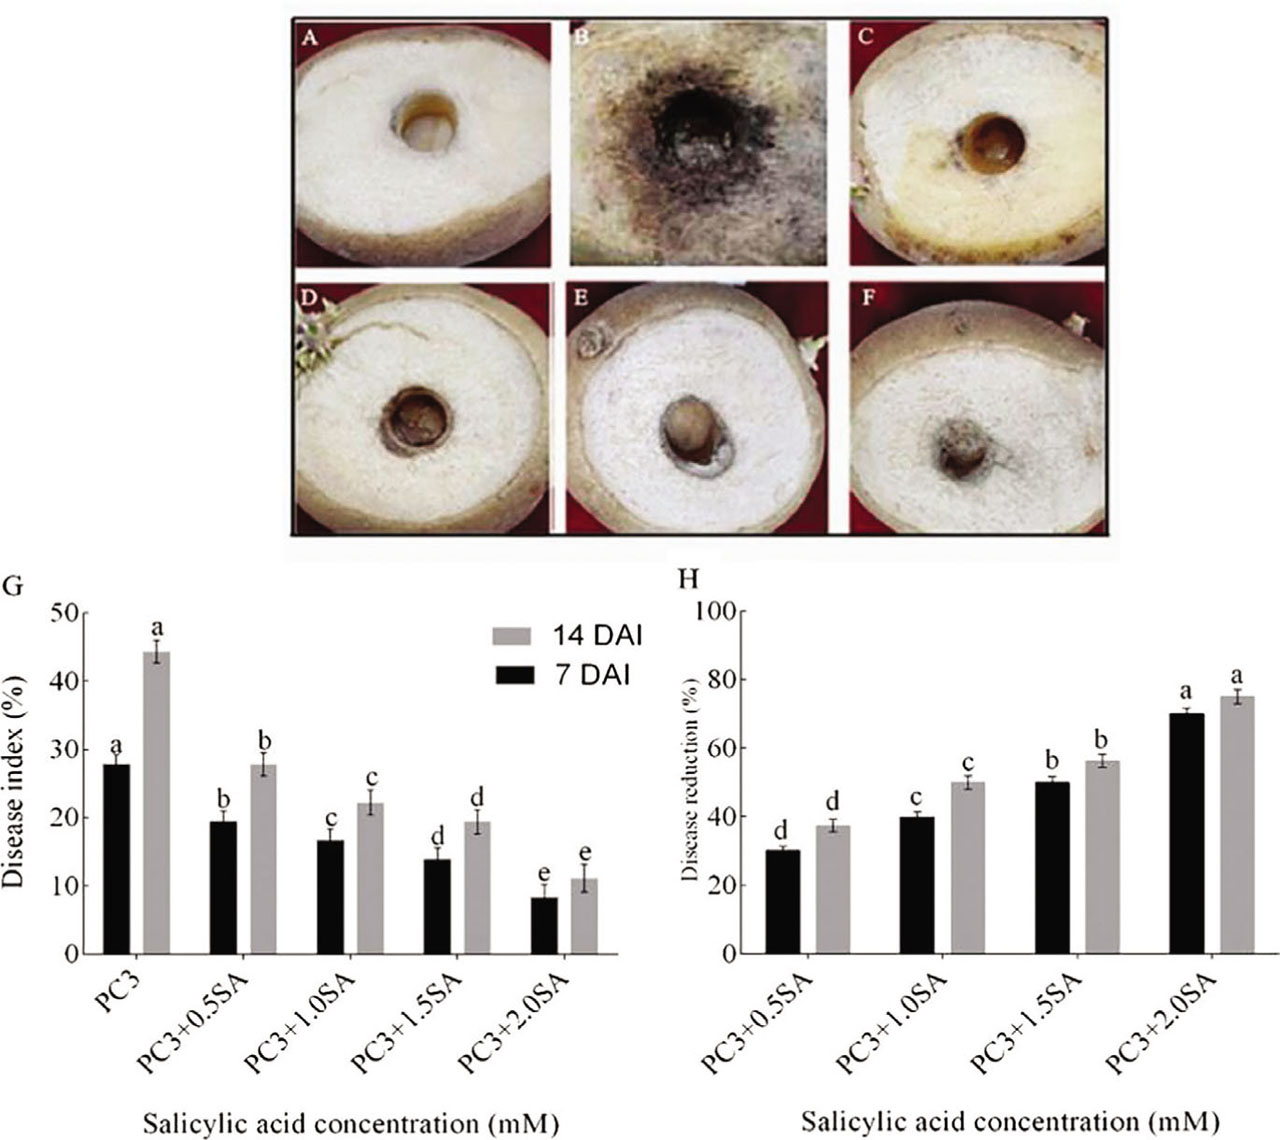
Figure 2
Symptoms of artificial infection with strain PC3 14 DAI. Tubers were treated with SA 24 h before inoculation with strain PC3. (A) Control (CK), (B) strain PC3 (C) 0.5 + PC3, (D) 1.0 + PC3, (E) 1.5 + PC3, (F) 2.0 + PC3. (G) DI (H) Disease reduction. Data are presented as mean ± SE. Different letters indicate a significant difference according to Duncan's multiple range test (p < 0.05). Potato tubers were treated with different concentrations of SA for 24 h before inoculation with strain PC3. The treatments were water (negative control), strain PC3 (positive control), PC3 + 0.5 mM SA, PC3 + 1.0 mM SA, PC3 + 1.5 mM SA, PC3 + 2.0 mM SA. Strain PC3: L. amnigena, DAI. Figure 2A, tuber treated with distilled water showed no signs of rot, Figure 2B tuber inoculated with L. amnigena without SA treatment showed the highest signs of rot. Figure 2C–2F, tubers inoculated with L. amnigena and treated with different concentrations of SA showed minor signs of rot with Figure 2F showing very little sign of rot. DAI, days after inoculation; DI, disease index; SA, salicylic acid.
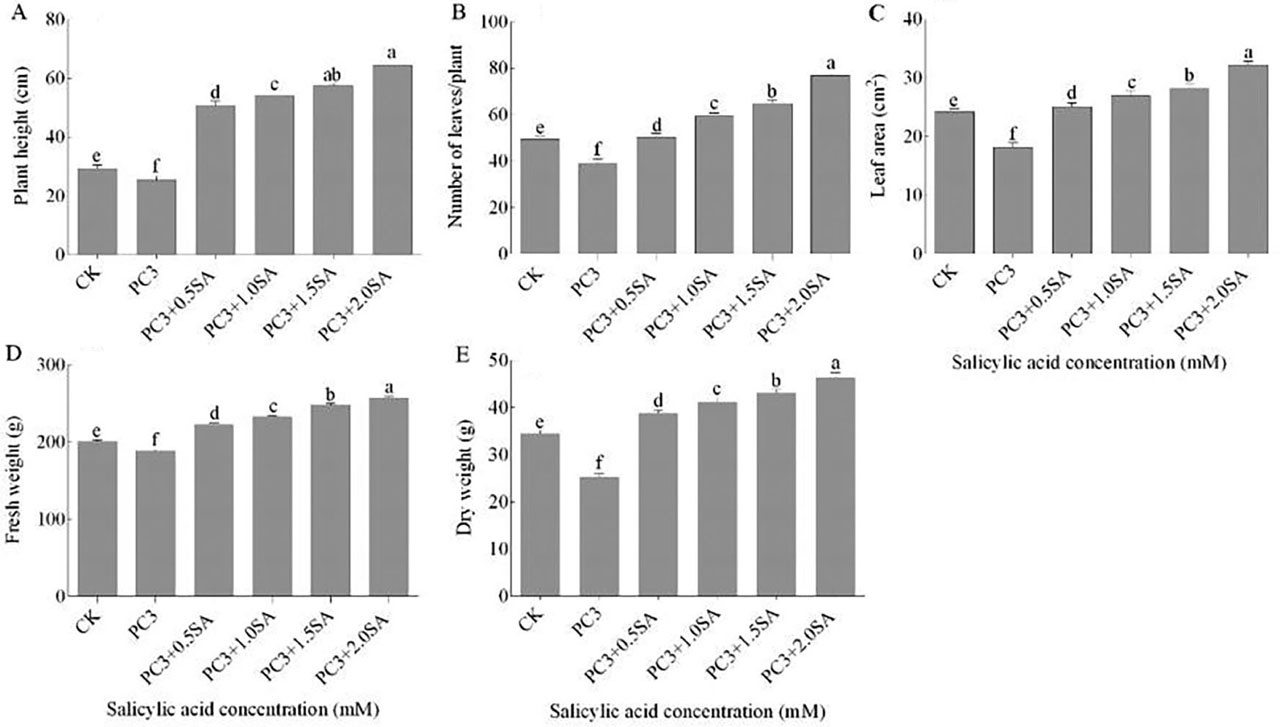
Figure 3
Effect of SA on (A) Plant height, (cm) (B) number of leaves, (C) leaf area (cm2), (D) fresh weight (g) and (E) dry weight (g) under L. amnigena (Strain PC3) stress, where CK represents control treatment with distilled water. Data represent mean ± SE of three replicates. Lower case letters indicate statistical significance between treatments by least significant difference (LSD) test (p < 0.05). SA, salicylic acid.
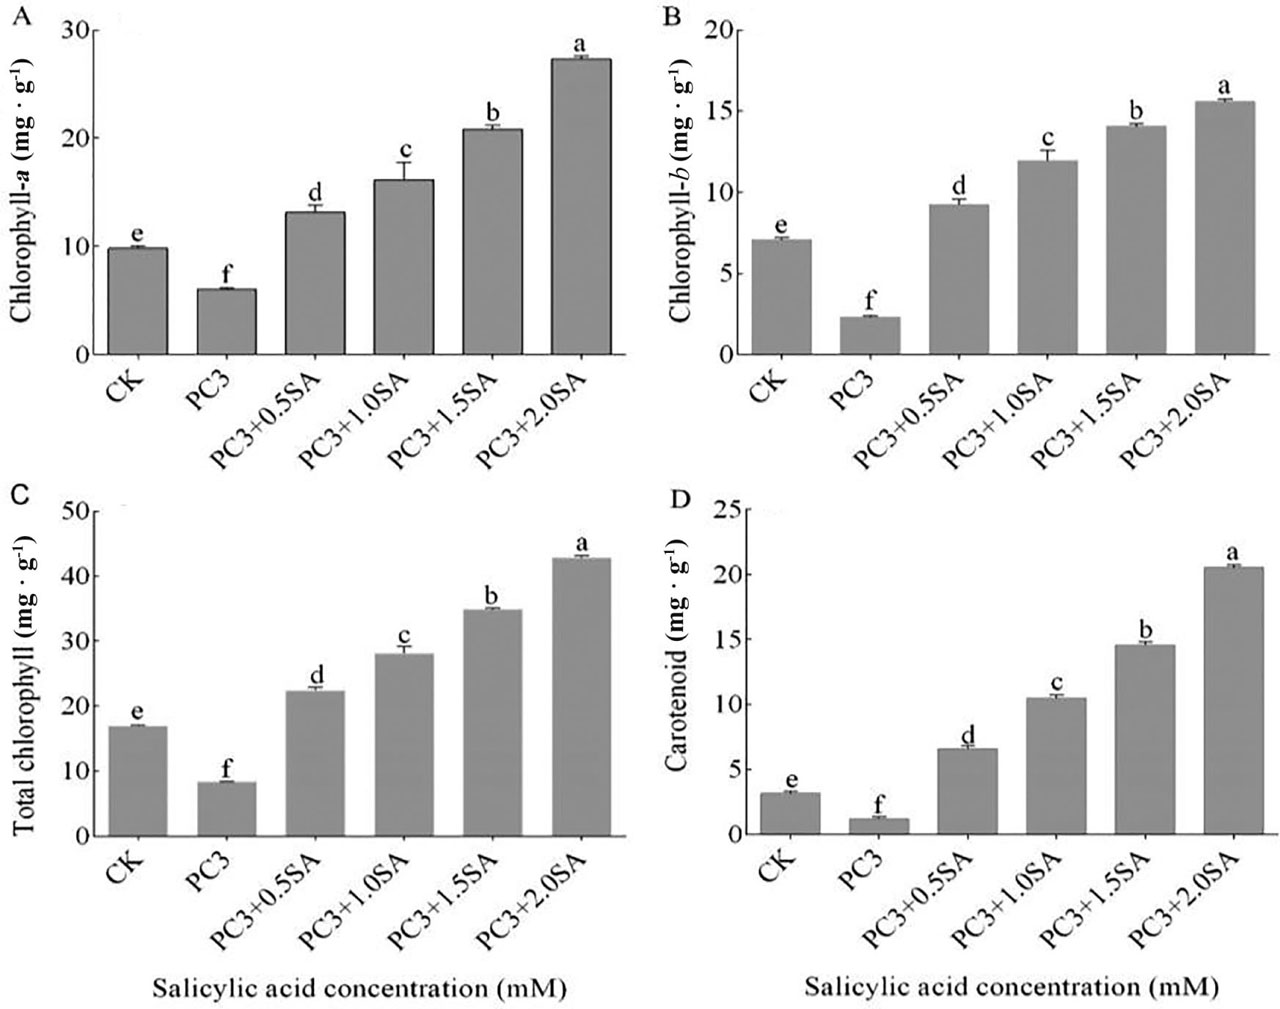
Figure 4
Effect of SA on (A) chlorophyll a (B) chlorophyll b, (C) total chlorophyll a + b, (D) carotenoid under L. amnigena (Strain PC3) stress, where CK represents control treatment with distilled water. Data represent mean ± SE of three replicates. Lower case letters indicate statistical significance between treatments by LSD test (p < 0.05). SA, salicylic acid.
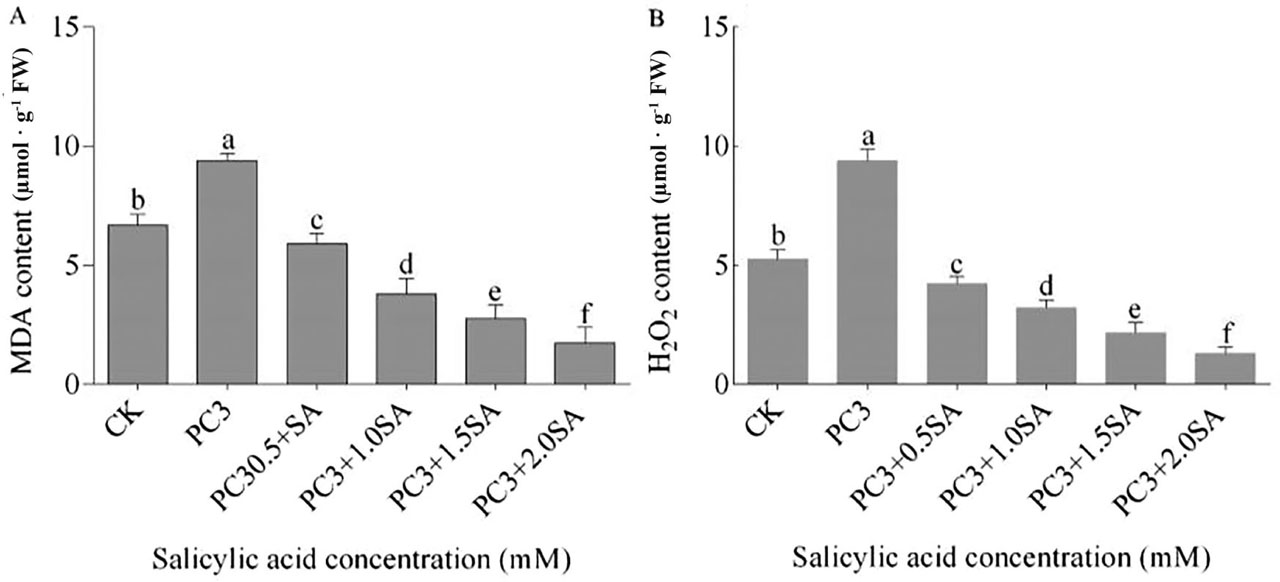
Figure 5
Effect of SA on (A) MDA content, (B) H2O2 content of potato leaves under L. amnigena (Strain PC3) stress, where CK represents control treatment with distilled water. Data represent mean ± SE of three replicates. Lower case letters indicate statistical significance between treatments by LSD test (p < 0.05). H2O2, hydrogen peroxide; MDA, malondialdehyde; SA, salicylic acid.
Table 4
Pearson's correlation matrix among some parameters measured in the plant.
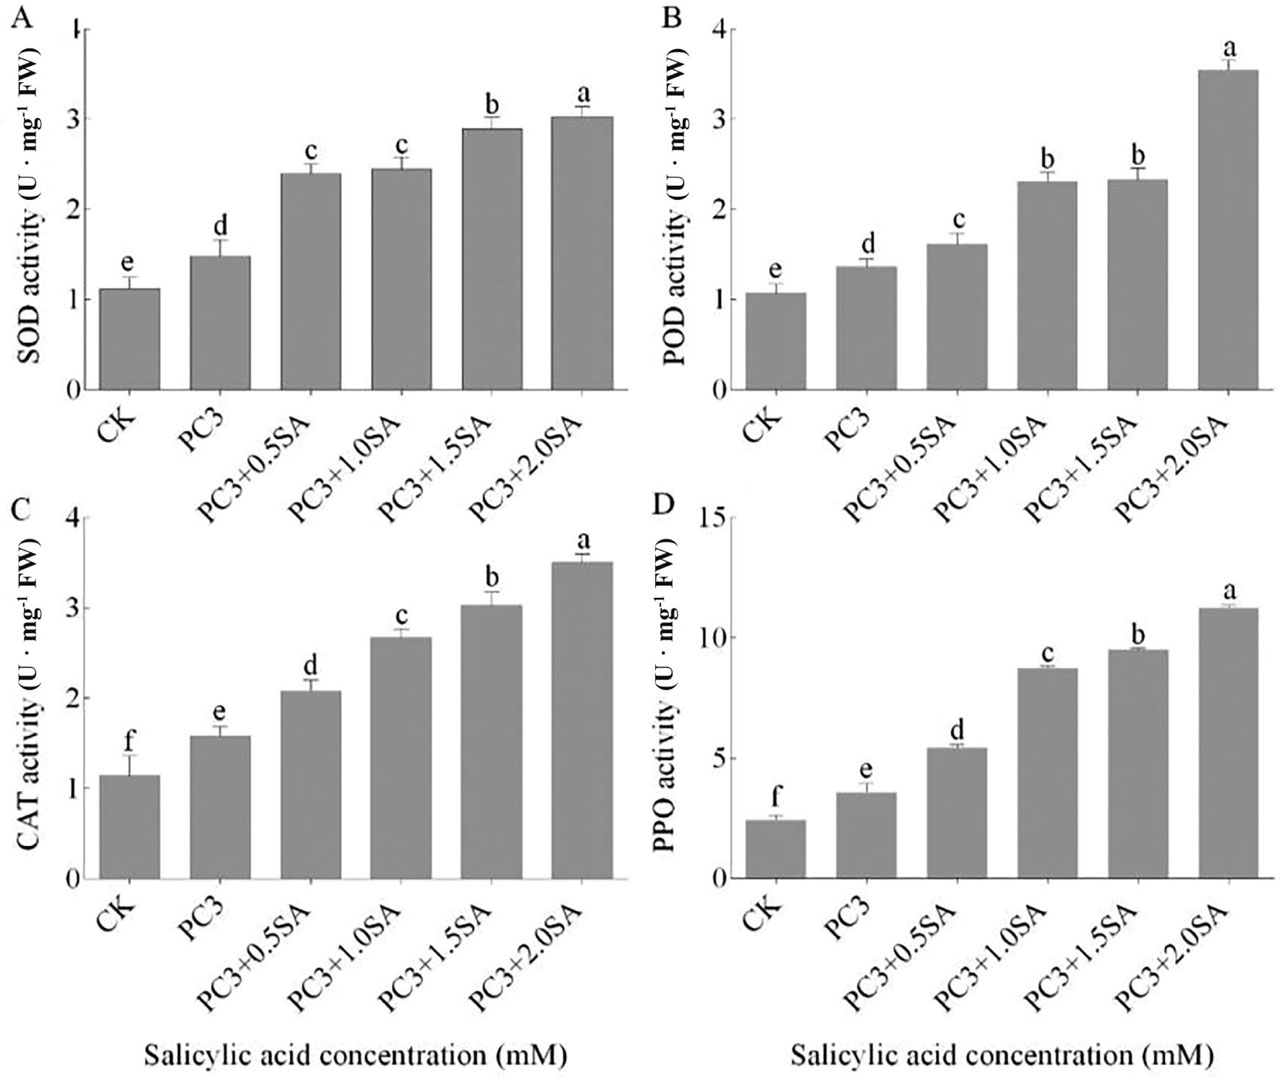
Figure 6
Effect SA on (A) SOD activity, (B) POD activity, (C) CAT activity and (D) PPO activity of potato leaves under L. amnigena (Strain PC3) stress, where CK represents control treatment with distilled water. Data represent mean ± SE of three replicates. Lower case letters indicate statistical significance between treatments by LSD test (p < 0.05). CAT, catalase; POD, peroxide; PPO, polyphenol oxidase; SA, salicylic acid; SOD, superoxide dismutase.
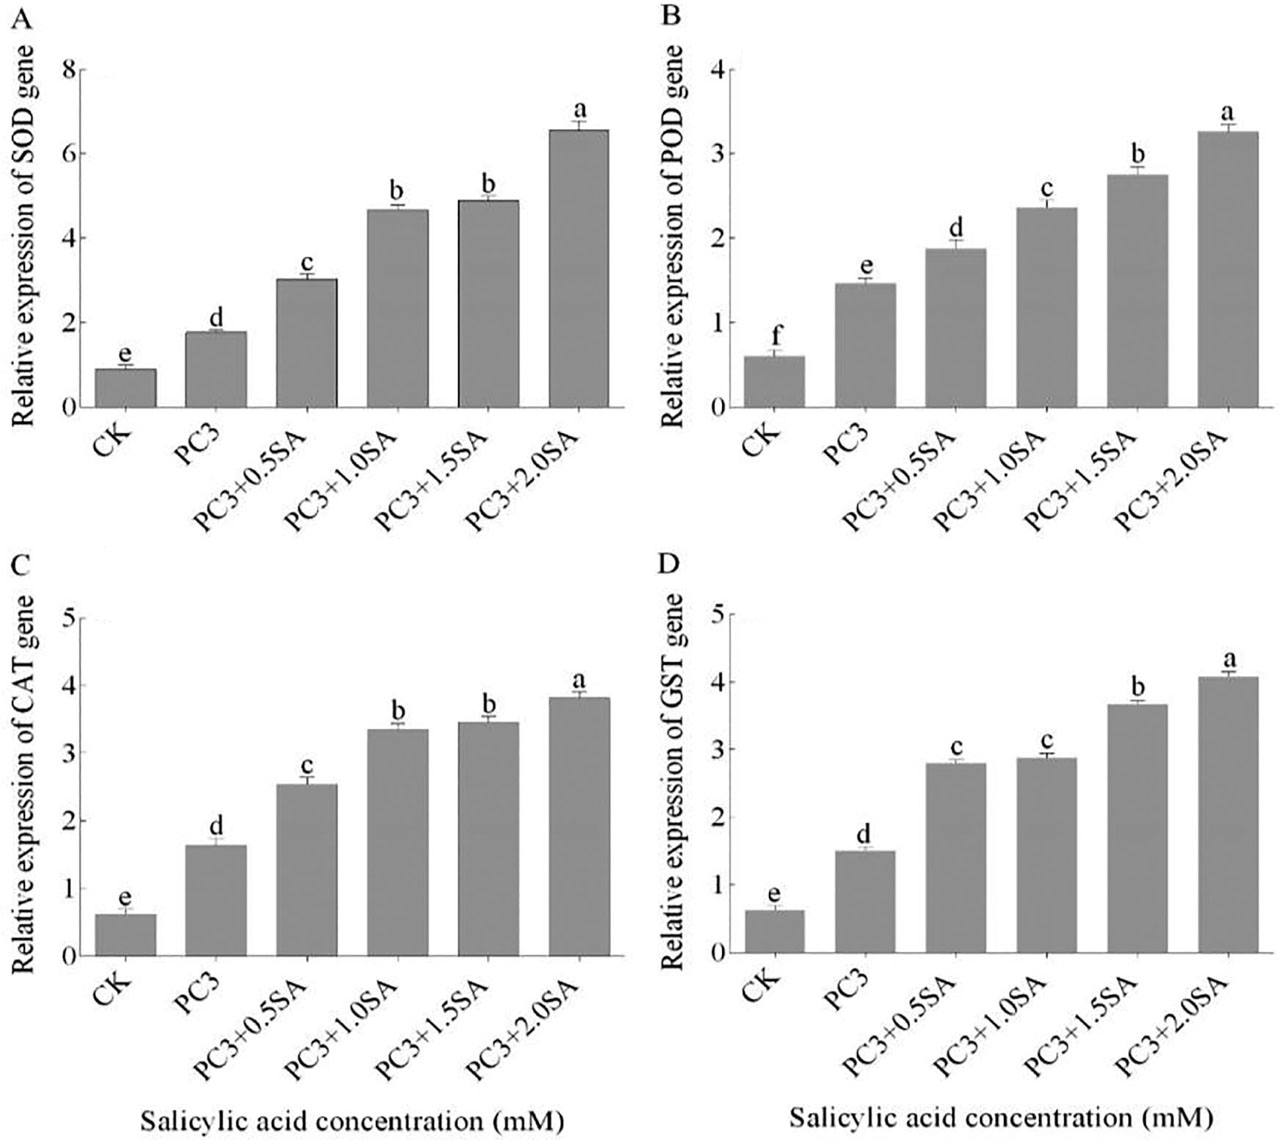
Figure 7
Effect of SA on expression patterns of SOD (A), POD (B), CAT (C), and GST (D) in leaves of potato plants under L. amnigena (Strain PC3) stress, where CK represents control treatment with distilled water. Data represent mean ± SE of three replicates. Lower case letters indicate statistical significance between treatments by LSD test (p < 0.05). CAT, catalase; GST, glutathione S-transferase; POD, peroxide; SA, salicylic acid; SOD, superoxide dismutase.