
Table 1
Composition and concentration of Macro and micro-elements used in modified Hogland solution.
| Macronutrient | g · L−1 | Micronutrient | mg · L−1 |
|---|---|---|---|
| Ca(NO3)2.4H2O | 0.47 | H3BO3 | 2.86 |
| KNO3 | 0.3 | MnCl2 4H2O | 1.81 |
| MgSO4 7H2O | 0.25 | ZnSO4 7H2O | 0.22 |
| NH4H2PO4 | 0.06 | Na2MOO4.2H2O | 0.02 |
| Iron (Fe-EDTA) | 0.1 | CuSO4.5H2O | 0.08 |
Table 2
SiO2-NPs properties.
| SiO2-NPs | |
|---|---|
| Purity | 99+% |
| APS | 20–30 nm |
| SSA | 180–600 m2 · g−1 |
| Colour | White |
| Morphology | Amorphous |
| True density | 2.4 g · cm−3 |
[i] APS, average particle size; SSA, specific surface area.
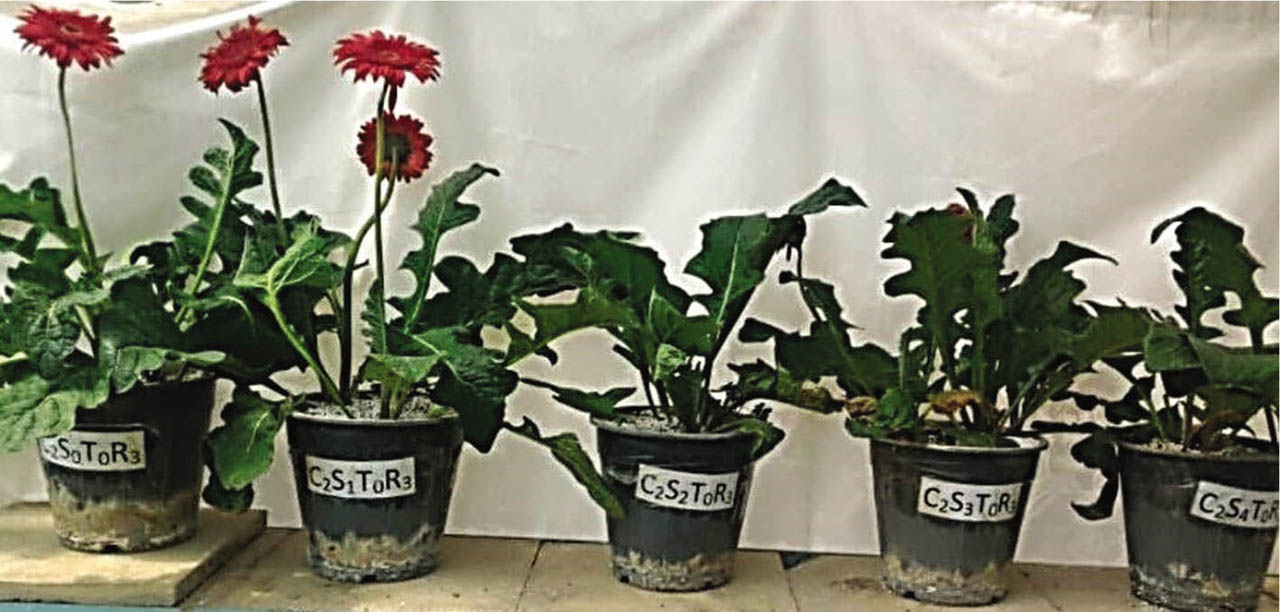
Figure 1
Gerbera cv. ‘Teera Kalina’ under different salinity levels [S0 = 0 mM (control), S1 = 5 mM, S2 = 10 mM, S3 = 20 mM and S4 = 30 mM] sprayed with 25 mg · L−1 SiO2-NPs.
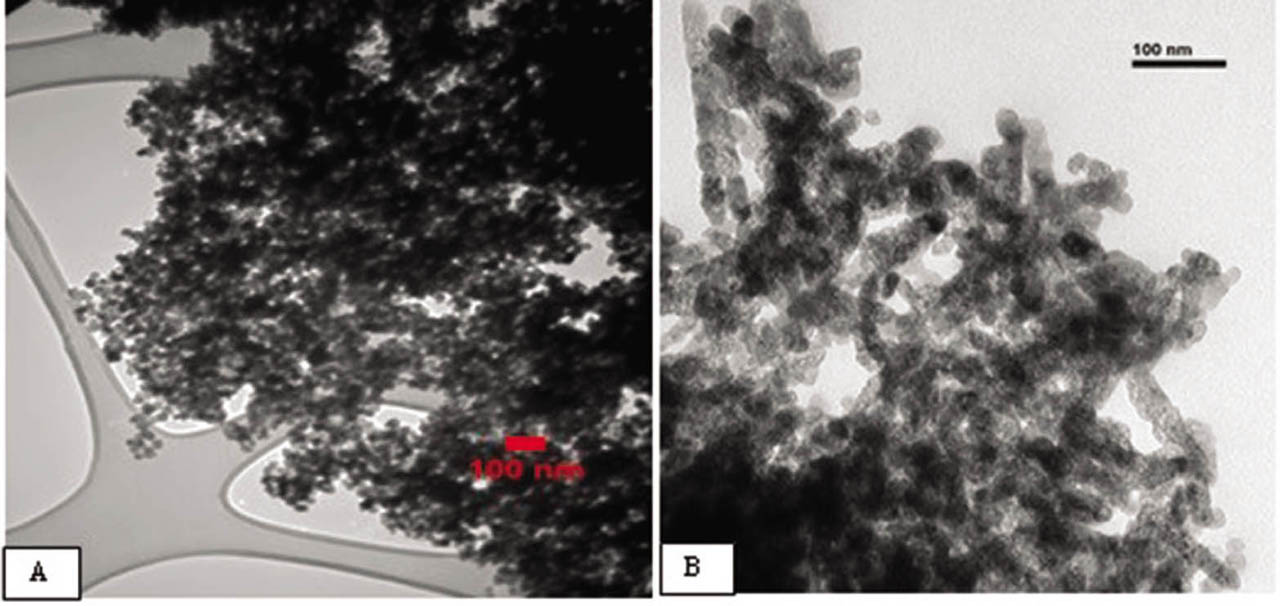
Figure 2
TEM (A) and SEM (B) images of SiO2-NPs.
Table 3
Effect of SiO2-NPs and salt stress on morphological parameters of gerbera cv. ‘Teera Kalina’.
| Treatments | Leaf No. | Flower No. | Plant fresh weight (g) | Plant dry weight (g) | |
|---|---|---|---|---|---|
| Salinity (mM) | SiO2-NPs (mg ·L−1) | ||||
| Control | 0 | 9.33 ± 0.60 ab | 1.56 ± 0.20 abc | 79.33 ± 0.25 a | 29.33 ± 0.25 a |
| 25 | 9.33 ± 0.50 ab | 1.86 ± 0.03 a | 79.93 ± 0.05 a | 29.46 ± 0.45 a | |
| 50 | 9.00 ± 0.50 abc | 1.73 ± 0.03 a | 80.16 ± 0.60 a | 24.50 ± 1.80 bc | |
| 5 | 0 | 8.83 ± 0.70 abc | 1.52 ± 0.20 abc | 77.73 ± 0.15 abc | 3.12 ± 1.70 f |
| 25 | 9.16 ± 0.90 ab | 1.86 ± 0.03 a | 78.90 ± 0.25 ab | 25.90 ± 1.10 ab | |
| 50 | 8.83 ± 0.50 abc | 1.70 ± 0.05 ab | 77.23 ± 0.20 abcd | 24.33 ± 1.30 bc | |
| 10 | 0 | 7.83 ± 0.40 abc | 1.21 ± 0.10 cde | 73.93 ± 0.75 bcdef | 18.26 ± 2.10 de |
| 25 | 9.66 ± 0.95 a | 1.63 ± 0.03 ab | 75.96 ± 0.60 abcde | 21.16 ± 0.90 cd | |
| 50 | 8.16 ± 0.35 abc | 1.33 ± 0.15 bcd | 70.03 ± 0.90 ef | 18.63 ± 0.30 de | |
| 20 | 0 | 7.16 ± 0.30 abc | 0.98 ± 0.04 def | 71.83 ± 0.10 def | 20.83 ± 0.45 cd |
| 25 | 7.66 ± 0.75 abc | 1.20 ± 0.10 cde | 72.80 ± 0.45 cdef | 22.33 ± 0.90 bcd | |
| 50 | 7.50 ± 0.25 abc | 1.00 ± 0.08 def | 71.03 ± 0.40 ef | 26.03 ± 0.40 ab | |
| 30 | 0 | 6.50 ± 0.60 c | 0.70 ± 0.05 f | 64.93 ± 0.90 g | 15.10 ± 0.45 e |
| 25 | 7.66 ± 0.15 abc | 0.90 ± 0.05 ef | 71.83 ± 0.90 def | 16.26 ± 0.60 e | |
| 50 | 7.00 ± 0.60 bc | 0.73 ± 0.03 f | 69.10 ± 0.50 fg | 16.33 ± 0.30 e | |
| Treatments | Stem length (cm) | Stem diameter (mm) | Flower diameter (cm) | Leaf area (cm2) | |
|---|---|---|---|---|---|
| Salinity (mM) | SiO2-NPs (mg · L−1) | ||||
| Control | 0 | 19.00 ± 1.20 a | 0.56 ± 0.03 ab | 4.56 ± 0.40 ab | 228.67 ± 1.85 b |
| 25 | 20.00 ± 0.90 a | 0.60 ± 0.05 a | 5.37 ± 0.10 a | 260.82 ± 1.70 a | |
| 50 | 19.33 ± 0.70 a | 0.50 ± 0.05 abc | 5.36 ± 0.25 ab | 239.09 ± 1.65 ab | |
| 5 | 0 | 14.33 ± 0.90 ab | 0.46 ± 0.03 abcd | 5.65 ± 0.50 ab | 176.03 ± 1.70 c |
| 25 | 19.66 ± 0.90 a | 0.46 ± 0.03 abcd | 6.04 ± 0.15 a | 213.08 ± 1.50 c | |
| 50 | 18.33 ± 0.85 a | 0.43 ± 0.03 bcde | 5.31 ± 0.10 ab | 184.53 ± 1.90 c | |
| 10 | 0 | 13.00 ± 0.50 ab | 0.33 ± 0.03 defg | 4.43 ± 0.30 ab | 136.91 ± 1.50 d |
| 25 | 14.66 ± 0.90 ab | 0.36 ± 0.03 cdef | 5.29 ± 0.50 ab | 144.92 ± 1.70 d | |
| 50 | 13.66 ± 0.75 ab | 0.33 ± 0.03 defg | 4.85 ± 0.07 ab | 143.62 ± 1.90 d | |
| 20 | 0 | 11.66 ± 0.90 ab | 0.26 ± 0.02 fghi | 3.46 ± 0.90 b | 90.41 ± 2.20 ef |
| 25 | 14.16 ± 0.90 ab | 0.30 ± 0.05 efgh | 5.08 ± 0.40 ab | 95.73 ± 1.80 e | |
| 50 | 12.83 ± 0.35 ab | 0.30 ± 0.05 defg | 4.50 ± 0.90 ab | 92.43 ± 1.50 ef | |
| 30 | 0 | 6.66 ± 0.90 b | 0.13 ± 0.03 i | 3.40 ± 0.30 b | 65.74 ± 1.75 f |
| 25 | 12.33 ± 0.30 ab | 0.20 ± 0.05 ghi | 4.22 ± 0.10 ab | 82.20 ± 1.40 ef | |
| 50 | 11.33 ± 0.30 ab | 0.16 ± 0.03 hi | 3.60 ± 0.01 b | 77.90 ± 0.85 ef | |
[i] Values represent means ± standard errors of three independent replications (n = 3).
[ii] Different letters within the same column indicate significant differences at p < 0.05 among the treatments, according to Duncan's multiple range tests.
Table 4
Effect of SiO2-NPs and salt stress on physiological and biochemical traits of gerbera cv. ‘Teera Kalina’.
| Treatments | MSI (%) | EL | RWC | |
|---|---|---|---|---|
| Salinity (mM) | SiO2-NPs (mg · L−1) | |||
| Control | 0 | 93.13 ± 0.10 a | 32.92 ± 0.90 fg | 89.23 ± 0.23 ab |
| 25 | 75.08 ± 0.95 cd | 31.52 ± 0.72 g | 90.16 ± 0.13 a | |
| 50 | 72.26 ± 0.90 cde | 31.73 ± 0.44 g | 89.83 ± 0.82 a | |
| 5 | 0 | 81.87 ± 0.90 b | 36.41 ± 0.01 ef | 86.07 ± 0.16 cd |
| 25 | 77.54 ± 0.90 bc | 34.07 ± 0.02 fg | 87.23 ± 0.40 bc | |
| 50 | 70.78 ± 0.95 defg | 33.98 ± 0.02 fg | 85.56 ± 0.61 cd | |
| 10 | 0 | 71.46 ± 0.70 defg | 39.66 ± 0.70 de | 82.60 ± 0.32 ef |
| 25 | 69.22 ± 0.20 efgh | 35.75 ± 0.30 f | 84.63 ± 0.31 de | |
| 50 | 71.61 ± 0.80 def | 39.59 ± 0.90 de | 81.73 ± 0.90 f | |
| 20 | 0 | 68.86 ± 0.35 efgh | 51.44 ± 0.75 b | 80.83 ± 0.37 fg |
| 25 | 66.41 ± 0.30 efgh | 45.70 ± 0.90 c | 82.46 ± 0.75 ef | |
| 50 | 65.27 ± 0.90 gh | 41.50 ± 0.70 d | 81.03 ± 0.39 fg | |
| 30 | 0 | 65.59 ± 0.90 fgh | 60.41 ± 0.40 a | 67.60 ± 0.24 i |
| 25 | 63.49 ± 0.70 h | 46.33 ± 0.90 c | 78.83 ± 0.62 g | |
| 50 | 63.73 ± 0.45 h | 46.23 ± 0.60 c | 74.24 ± 0.90 h | |
| Treatments | SPAD | Proline (mmol · g−1) | Protein (mg · g−1 FW) | |
|---|---|---|---|---|
| Salinity (mM) | SiO2-NPs (mg · L−1) | |||
| Control | 0 | 76.40 ± 0.19 ab | 2.74 ± 0.24 e | 0.24 ± 0.009 a |
| 25 | 77.43 ± 0.20 a | 4.52 ± 0.34 e | 0.25 ± 0.002 a | |
| 50 | 78.40 ± 0.14 a | 4.40 ± 0.50 e | 0.25 ± 0.005 a | |
| 5 | 0 | 74.63 ± 0.40 ab | 3.63 ± 0.45 e | 0.23 ± 0.007 ab |
| 25 | 75.90 ± 0.50 ab | 7.30 ± 0.45 e | 0.25 ± 0.010 a | |
| 50 | 76.23 ± 0.11 ab | 7.51 ± 0.50 e | 0.22 ± 0.004 bc | |
| 10 | 0 | 65.93 ± 0.94 abc | 13.27 ± 0.43 d | 0.18 ± 0.002 def |
| 25 | 70.30 ± 0.86 abc | 15.81 ± 0.11 d | 0.21 ± 0.002 c | |
| 50 | 66.93 ± 0.70 abc | 13.88 ± 0.07 d | 0.19 ± 0.009 cde | |
| 20 | 0 | 65.23 ± 0.21 abc | 31.41 ± 0.90 ab | 0.17 ± 0.007 ef |
| 25 | 63.06 ± 0.22 bc | 29.95 ± 0.90 b | 0.20 ± 0.002 cd | |
| 50 | 58.13 ± 0.12 cd | 23.44 ± 0.873 c | 0.20 ± 0.005 cd | |
| 30 | 0 | 46.43 ± 0.91 d | 36.49 ± 0.01 a | 0.11 ± 0.004 h |
| 25 | 56.90 ± 0.82 cd | 35.56 ± 0.20 a | 0.14 ± 0.002 g | |
| 50 | 56.36 ± 0.72 cd | 32.41 ± 0.39 ab | 0.16 ± 0.002 fg | |
[i] Values represent means ± standard errors of three independent replications (n = 3).
[ii] Different letters within the same column indicate significant differences at p < 0.05 among the treatments, according to Duncan's multiple range test.
[iii] EL, electrolyte leakage; MSI, membrane stability index; RWC, relative water contents.
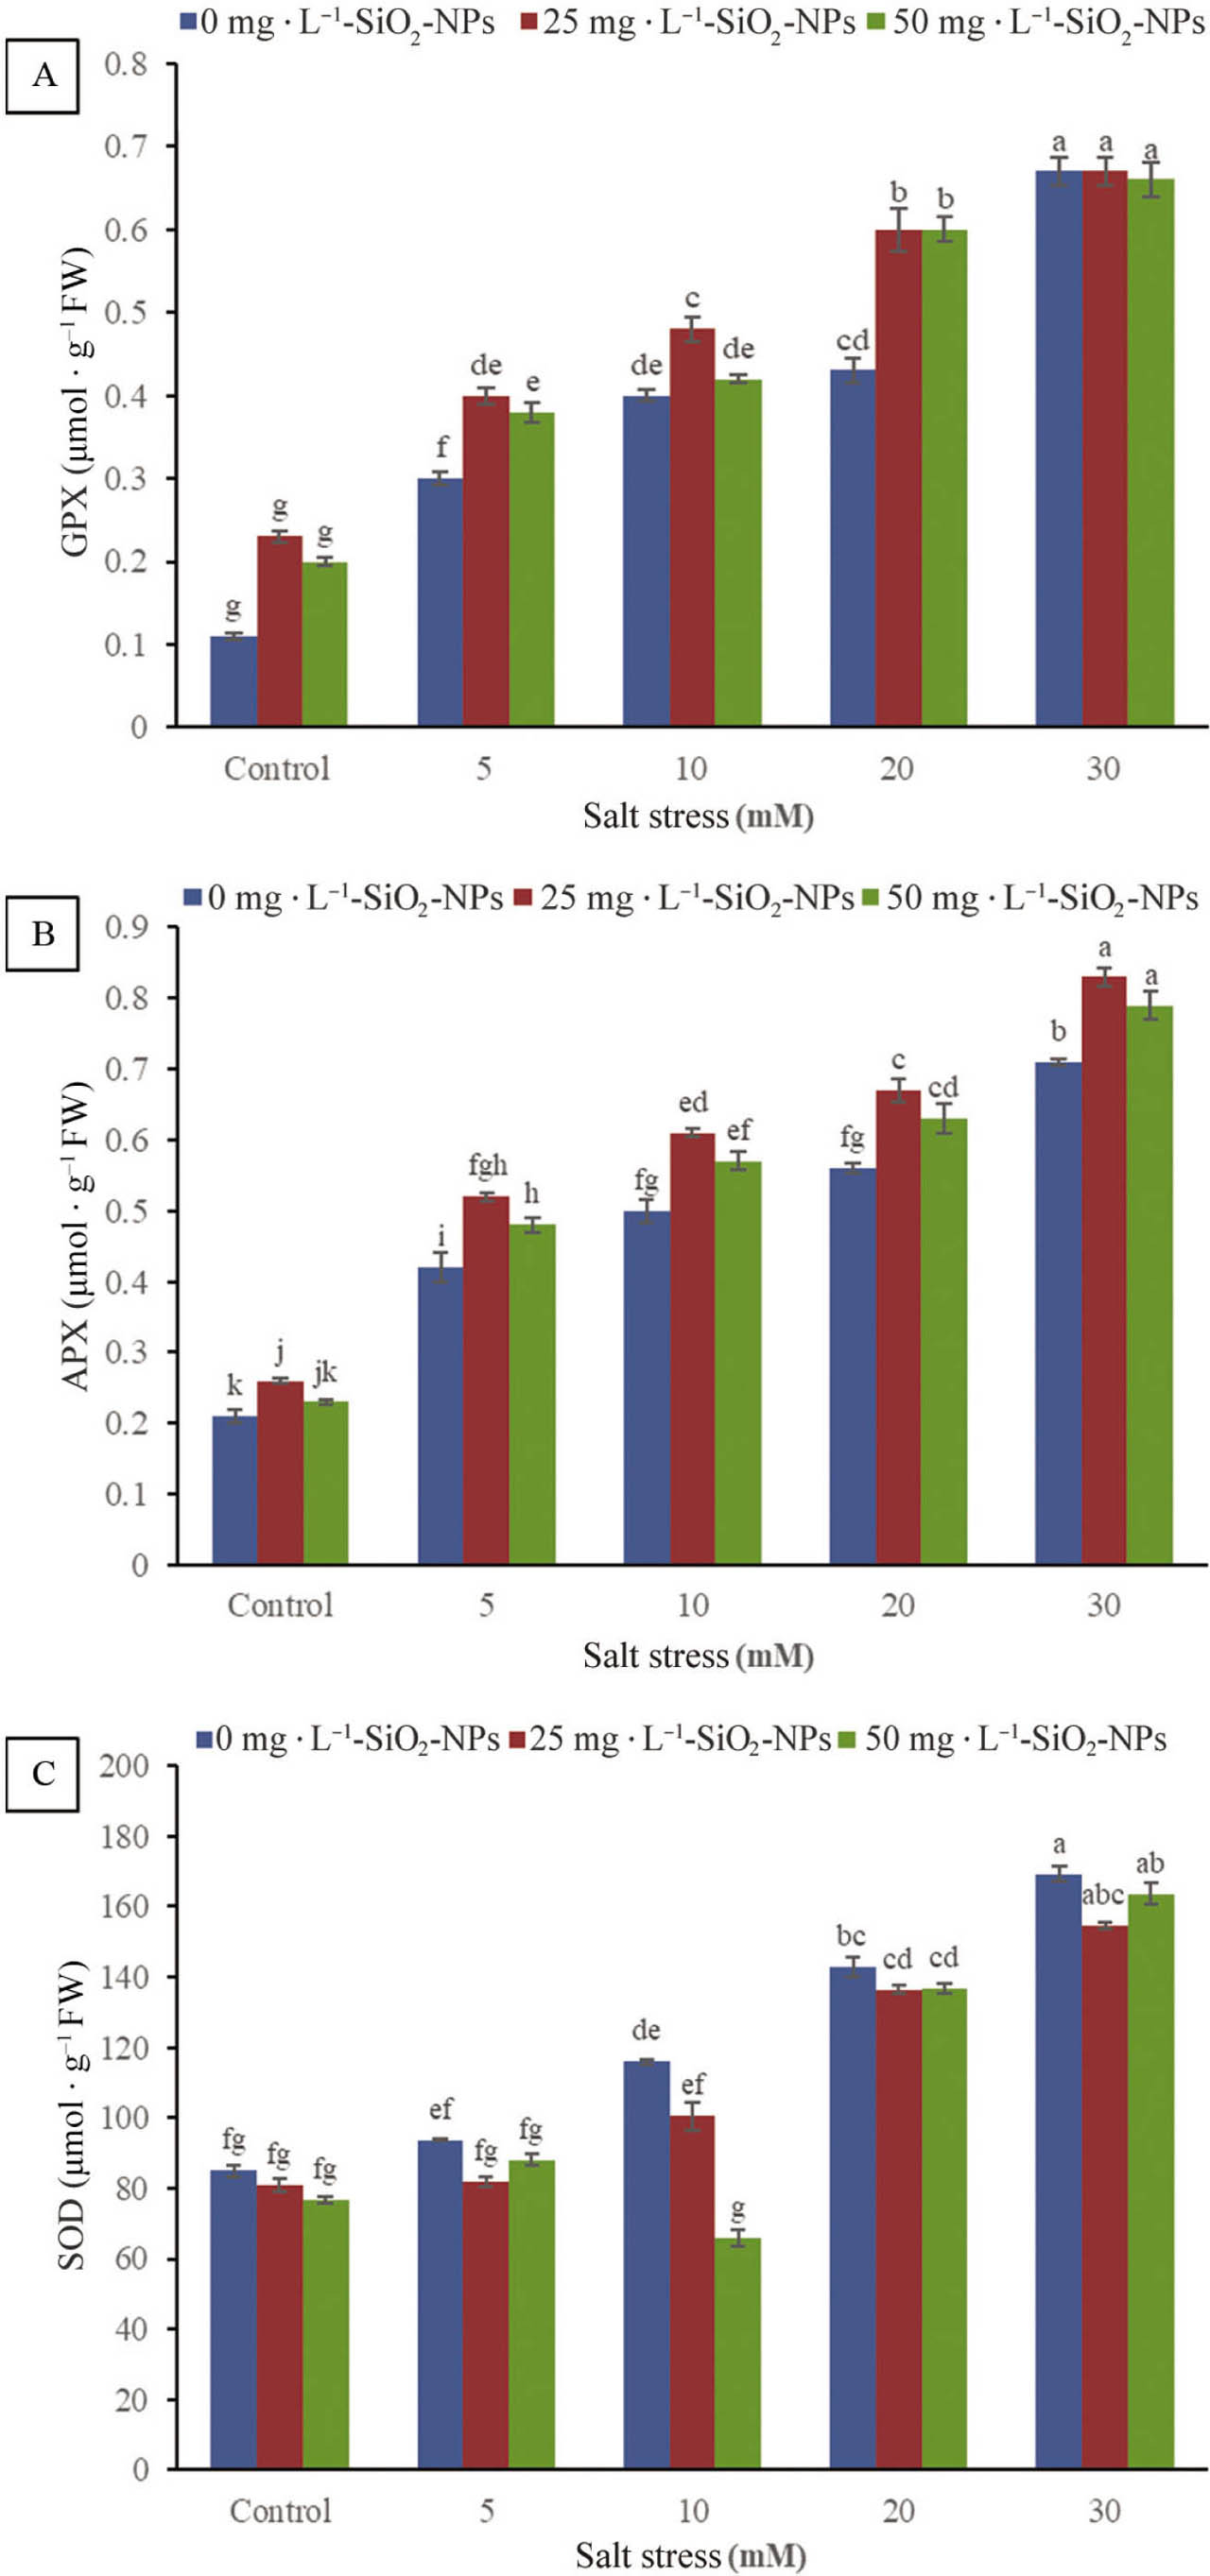
Figure 3
Effect of SiO2-NPs and salt stress on GPX (A), APX (B) and SOD (C) activity in gerbera cv. ‘Teera Kalina’ leaves. APX, ascorbate peroxidase; GPX, guaiacol peroxidase; SOD, superoxide dismutase.
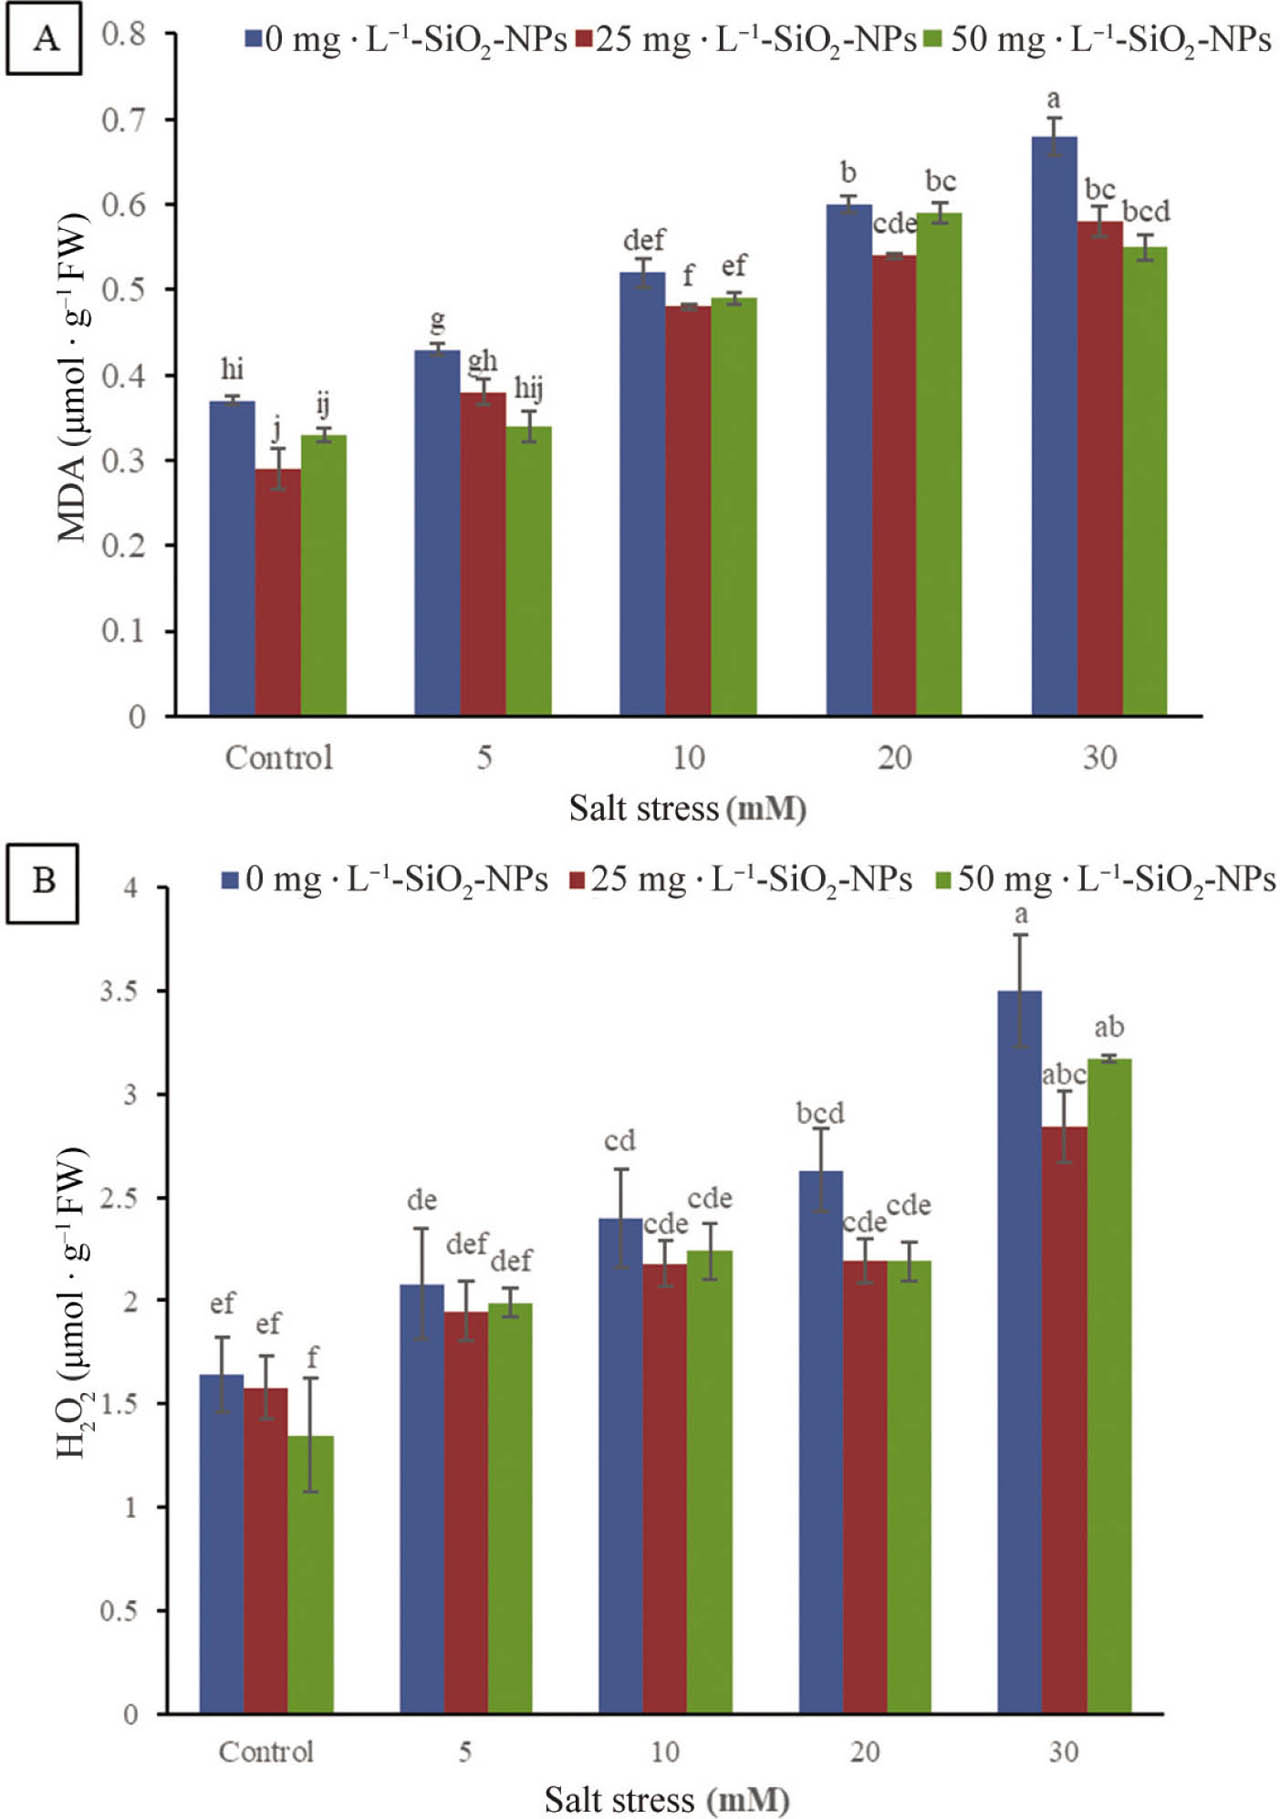
Figure 4
Effect of SiO2-NPs and salt stress on MDA (A) and H2O2 (B) in gerbera cv. ‘Teera Kalina’ leaves. H2O2, hydrogen peroxide; MDA, malondialdehyde.
Table 5
Effect of SiO2-NPs and salt stress on nutrient uptake of gerbera cv. ‘Teera Kalina’.
| Treatments | Ca2+ (g · 100 g−1 FW) | K+ (g · 100 g−1 FW) | Na+ (g · 100 g−1 FW) | |
|---|---|---|---|---|
| Salinity (mM) | SiO2-NPs (mg · L−1) | |||
| Control | 0 | 2.38 ± 0.07 cd | 1.77 ± 0.04 bc | 0.89 ± 0.02 h |
| 25 | 2.69 ± 0.01 b | 2.33 ± 0.06 a | 0.64 ± 0.04 i | |
| 50 | 2.94 ± 0.02 a | 1.86 ± 0.01 b | 0.70 ± 0.02 i | |
| 5 | 0 | 2.22 ± 0.04 de | 1.69 ± 0.02 c | 1.72 ± 0.03 f |
| 25 | 2.42 ± 0.05 c | 1.71 ± 0.02 c | 1.24 ± 0.01 g | |
| 50 | 2.45 ± 0.05 c | 1.86 ± 0.04 b | 1.29 ± 0.01 g | |
| 10 | 0 | 2.11 ± 0.04 e | 1.23 ± 0.04 e | 2.28 ± 0.01 d |
| 25 | 2.20 ± 0.04 de | 1.46 ± 0.03 d | 1.96 ± 0.07 e | |
| 50 | 2.15 ± 0.08 e | 1.50 ± 0.05 d | 2.49 ± 0.03 c | |
| 20 | 0 | 1.55 ± 0.04 f | 1.01 ± 0.04 fg | 2.63 ± 0.06 c |
| 25 | 1.59 ± 0.02 f | 1.28 ± 0.02 e | 2.21 ± 0.03 d | |
| 50 | 1.72 ± 0.03 f | 1.02 ± 0.03 fg | 2.23 ± 0.04 d | |
| 30 | 0 | 0.91 ± 0.08 h | 0.85 ± 0.01 h | 3.17 ± 0.03 a |
| 25 | 1.14 ± 0.06 g | 1.08 ± 0.05 f | 2.97 ± 0.05 b | |
| 50 | 1.31 ± 0.02 g | 0.93 ± 0.03 gh | 2.50 ± 0.08 c | |
| Treatments | Ca2+/K+ | Ca2+/Na+ | K+/Na+ | |
|---|---|---|---|---|
| Salinity (mM) | SiO2-NPs (mg · L−1) | |||
| Control | 0 | 1.35 ± 0.05 cdef | 2.68 ± 0.07 b | 1.99 ± 0.11 c |
| 25 | 1.16 ± 0.04 fg | 4.22 ± 0.09 a | 3.66 ± 0.32 a | |
| 50 | 1.57 ± 0.01 ab | 4.17 ± 0.08 a | 2.65 ± 0.09 b | |
| 5 | 0 | 1.31 ± 0.04 def | 1.29 ± 0.05 de | 0.98 ± 0.02 e |
| 25 | 1.42 ± 0.04 bcde | 1.94 ± 0.07 c | 1.37 ± 0.04 d | |
| 50 | 1.31 ± 0.01 def | 1.89 ± 0.06 c | 1.44 ± 0.04 d | |
| 10 | 0 | 1.72 ± 0.05 a | 0.92 ± 0.03 ef | 0.53 ± 0.02 fg |
| 25 | 1.51 ± 0.02 abcd | 1.12 ± 0.04 de | 0.75 ± 0.04 ef | |
| 50 | 1.45 ± 0.09 bcde | 0.86 ± 0.03 efg | 0.60 ± 0.02 fg | |
| 20 | 0 | 1.54 ± 0.02 abc | 0.59 ± 0.01 fghi | 0.38 ± 0.02 fg |
| 25 | 1.24 ± 0.03 efg | 0.72 ± 0.02 fgh | 0.58 ± 0.02 fg | |
| 50 | 1.69 ± 0.06 a | 0.77 ± 0.02 efg | 0.45 ± 0.01 fg | |
| 30 | 0 | 1.06 ± 0.09 g | 0.28 ± 0.03 i | 0.26 ± 0.01 g |
| 25 | 1.07 ± 0.09 g | 0.38 ± 0.02 hi | 0.37 ± 0.03 g | |
| 50 | 1.41 ± 0.04 bcde | 0.52 ± 0.03 ghi | 0.37 ± 0.02 g | |
[i] Values represent means ± standard errors of three independent replications (n = 3).
[ii] Different letters within the same column indicate significant differences at p < 0.05 among the treatments, according to Duncan's multiple range test.
[iii] Ca2+, calcium; K+, potassium; Na+, sodium.
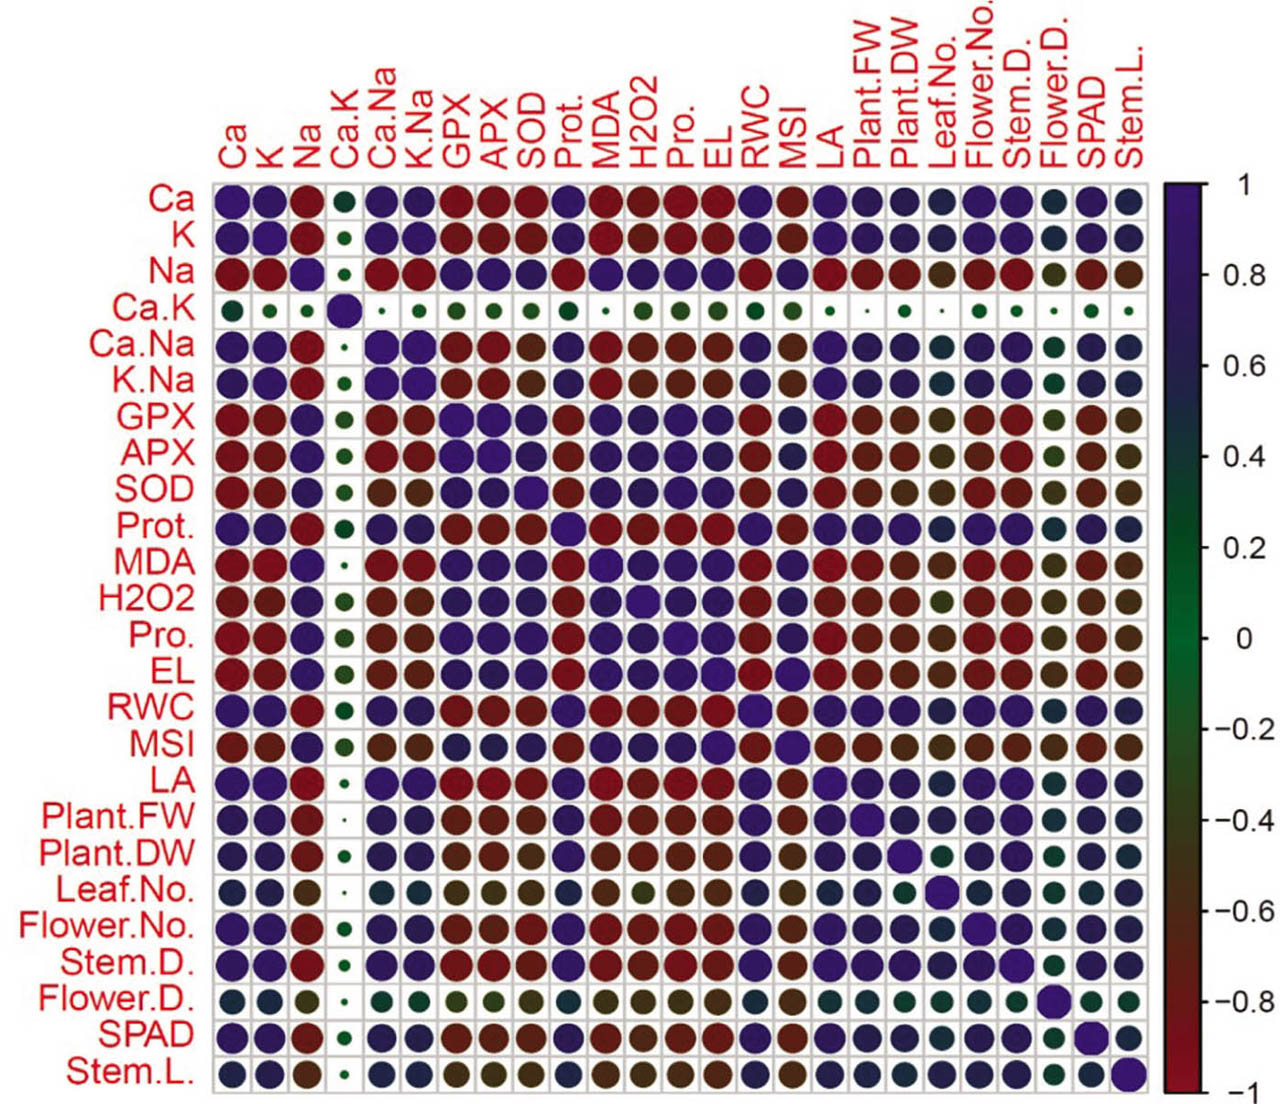
Figure 5
Pearson correlation analysis of SiO2-NPs treatment and variable trait relationship in gerbera plants grown under non-saline and different saline conditions. Heatmap of Pearson correlation coefficient (r) values of variable traits, where the coloured scale indicates the positive (blue) or negative (red) correlation and the ‘r’ coefficient values (r = −1.0 to 1.0). The tested variables included are APX, ascorbate peroxidase; Ca2+, calcium; EL, electrolyte leakage; Flower D., flower diameter; Flower No., flower number; GPX, guaiacol peroxidase; H2O2, hydrogen peroxidase; LA, leaf area; Leaf No., leaf number; MDA, malondialdehyde; MSI, membrane stability index; Plant DW, plant dry weight; Plant FW, plant fresh weight; K+, potassium; Pro, proline; Pro, protein; RWC, relative water content; Na+, sodium; Stem D., stem diameter; Stem L., stem length; SOD, superoxide dismutase.