
Table 1
Effect of SA treatments on fruit weight (g), fruit width (mm) and fruit length (mm) values
Table 2
Effect of SA treatments on TSS, TA content and pH value at harvest and after storage plus 2-day shelf life
| Application | TSS (%) | TA (g malic acid · 100 mL−1) | pH | |||
|---|---|---|---|---|---|---|
| Harvest | Shelf life | Harvest | Shelf life | Harvest | Shelf life | |
| Control | 11.80 ns | 12.46 ns | 0.65 bz, * | 0.55 b* | 4.26 ns | 4.49 ns |
| 1 mM SA | 12.00 | 12.56 | 0.78 a | 0.61 ab | 4.25 | 4.42 |
| 2 mM SA | 12.00 | 12.86 | 0.80 a | 0.69 a | 4.25 | 4.29 |
Lettering is done according to the SPPSS program.
z differences between averages in each column were determined by the Duncan test according to p ≤ 0.05.
{ label (or @symbol) needed for fn[@id='j_fhort-2020-0020_table-fn_003_w2aab3b7c63b1b6b1ab1b2b4b3ab2Aa'] } ns,* non-significant and significant at p ≤ 0.05, respectively.
SA, salicylic acid; TSS, total soluble solid; TA, titratable acidity.
Table 3
Effect of pre-harvest SA treatments on the fruit skin L*, a* and b* values of peach fruits at harvest and after storage plus 2-day shelf life
| Applications | L* value | a* value | b* value | |||
|---|---|---|---|---|---|---|
| Harvest | Shelf life | Harvest | Shelf life | Harvest | Shelf life | |
| Control | 63.76 ns | 64.20 ns | 20.32 ns | 27.88 ns | 44.10 ns | 46.03 ns |
| 1 mM SA | 57.24 | 58.65 | 18.41 | 25.01 | 39.49 | 41.84 |
| 2 mM SA | 57.96 | 59.02 | 17.23 | 24.45 | 36.76 | 39.90 |
[i] ns, non-significant.
[ii] SA, salicylic acid.
Table 4
Effect of pre-harvest SA treatments on the fruit L*, a* and b* values of peach fruits at harvest and after storage plus 2-day shelf life 20°C
| Applications | L* value | a* value | b* value | |||
|---|---|---|---|---|---|---|
| Harvest | Shelf life | Harvest | Shelf life | Harvest | Shelf life | |
| Control | 74.43ns | 64.58 cz,* | 1.42 ns | 7.54 a* | 64.94 a* | 61.57 ns |
| 1 mM SA | 71.88 | 69.23 b | −0.28 | 4.93 b | 63.26 ab | 61.36 |
| 2 mM SA | 74.62 | 72.26 a | −0.46 | 3.81 b | 61.95 b | 58.63 |
Lettering is done according to the SPPSS program.
z differences between averages in each column were determined by the Duncan test according to p ≤ 0.05.
{ label (or @symbol) needed for fn[@id='j_fhort-2020-0020_table-fn_005_w2aab3b7c63b1b6b1ab1b2c10b3ab2Aa'] } ns,* non-significant and significant at p ≤ 0.05, respectively.
SA, salicylic acid.
Table 5
Effect of different concentrations of SA treatments before harvest and storage of the total phenolic content and antioxidant activity in the ‘Cresthaven’ peach varieties
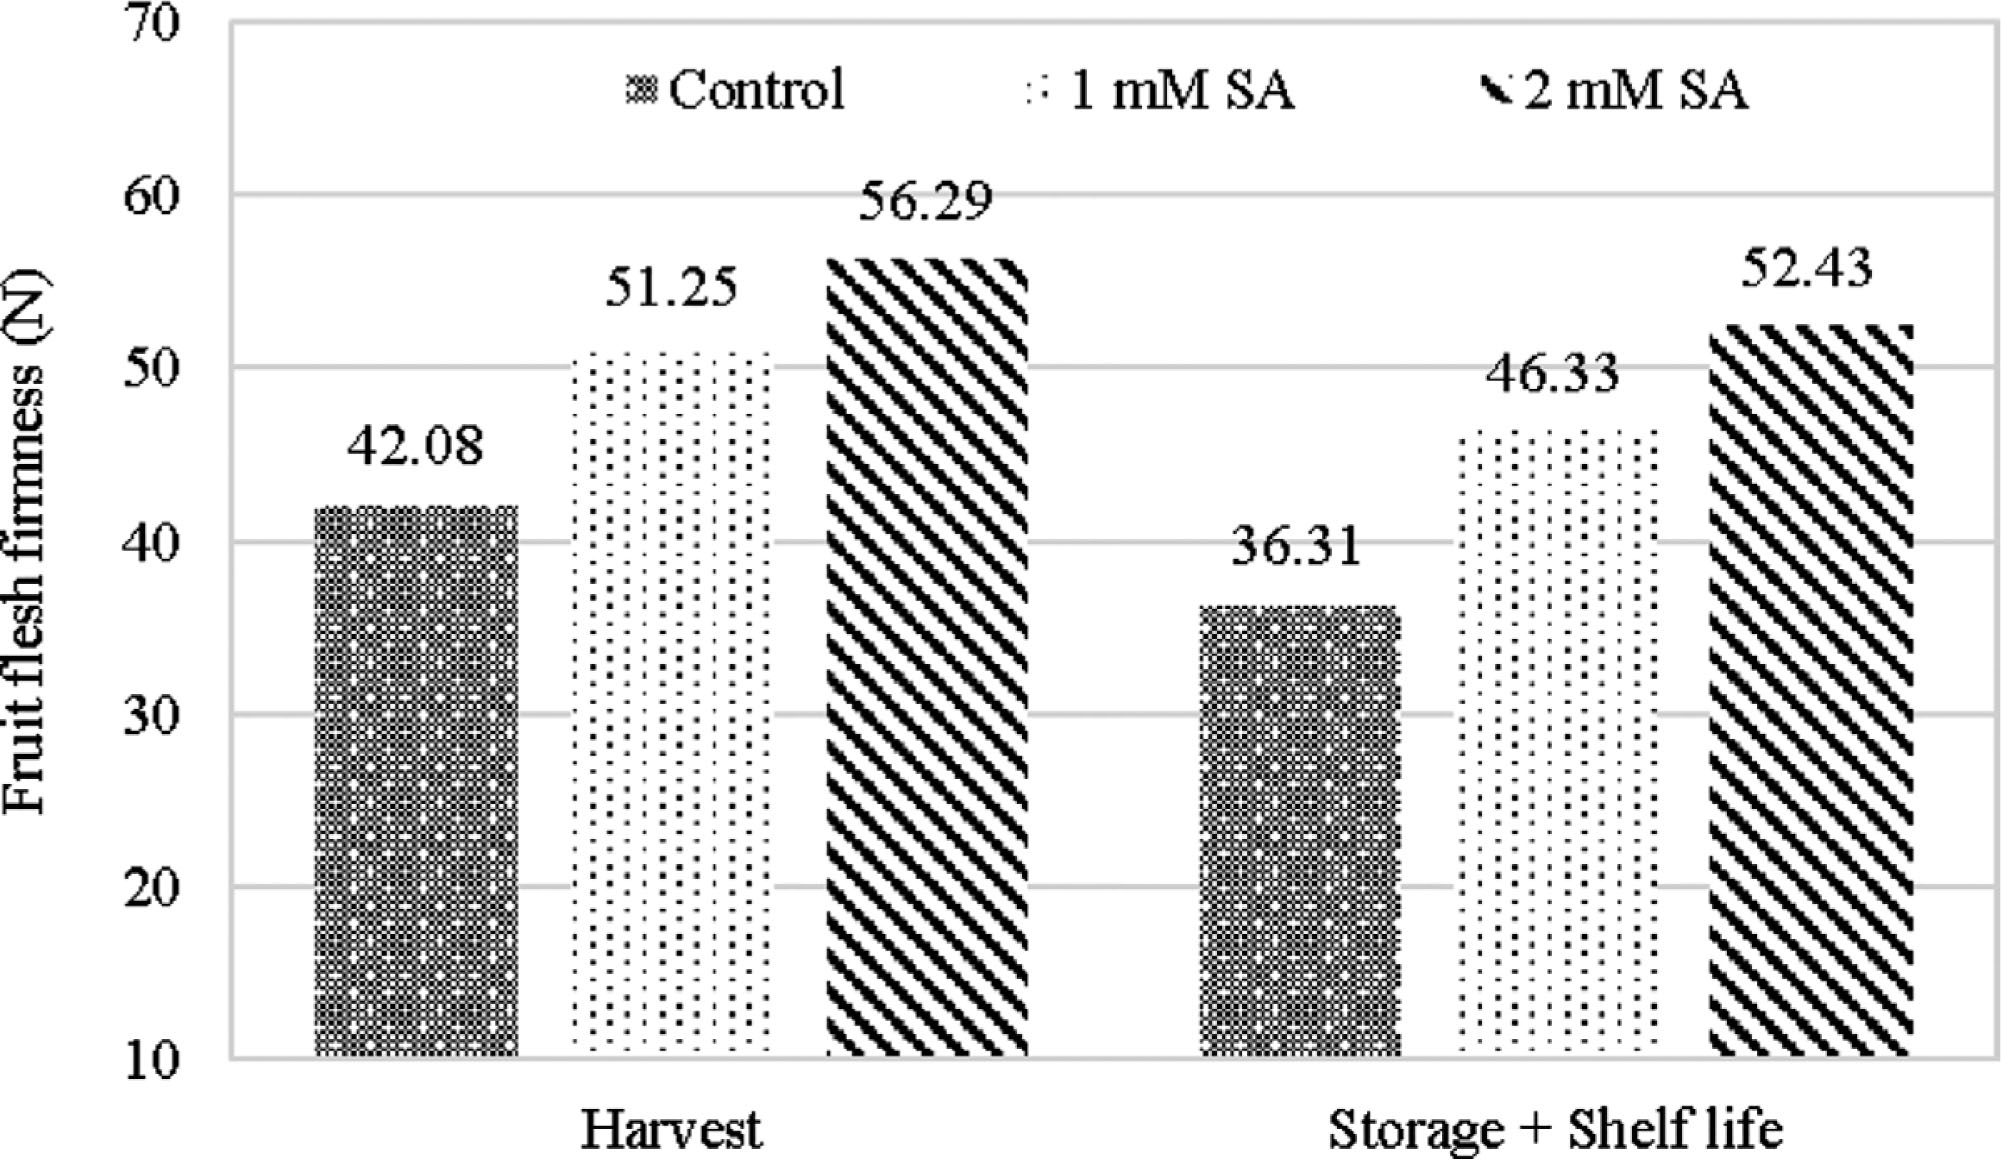
Figure 1
Effects of pre-harvest SA treatments on the fruit firmness of peach fruits at harvest and after storage plus 2-day shelf life.