Figure 1
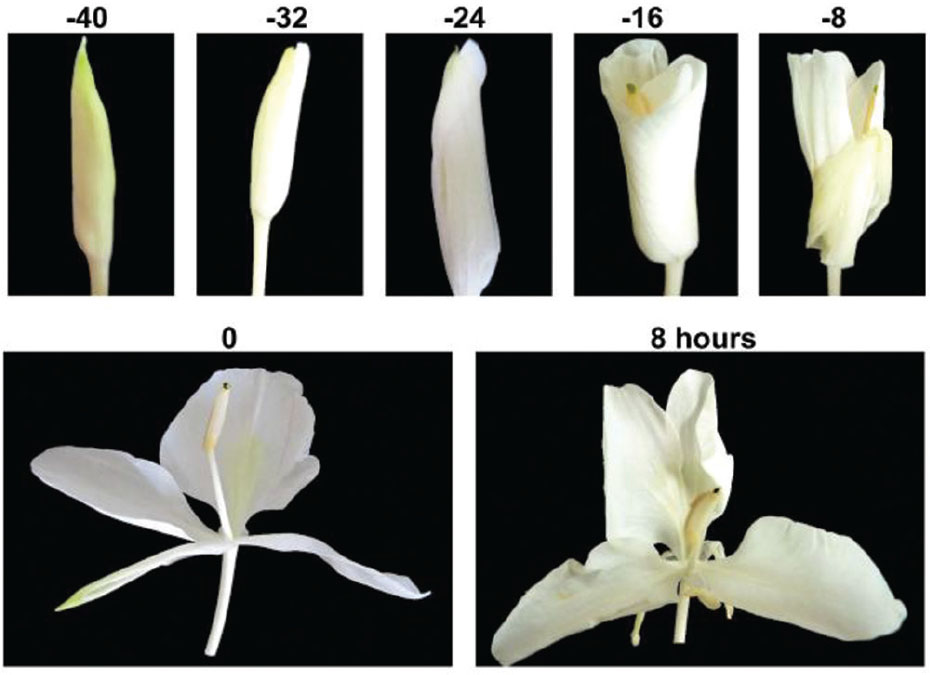
Photographs of H. coronarium flowers in different developmental stages. −40 = 40 h pre-anthesis; −32 = 32 h pre-anthesis; −24 = 24 h pre-anthesis; −16 = 16 h pre-anthesis; −8 = 8 h pre-anthesis; 0 = 0 h anthesis; 8 = 8 h post-anthesis.
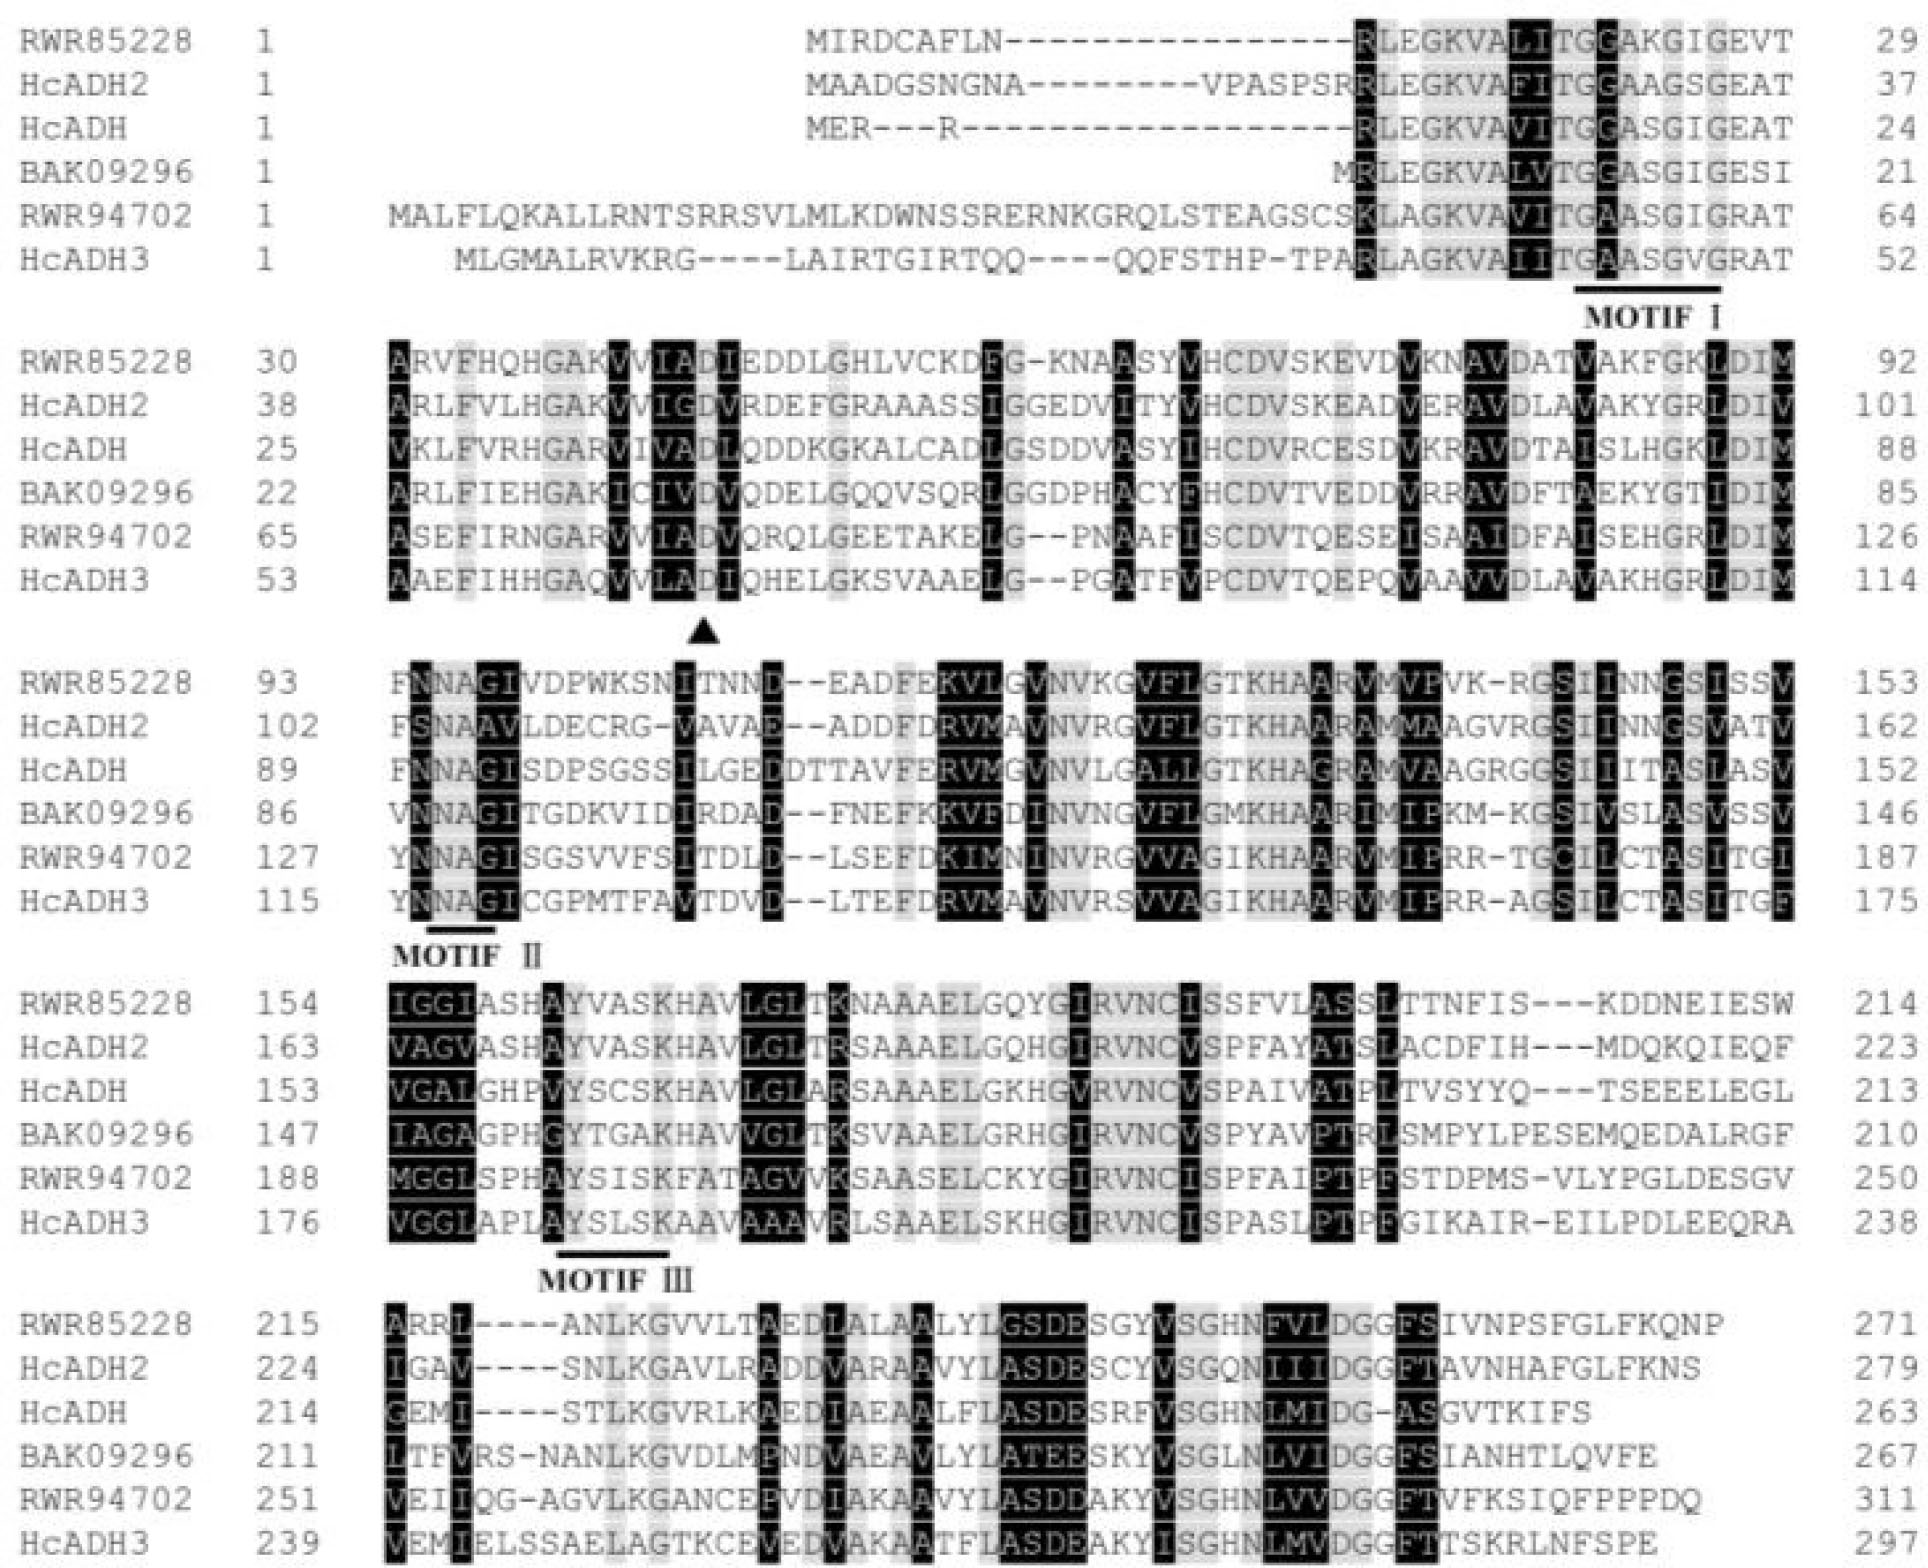
Figure 2
Alignment of the deduced amino acid sequences of HcADH2, HcADH3 and alcohol dehydrogenases/reductases from various plant species. RWR85228 = Cinnamomum micranthum SDR; HcADH = Hedychium coronarium SDR (KF358245); BAK09296 = Zingiber zerumbet SDR; RWR94702 = Cinnamomum micranthum secoisolariciresinol dehydrogenase. Grey boxes = identical residues; black boxes = similar residues; black triangle = the aspartate at position 52 of HcADH2 and position 67 of HcADH3. SDR, short-chain dehydrogenase/reductase.
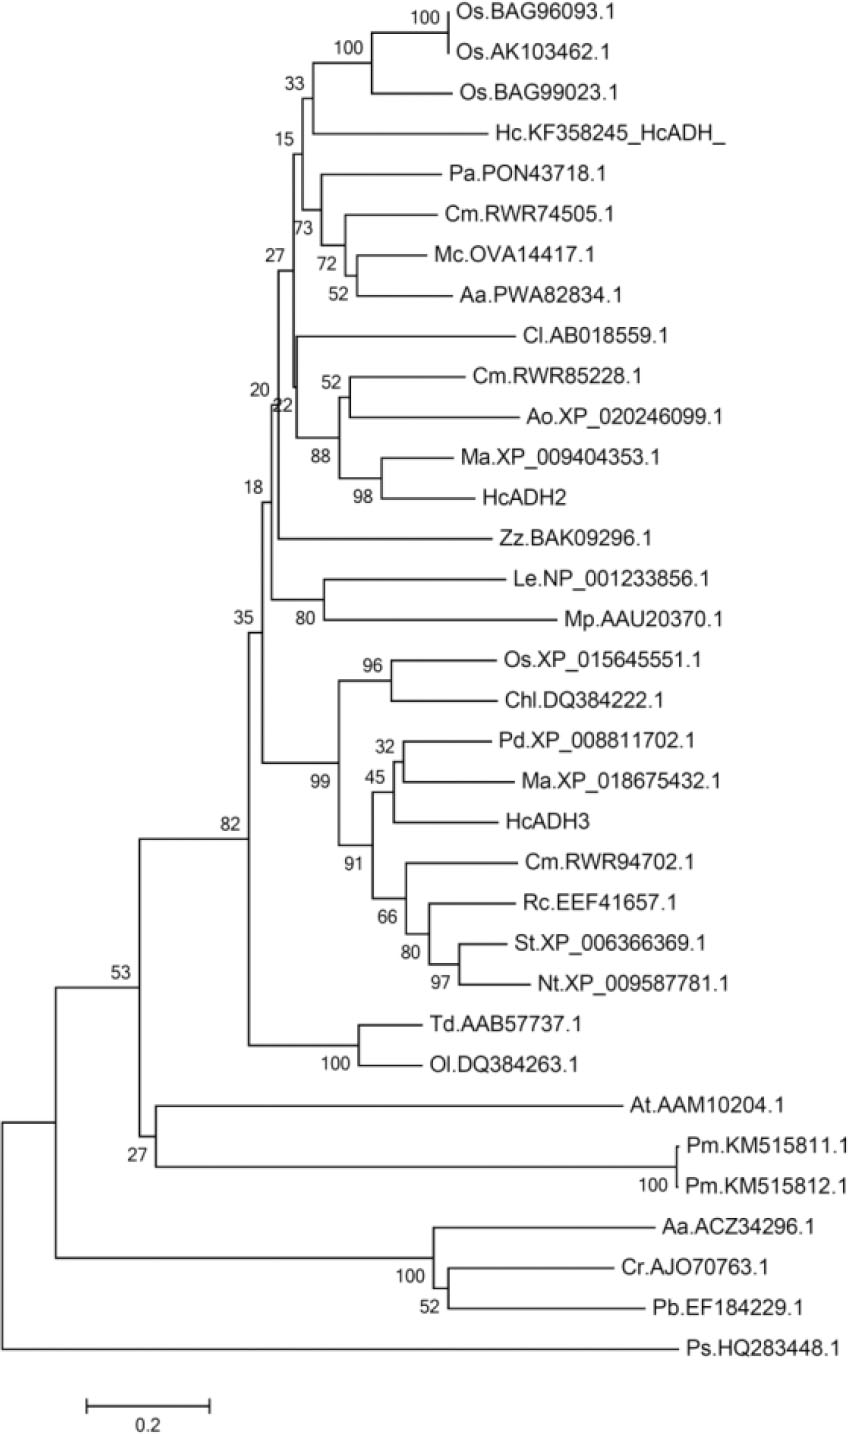
Figure 3
Phylogenetic tree of HcADH2 and HcADH3 with known alcohol dehydrogenase/reductase from other species. Aa = Artemisia annua; Ao = Asparagus officinalis; At = Arabidopsis thaliana; Cm = Cinnamomum micranthum; Chl = Chasmanthium latifolium; Cl = Citrullus lanatus; Cr = Catharanthus roseus; Hc = Hedychium coronarium; Le = Lycopersicon esculentum; Ma = Musa acuminate; Mc = Macleaya cordata; Mp = Mentha x piperita; Nt = Nicotiana tomentosiformis; Ol = Orthoclada laxa; Os = Oryza sativa; Pa = Parasponia andersonii; Pb = Papaver bracteatum; Pd = Phoenix dactylifera; Pm = Persicaria minor; Ps = Paeonia suffruticosa; Rc = Ricinus communis; St = Solanum tuberosum; Td = Tripsacum dactyloides; Zz = Zingiber zerumbet. Scale bars = 20% sequence differences.
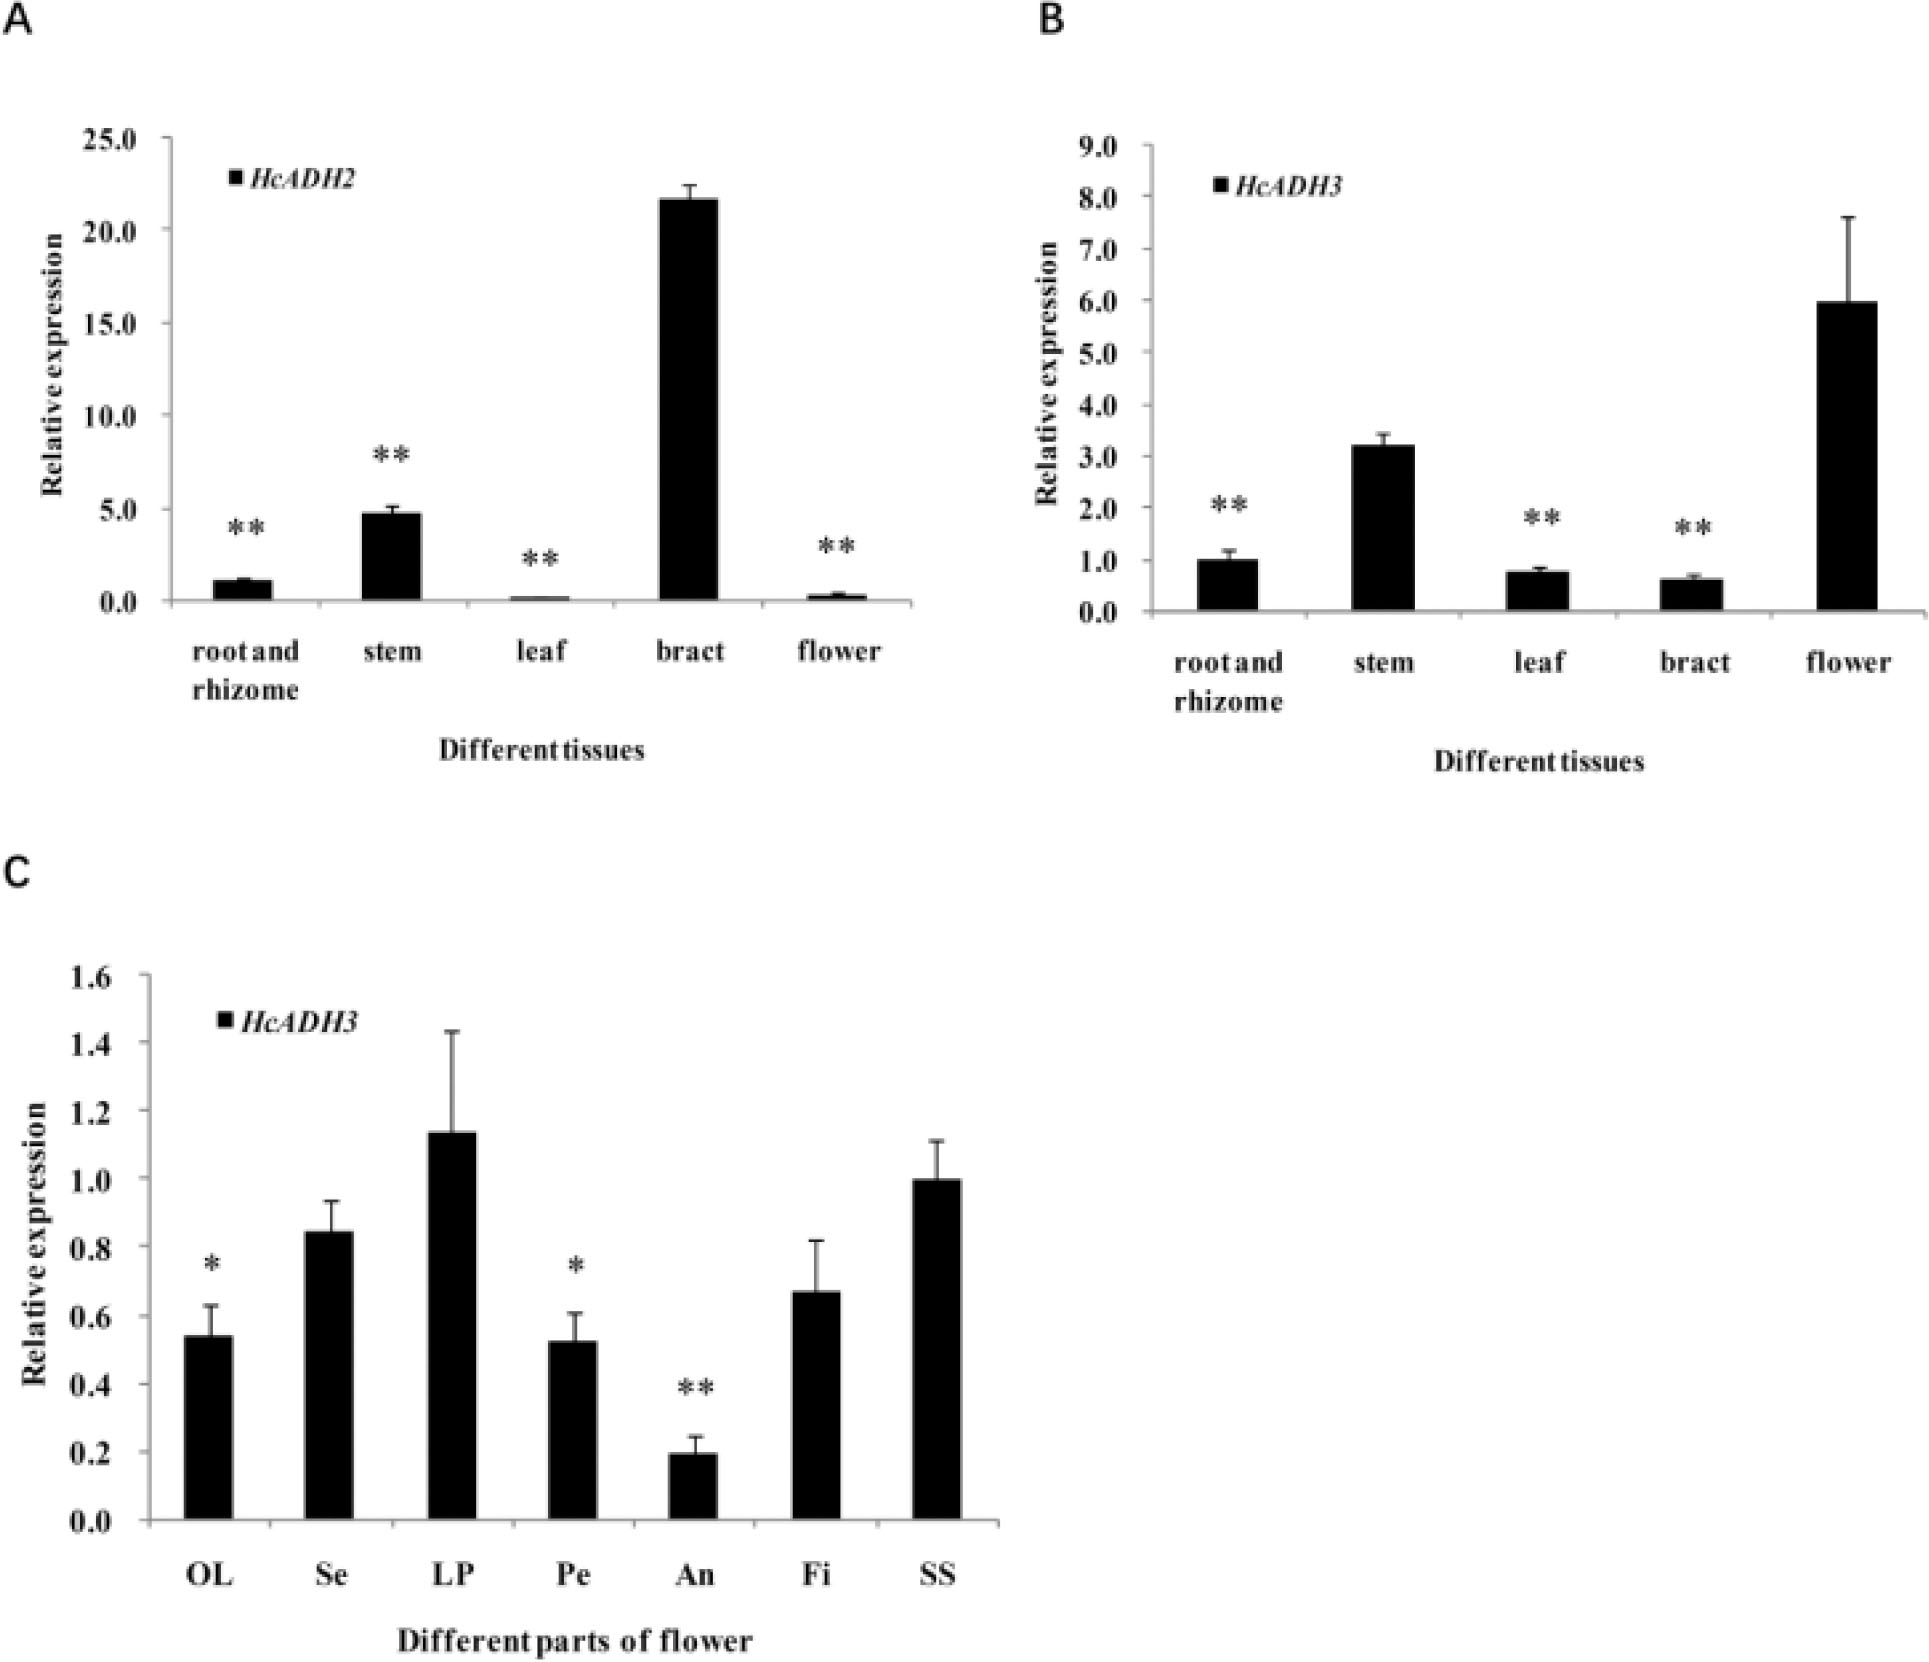
Figure 4
The expression analysis of HcADH2 and HcADH3 in different tissues of H. coronarium. (A) The HcADH2 relative expression analysis in different tissues using qRT-PCR. (B) The HcADH3 relative expression analysis in different tissues using qRT-PCR. (C) The HcADH3 relative expression analysis in different parts of flower using qRT-PCR. OL = outer abellum; Se = petal; LP = laterral petal; Pe = pedicel; An = anter; Fi = filament; SS = style and stigma. Numbers = ±SD (n = 3). Asterisks = statistically significant differences compared with the ones with the highest expression level (*p < 0.05; **p < 0.01).
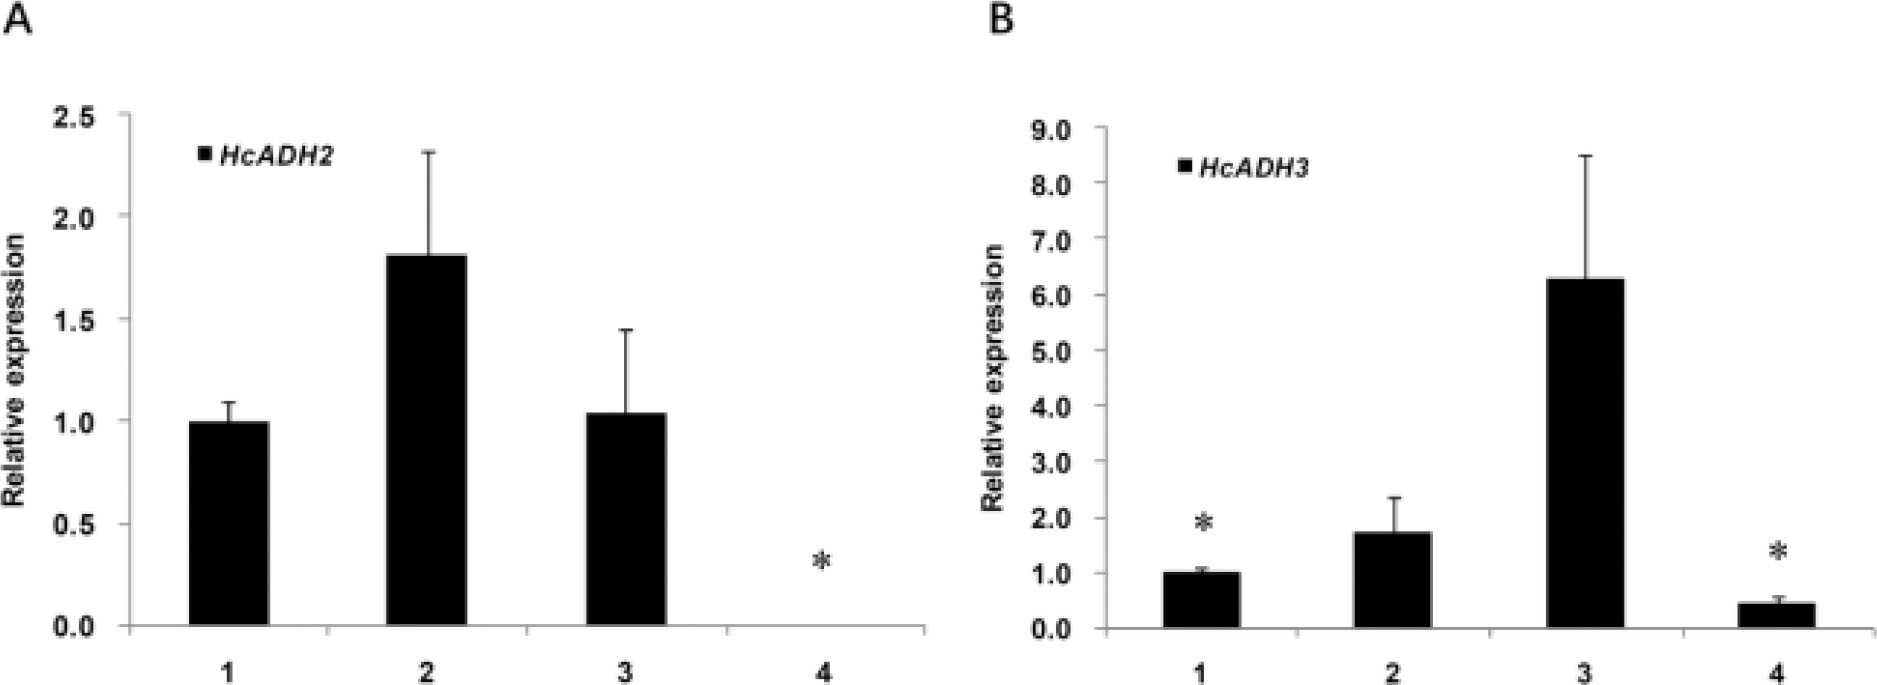
Figure 5
The expression analysis of HcADH2 (A) and HcADH3 (B) in different species of Hedychium. 1 = H. gardnerianum; 2 = H. forrestii; 3 = H. coronarium; 4 = H. coccineum Buch.–Ham. Numbers = ±SD (n = 3). Asterisks = statistically significant differences compared with the ones with the highest expression level (*p < 0.05; **p < 0.01).
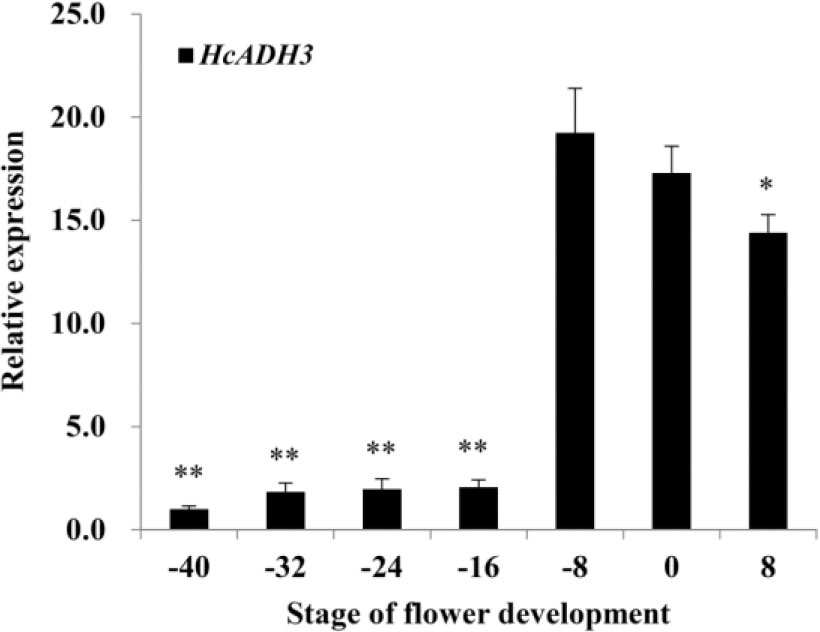
Figure 6
The expression analysis of HcADH3 in different developmental stages of H. coronarium flower. −40 = 40 h pre-anthesis; −32 = 32 h pre-anthesis; −24 = 24 h pre-anthesis; −16 = 16 h pre-anthesis; −8 = 8 h pre-anthesis; 0 = anthesis (0 h); 8 = 8 h post-anthesis. Numbers = ±SD (n = 3). Asterisks = statistically significant differences compared with the ones with the highest expression level (*p < 0.05; **p < 0.01).
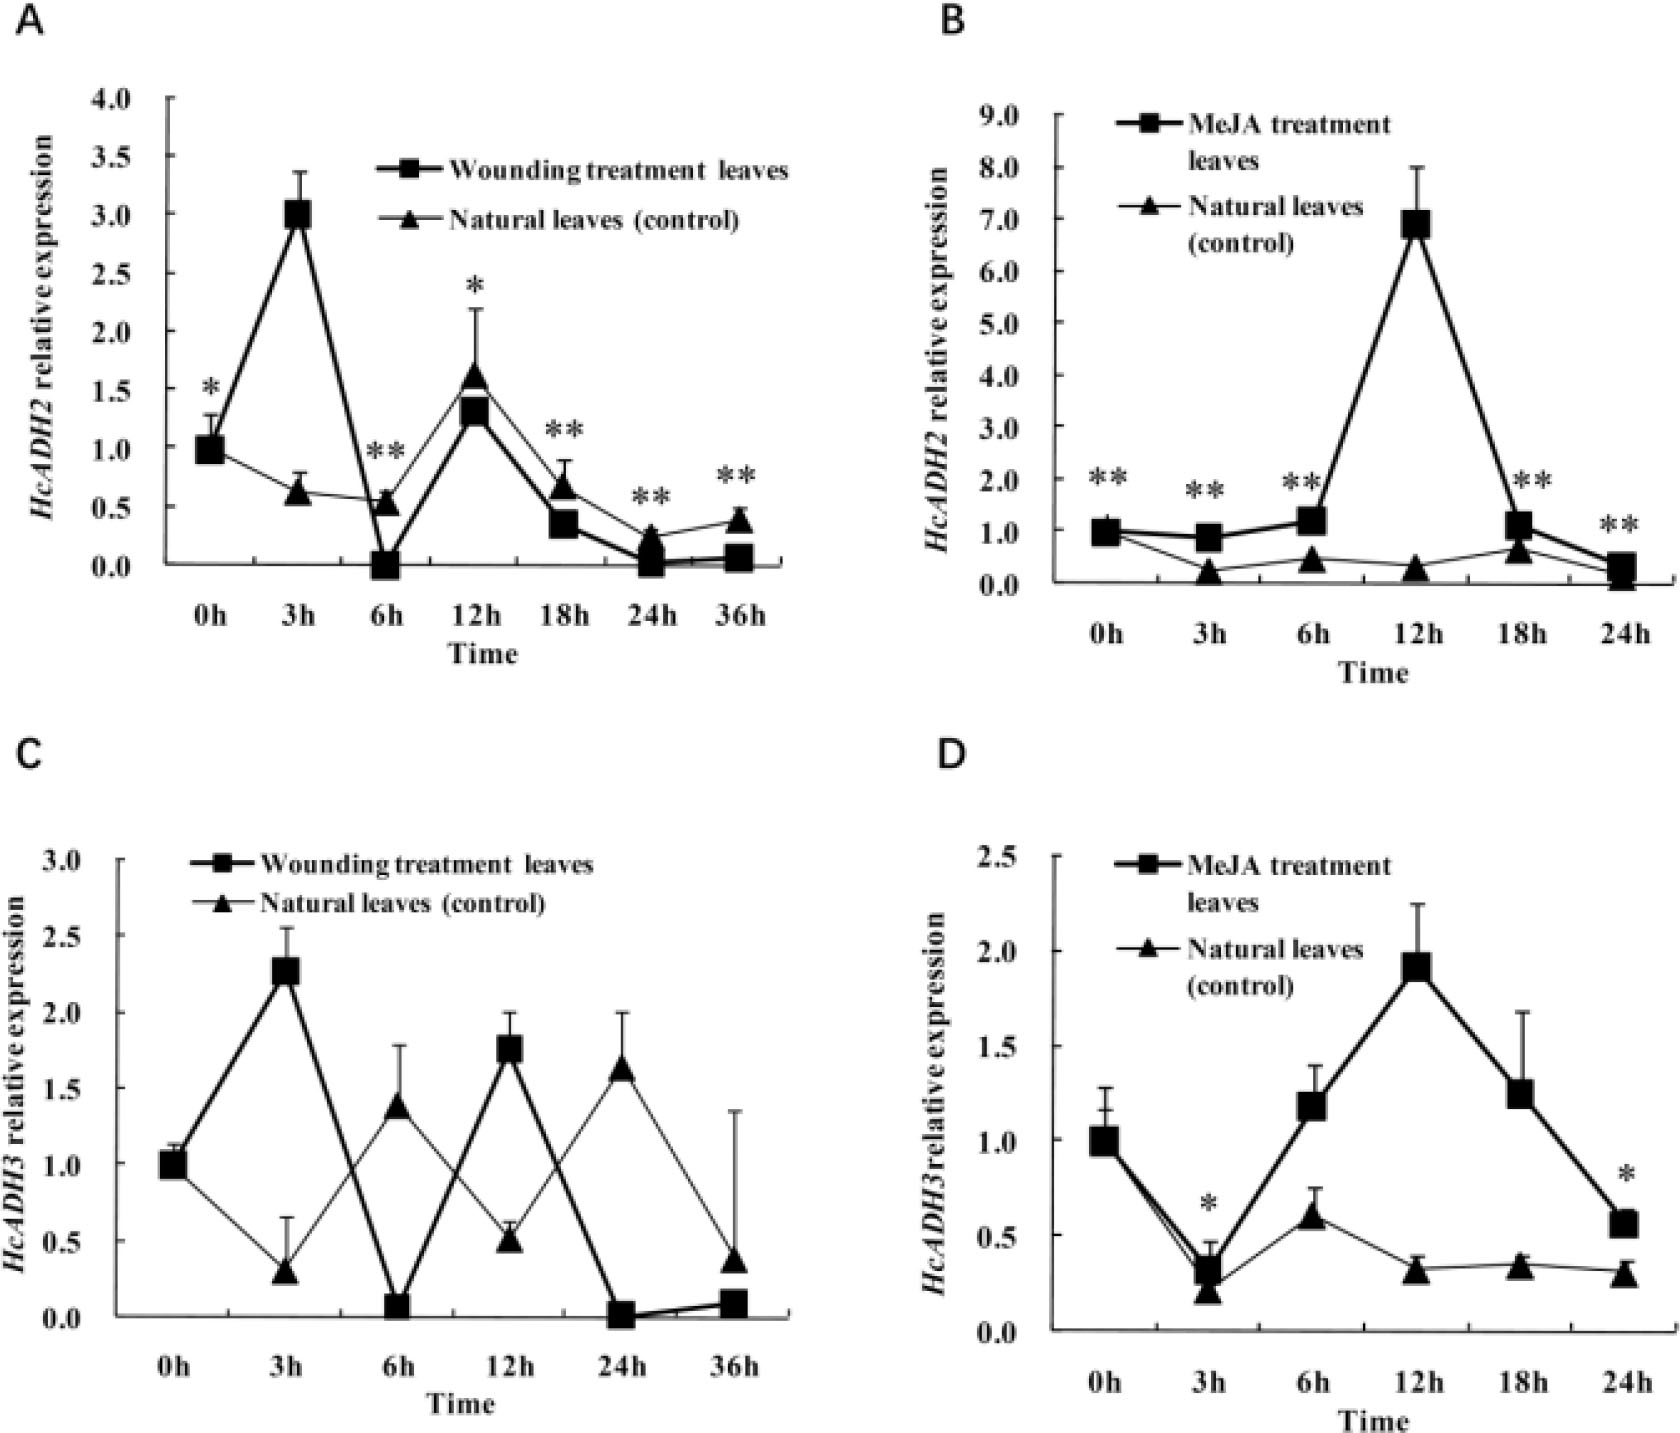
Figure 7
Expression analysis of HcADH2 and HcADH3 mRNA levels in response to external environmental stimuli. (A) HcADH2 expression at 0–36 h after wounding. (B) HcADH2 expression analysis of MeJA treatments and natural leaves (control) at different times. (C) HcADH3 expression at 0–36 h after wounding. (D) HcADH3 expression analysis of MeJA treatments and natural leaves (control) at different times. Numbers = ±SD (n = 3). Asterisks = statistically significant differences compared with the ones with the highest expression level (*p < 0.05; **p < 0.01).
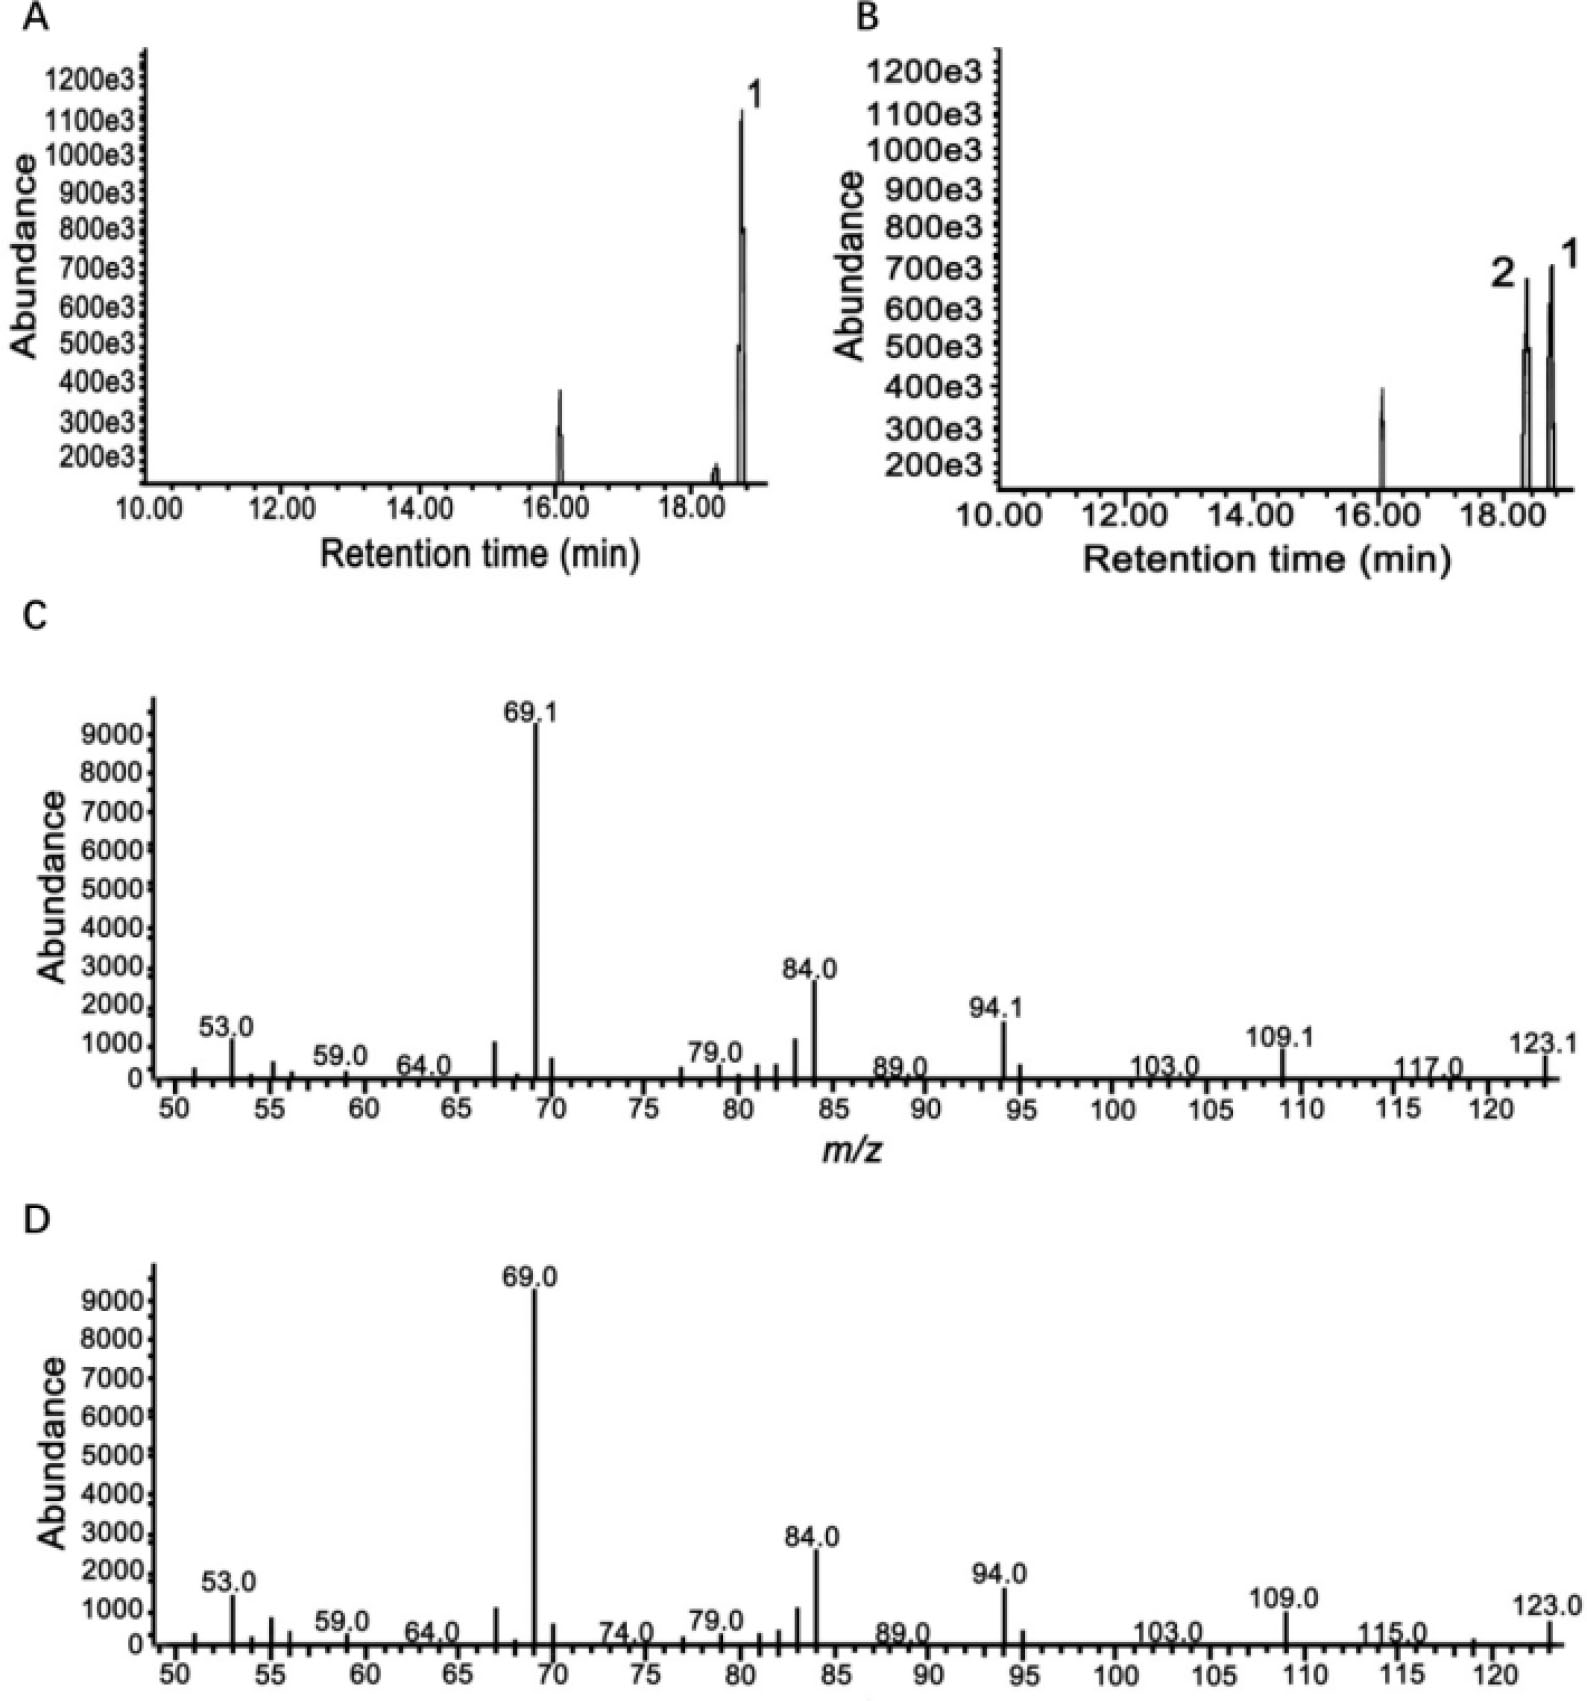
Figure 8
Analyses of products generated by the recombinant HcADH3 enzyme with geraniol as substrate. (A) Total ion chromatogram of the products obtained from the empty vector pET30a. (B) Total ion chromatogram of products obtained from pET30a-HcADH3 with NAD (peak 1, geraniol; peak 2, citral). (C) Mass spectrum of peak 2 (citral). (D) Mass spectrum of authentic citral in the NIST08 library.
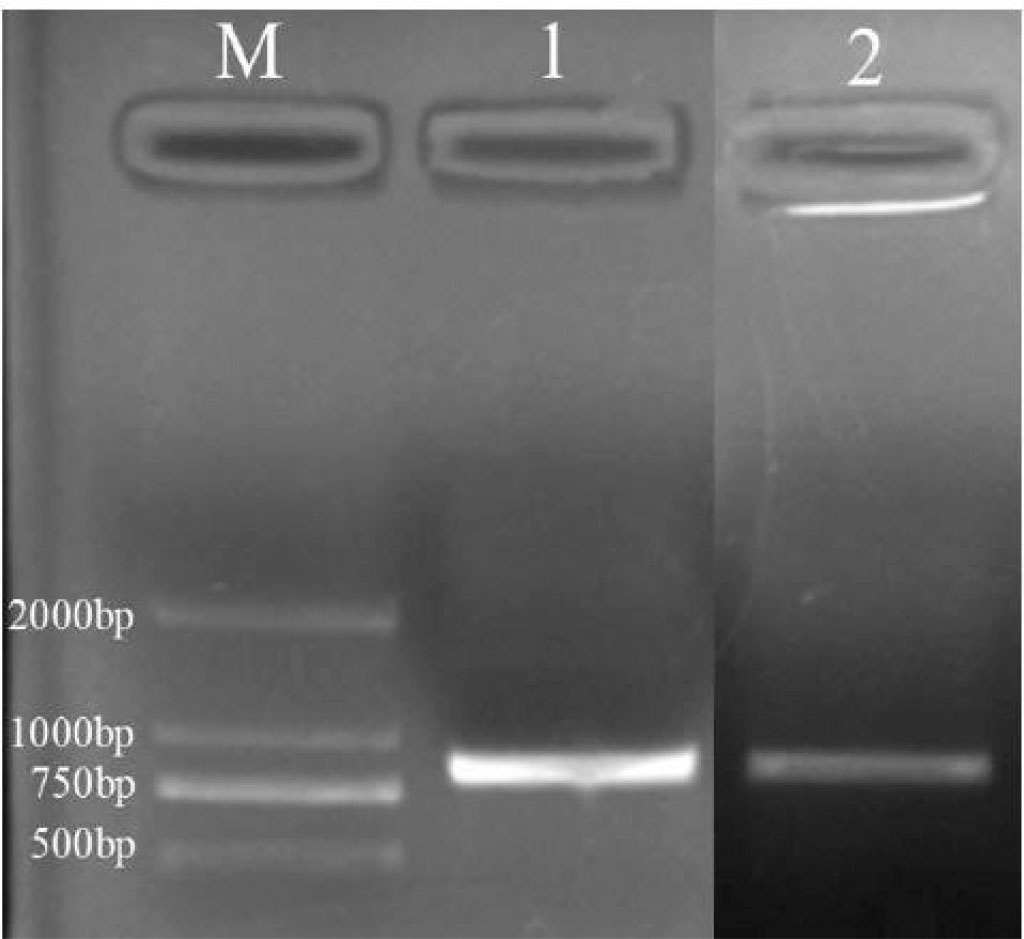
Figure S1
The RT-PCR amplification products of HcADH2 and HcADH3. M = DNA DL 2000 Marker; 1 = HcADH2 PCR product; 2 = HcADH3 PCR product.
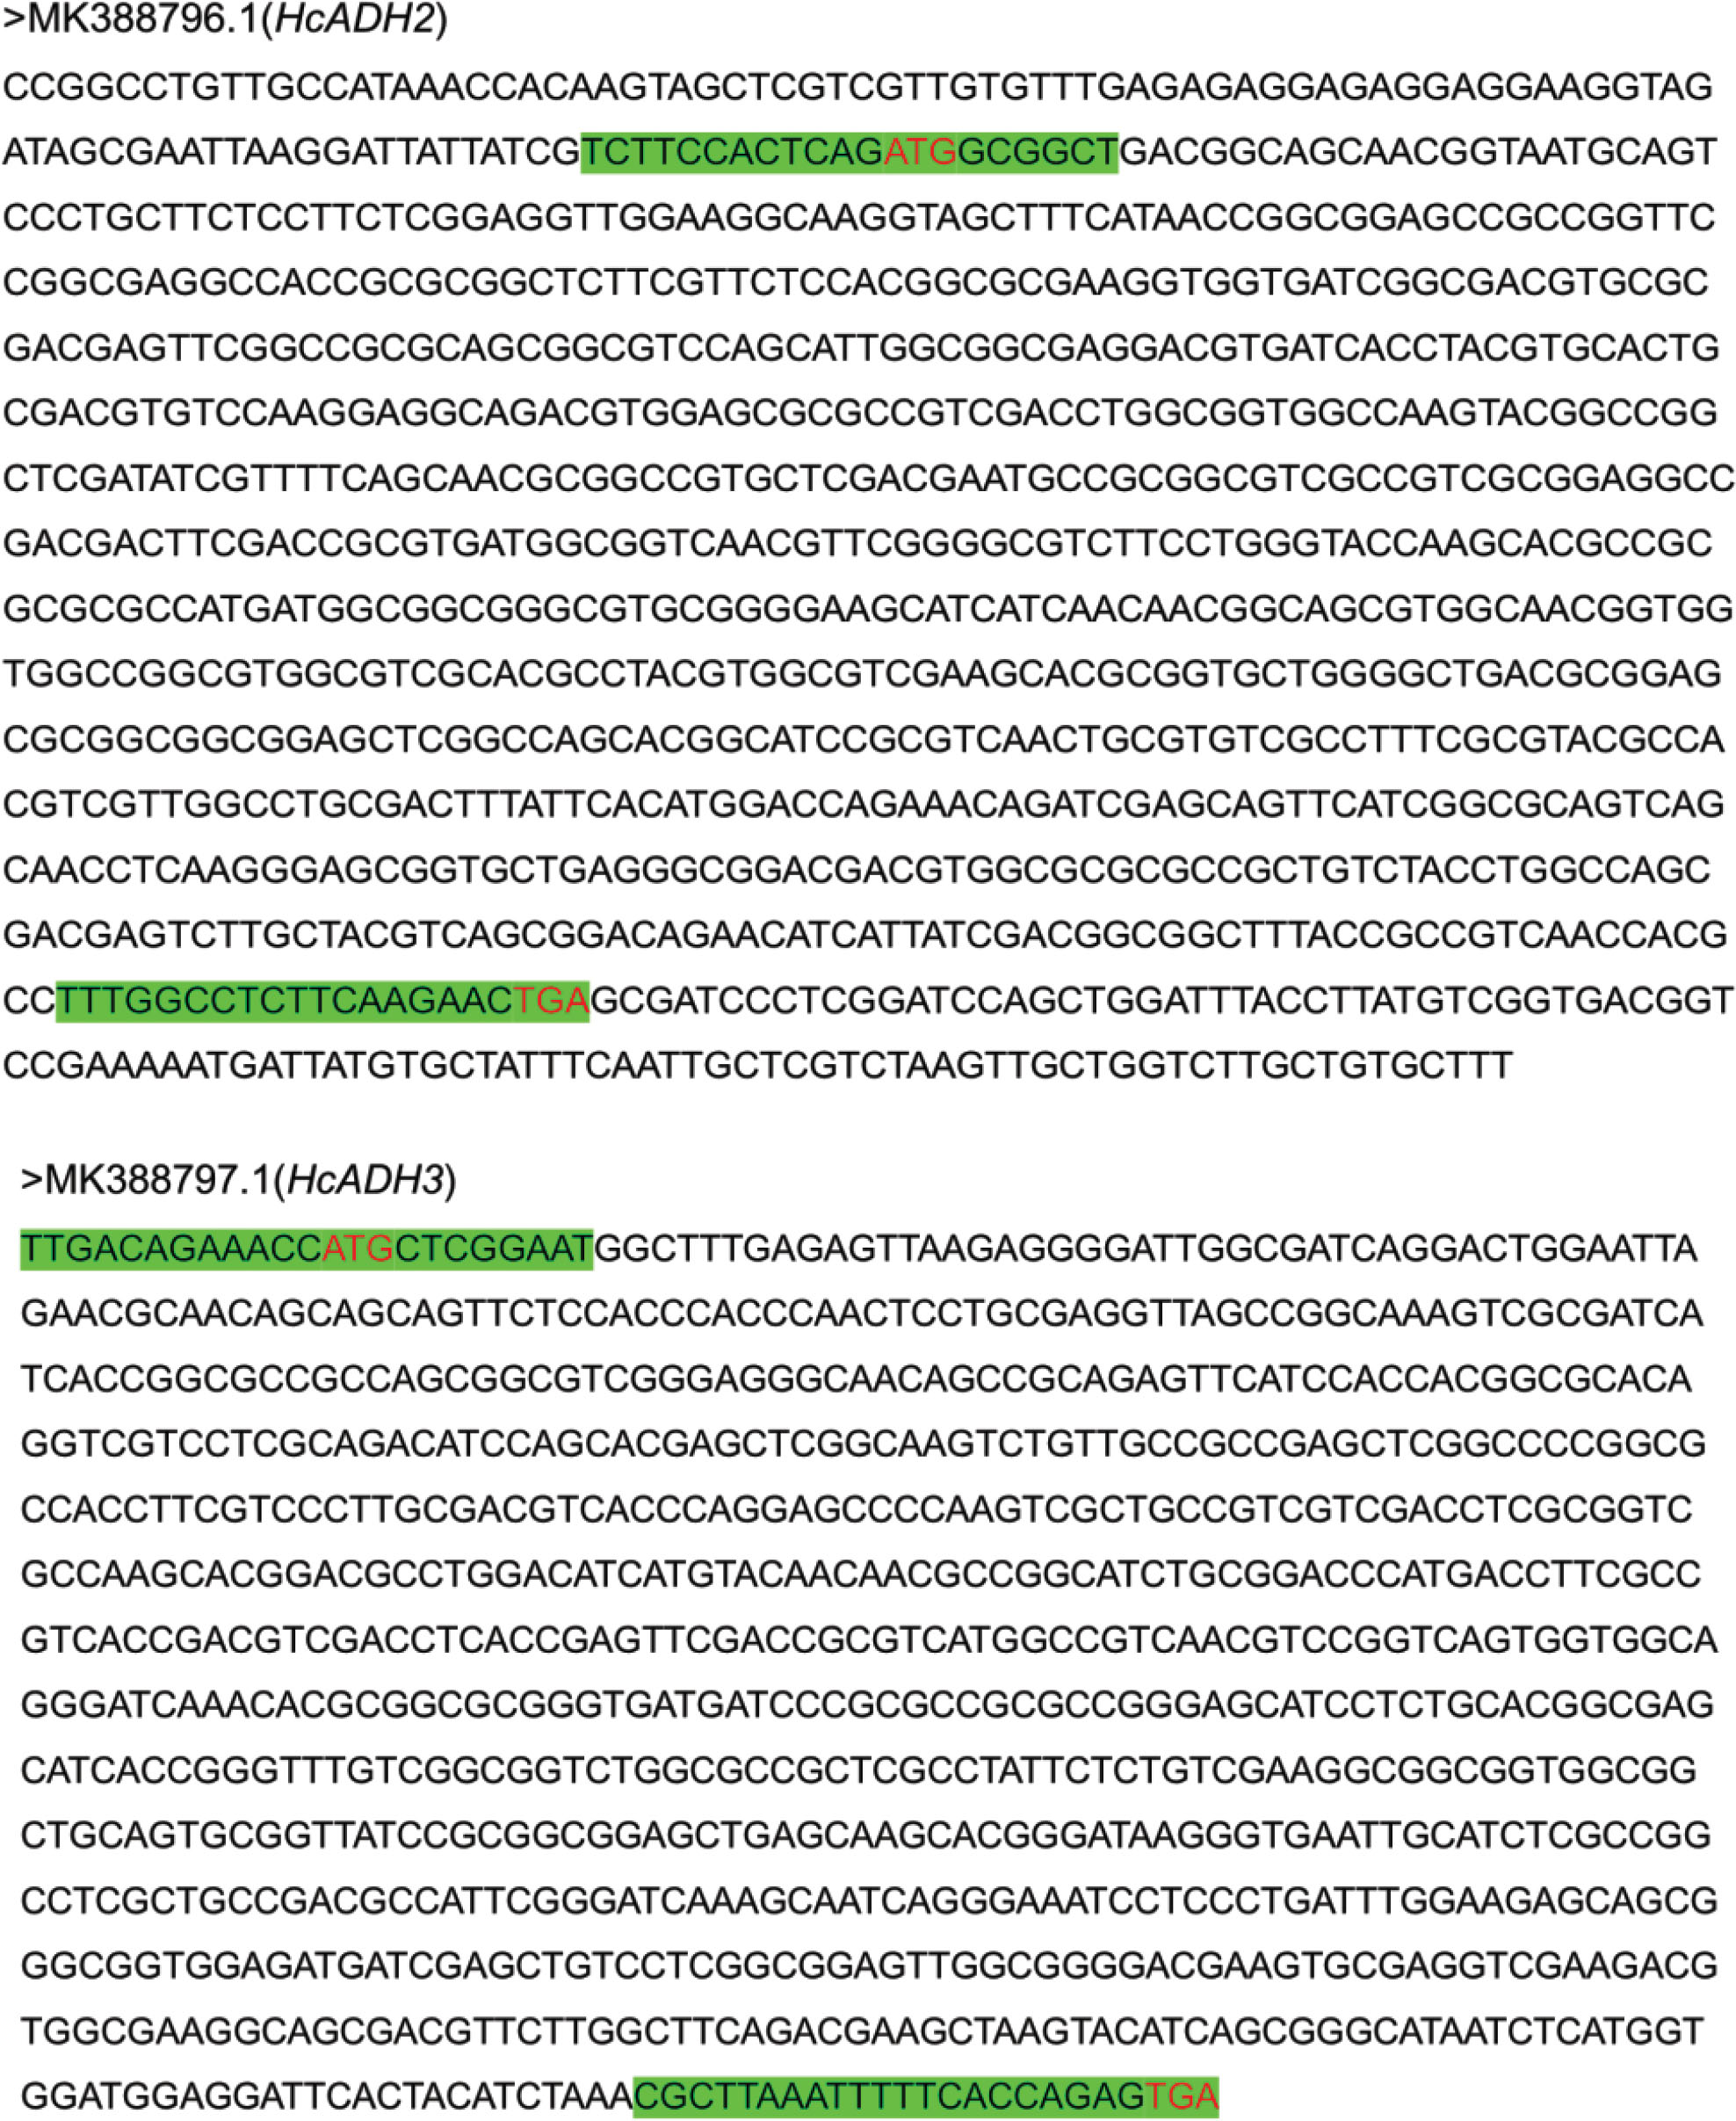
Figure S2
Full-length sequence of HcADH2 and HcADH3 genes. Nucleotide sequences with green colour = the primer sequences for full cDNA synthesis. Nucleotide sequences with red colour = initiator codon (ATG), terminators (TGA).
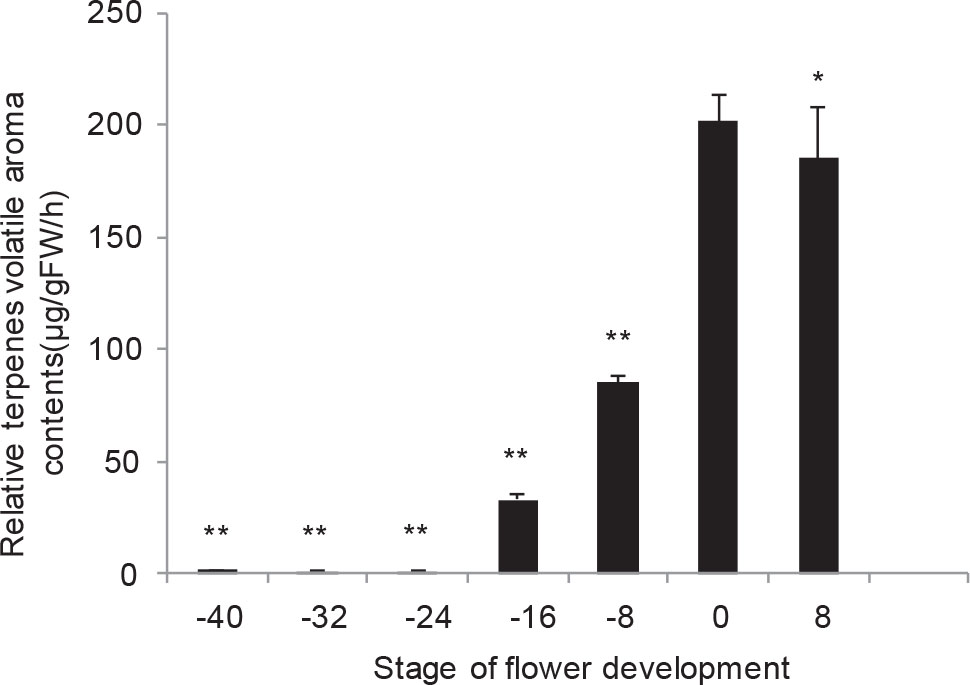
Figure S3
Relative terpenes volatile aroma contents of Hedychium coronarium during flower development. Numbers = ± SD (n = 3). Asterisks = statistically significant differences compared with the ones with the highest expression level (*p < 0.05; **p < 0.01).
Table S1
Amino acid residues sequences of comp45280_c0 and comp41433_c0
| Name | Amino acid residue sequences |
|---|---|
| comp45280_c0 | MAADGSNGNAVPASPSRRLEGKV AFITGGAAGSGEATARLFVLHGAK VVIGDVRDEFGRAAASSIGGEDVIT YVHCDVSKEADVERAVDLAVAKY GRLDIVFSNAAVLDECRGVAVAEA DDFDRVMAVNVRGVFLGTKHAAR AMMAAGVRGSIINNGSVATVVAG VASHAYVASKHAVLGLTRSAAAEL GQHGIRVNCVSPFAYATSLACDFIH MDQKQIEQFIGAVSNLKGAVLRAD DVARAAVYLASDESCYVSGQNIII DGGFTAVNHAFGLFKN |
| comp41433_c0 | MLGMALRVKRGLAIRTGIRTQQQQFSTH PTPARLAGKVAIITGAASGVGRATAAEFI HHGAQVVLADIQHELGKSVAAELGPGAT FVPCDVTQEPQVAAVVDLAVAKHGRLDI MYNNAGICGPMTFAVTDVDLTEFDRVM AVNVRSVVAGIKHAARVMIPRRAGSILC TASITGFVGGLAPLAYSLSKAAVAAAVRL SAAELSKHGIRVNCISPASLPTPFGIKAIRE ILPDLEEQRAVEMIELSSAELAGTKCEVED VAKAATFLASDEAKYISGHNLMVDGGFT TSKRLNFSPE |
Table S2
Primer sequences of HcADH2 and HcADH3 used in RT-PCR assays
| Methods | Forward primer | Reverse primer | PCR product size (bp) | |
|---|---|---|---|---|
| RT PCR | HcADH2 | TCTTCCACTCAGATGGCGGCT | TCAGTTCTTGAAGAGGCCAAA | 849 |
| HcADH3 | TTGACAGAAACCATGCTCGGAAT | TCACTCTGGTGAAAAATTTAAGCG | 903 | |
| PET-30a:HcADH2 vector | CGCGGATCCATGGCGGCTGACGG | CCCAAGCTTTCAGTTCTTGAAGAGGCCAAAG | ||
| PET-30a:HcADH3 vector | CGCGGATCCATGCTCGGAATG | CCCAAGCTTTCACTCTGGTGAAAAAT | ||
Table S3
Sequences description of accession numbers in GenBank on the phylogenetic tree
| Accession numbers | Name |
|---|---|
| AAB57737.1 | Short-chain alcohol dehydrogenase |
| AAM10204.1 | Tropinone reductase |
| AAU20370.1 | Secoisolaticiresinol dehydrogenase |
| AB018559.1 | Short-chain alcohol dehydrogenase |
| ACZ34296.1 | Short-chain alcohol dehydrogenase/reductase |
| AJO70763.1 | Alcohol dehydrogenase |
| AK103462.1 | Short-chain alcohol dehydrogenase/reductase |
| BAG96093.1 | Short-chain alcohol dehydrogenase/reductase |
| BAG99023.1 | Short-chain alcohol dehydrogenase/reductase |
| BAK09296.1 | Short-chain alcohol dehydrogenase/reductase |
| DQ384222.1 | Short-chain dehydrogenase/reductase |
| DQ384263.1 | Short-chain dehydrogenase/reductase |
| EEF41657.1 | Short chain alcohol dehydrogenase |
| EF184229.1 | Salutaridine reductase |
| HQ283448.1 | Dihydroflavonol 4-reductase |
| KF358245 | Short-chain dehydrogenase/reductase |
| KM515811.1 | Short-chain dehydrogenase/reductase |
| KM515812.1 | Short-chain dehydrogenase/reductase |
| NP_001233856.1 | Short-chain dehydrogenase/reductase |
| OVA14417.1 | Short-chain dehydrogenase/reductase |
| PON43718.1 | Short-chain dehydrogenase/reductase |
| PWA82834.1 | Glucose/ribitol dehydrogenase |
| RWR74505.1 | Short-chain dehydrogenase/reductase |
| RWR85228.1 | Short-chain dehydrogenase/reductase |
| RWR94702.1 | Secoisolaticiresinol dehydrogenase |
| XP_006366369.1 | Zerumbone synthase |
| XP_008811702.1 | Momilactone A synthase |
| XP_009404353.1 | Secoisolariciresinol dehydrogenase |
| XP_009587781.1 | Short-chain dehydrogenase/reductase |
| XP_015645551.1 | Momilactone A synthase |
| XP_018675432.1 | Secoisolariciresinol dehydrogenase |
| XP_020246099.1 | Momilactone A synthase |
Table S4
Primer sequences used in quantitative real-time PCR assays and their characteristics
| Gene name | Primer (forward/reverse) 5′→3′ | Amplicon Tm (°C) | Amplicon length (bp) | Amplication efficiency (%) | R2 |
|---|---|---|---|---|---|
| GAPDH | TAACATCATTCCCAGCAGCACT GGTGGATCTCACTGTCAGGCTC | 83.20 | 136 | 94.8 | 0.998 |
| HcADH2 | TGCTACGTCAGCGGACAGAAC GGACCGTCACCGACATAAGG | 90.71 | 128 | 79.4 | 0.991 |
| HcADH3 | GTCAGTGGTGGCAGGGAT CAGAGAATAGGCGAGCGG | 85.7 | 124 | 99.7 | 0.988 |