
Introduction
To address the risks posed by climate change, the Paris Agreement provides the central international policy framework guiding global emission-reduction efforts and defining the contribution of land-use sectors, including forestry, to climate change mitigation (United Nations 2015). International environmental initiatives aim to consolidate global efforts to implement measures that preserve the environment, particularly by reducing greenhouse gas emissions and mitigating climate change. Achieving zero emissions and minimising the use of fossil fuels are most effectively realised by expanding the use of renewable energy sources and fostering the development of a circular economy. These objectives align with the sustainable development goals for natural resource management, which include the balanced exploitation of forest resources (Gough et al. 2008) and the application of mechanisms for evaluating ecosystem services. A systematic analysis and the development of a comprehensive database to model the condition of forest ecosystems are essential for assessing the functions and services provided by forest stands. Moreover, the condition of natural and semi-natural ecosystems, along with their functions and services within urban environments, including urban forests and nature reserves, remains understudied in many regions.
Each object of the nature reserve fund is of unique importance, particularly for conserving biodiversity and unique ecosystems, comprehensive restoration of territories after man-made disasters and protection of natural landscapes under rapid urbanization. Forest management in the nature reserve fund faces numerous challenges that require scientific solutions. An example is the Chornobyl Radiation and Ecological Biosphere Reserve, where the critical impact of wildfires and other disturbances threatens sustainable forest development (Beresford et al. 2021; Matsala et al. 2021). Assessing ecosystem functions and services based on a comprehensive study of productivity enables us to draw basic conclusions about the state of forests and sustainable development.
As a modern megalopolis, Kyiv has integrated several forests, including rare forest biotopes (Didukh and Alioshkina 2012; Netsvetov et al. 2019), which are vital for providing ecosystem services and maintaining biodiversity (Radchenko et al. 2019; Koniakin and Gubar 2022). A detailed examination of biological productivity within these forests provides critical insights into the state and growth features of these forest stands. The endeavour to assess forest biological productivity and ecosystem services is crucial not only for understanding their current dynamics but also for addressing broader economic, ecological, social, and energy-related challenges (Brockerhoff et al. 2017). Furthermore, these assessments form a sound scientific foundation for national greenhouse gas accounting in the forest sector and thereby strengthen the ability to meet its post-Kyoto and subsequent international climate obligations related to carbon sequestration and mitigation in land-use systems (Pan et al. 2024). The assessment of ecosystem functions and services fundamentally involves examining forest biomass across various regions and conditions. This includes detailed studies on net primary production, live biomass, dead wood, and their dynamics (Keith et al. 2014). Forest live biomass is defined as the total mass of organic matter from all living plants within the ecosystem, quantified in units of absolute dry matter mass. This metric is crucial for evaluating and mapping the productivity of forested areas (Shvidenko et al. 2014). Furthermore, it serves as a foundation for assessing the ecological and resource potential of forests, particularly for understanding the environmental impacts of logging within forest stands. Tracking changes in live biomass is a critical component of environmental monitoring, especially in the context of urban forestry (Matsala et al. 2021) and when modelling forest productivity in response to global and local climate changes. These changes also play a significant role in evaluating forests' carbon storage functions (Bilous et al. 2019). A key objective is the regional and local assessment of tree stand live biomass dynamics and the carbon storage (Feshchenko and Bilous 2022; Feshchenko et al. 2023). This makes the study of biological productivity in forest stands within major cities and urban agglomerations particularly pressing. For sustainable regional development, it is crucial to maintain the continuous functioning of forest ecosystems and ensure the structural diversity of stands (Matsala et al. 2021). Long-term studies on the growth patterns and development of stands (Schepaschenko et al. 2017), root systems (Guz 1996) and forest biological productivity (Lakyda et al. 2013; Shvidenko et al. 2014) have facilitated the development of mathematical models and standards to evaluate the live biomass components of reference plantations for the key forest species in Ukraine (Lakyda et al. 2011, 2013) and Northern Eurasia (Shvidenko et al. 2007). These models are instrumental in determining the dynamics of total live biomass in forest stands across Eastern Europe.
In Ukraine, a first forest inventory based on remote sensing data was conducted, including an assessment of forest biomass and carbon storage using a model-based approach (Myroniuk V. 2023). Nevertheless, before this study, such an approach had not been validated against data from permanent sample plots within Ukrainian forests.
While these models could also be applicable to urban forests and nature reserves, they have not yet been validated in these contexts. The main objective of this research is to validate the model assessments of live biomass and carbon storage against field tree surveys and evaluations on permanent sample plots (SP), with a focus on urban forests and nature reserves.
Material and methods
The study was conducted in the urban forest stands of Feofania Park (Kyiv), located at the border between the forest-steppe and Polissia regions, vast forest areas in Eastern Europe. The Feofania Park is a structural part of the State Institution «Institute for Evolutionary Ecology of the National Academy of Sciences of Ukraine» (IEE). From 2016 to 2023, the number of live trees and snags (standing dead trees) on the SP was monitored. The IEE established these plots in 2016–017 (Schepaschenko et al. 2019).
Firstly, during 2011–2023 (Instructions for… 2006), we conducted a live biomass assessment of the stands according to forest inventory rules, utilising models (Shvidenko et al. 2007) and normative reference tables (Bilous et al. 2021). The productivity and carbon storage data were based on forest inventory results, the growing stock volume (over bark), and models developed by A. Shvidenko and co-authors (Shvidenko et al. 2007) for the forests in the European part of Eurasia. This approach includes the use of conversion coefficients (1), which represent the relationship between the mass of each component of live biomass (Fi) and the growing stock volume (over bark) (M):
where Ri is the conversion coefficient for component i (stem under bark, bark, stem over bark, leaves, branches), and Tj represents the parameters of the forest inventory.Conversion coefficients are calculated according to the model (2) based on key forest inventory parameters, including age, site index (quality class), and stand density index (relative stocking) (Shvidenko et al. 2007):
where Mfr is the dry mass of a component of live biomass in t·ha-1, GS is the growing stock volume in a stand in m3·ha-1, A is the average age of a stand, SI is the code of site index (quality class), and RS is the relative stocking.Thus, using current data on the growing stock volume for each stand, the above-ground live biomass of each stand was calculated by multiplying the growing stock volume by the corresponding conversion coefficients (Shvidenko et al. 2007).
To verify the results of the live biomass assessment using the model approach, the above-ground live biomass of trees and stands was evaluated on the SPs. This evaluation included measuring the height and diameter at breast height (DBH) of all trees at 1.3 m, as well as using normative reference tables to estimate the live biomass of growing tree crowns (Lakyda et al. 2013). The total above-ground live biomass of each tree was determined by summing the components of the tree’s live biomass.
On all SPs, we measured tree DBH and height to construct height curves and calculate stem volume for each tree using Nikitin's equation (Bilous et al. 2021). Using the density of the tree components of above-ground live biomass of the main forest-forming species in Ukraine (Lakyda et al. 2011; Fischer et al. 2026) and stem volume data, we obtained live biomass parameters for stems. According to the models presented in the handbook, we calculated the biomass of bark, small branches, and leaves, considering the parameters of each tree. The sum of above-ground live biomass fractions allowed us to establish the total live biomass of each tree and the stand as a whole.
Each SP (Tab. 1) was characterised at the time of its establishment mainly by typical, native, broad-leaved tree species, apart from Robinia pseudoacacia (ROPS). The composition of trees on each SP was as follows:
SP1: Acer platanoides (ACPL) – 142 trees, Quercus robur (QURO) – 98 trees, Robinia pseudoacacia (ROPS) – 5 trees, Tilia cordata (TICO) – 1 tree, Ulmus laevis (ULLE) – 2 trees, and 12 snags of ACPL and QURO.
SP2: ACPL – 36 trees, Carpinus betulus (CABE) – 215 trees, QURO – 33 trees, TICO – 23 trees, and 7 snags of CABE and QURO.
SP3: ACPL – 8 trees, CABE – 181 trees, QURO – 7 trees, ROPS – 1 tree, TICO– 6 trees, ULLE – 10 trees, and 1 dried CABE.
SP4: ACPL – 73 trees, CABE – 57 trees, QURO – 63 trees, TICO – 9 trees, ULLE – 1 tree, Fraxinus excelsior (FREX) – 1 tree, and 22 snags of ACPL, CABE, QURO, and TICO.
Table 1.
Description of studied forest stands (Schepaschenko et al. 2019)
| Sample plot | Year of SP establishment | Coordinates | Age, years | Site index | Area, ha | Number of trees |
|---|---|---|---|---|---|---|
| 1 | 2016 | 50.335422N 30.481637E | ~80 | I | 0.51 | 260 |
| 2 | 50.343174N 30.484455E | ~180 | I | 0.88 | 314 | |
| 3 | 2017 | 50.343387N 30.492641E | ~180 | Ia | 0.44 | 214 |
| 4 | 50.343335N 30.497189E | ~80 | I | 0.29 | 226 |
The largest number of trees on the four SPs was represented by ACPL, CABE, and QURO. The density of tree stands on the sample plots was as follows: SP1 – 510 trees per hectare, SP2 – 357 trees per hectare, SP3 – 486 trees per hectare, and SP4 – 779 trees per hectare.
Paired comparisons between the model-based approach and above-ground biomass estimates on permanent sample plots were conducted using the Wilcoxon signed-rank test (Hollander et al. 2014). Analyses were performed separately for the 2016/2017 and 2023 datasets due to the small number of sample plots. The magnitude of between-method differences was described using the median of paired differences.
The assessment of carbon storage in the above-ground live biomass was conducted using data on the carbon content in absolutely dry wood and bark (50%) and leaves (45%) (Matthews 1993).
The amount of oxygen produced during forest growth was estimated based on the stoichiometric relationship of oxygenic photosynthesis, assuming that the accumulation of 1 t of biogenic carbon corresponds to the release of 2.67 t of molecular oxygen. This conversion is derived from the molar balance of CO2 fixation and O2 evolution during photosynthesis and is widely applied in forest ecosystem-level productivity and gas-exchange studies (Stirbet et al. 2020). To quantify the energy accumulated in forest stand biomass, the value of 35.78 GJ t C-1 was applied as the energy equivalent of carbon, corresponding to the higher heating value of elemental carbon under complete oxidation to CO2 and representing a fundamental thermochemical constant (Reichle et al. 1973).
Results and discussion
The structure of stands in the experimental SPs of the park showed notable changes in tree status from 2016 to 2023 (Tab. 2). Across all plots, the number of dead trees increased, ranging from 1 to 30 trees. In the SP1, the percentage of dead trees rose from 4.6% in 2016 to 14.9% in 2023, with ROPS, ULLE, and TICO trees maintaining stable vitality. SP2 was dominated by CABE trees, with a decrease in live trees from 215 in 2016 to 201 in 2023 and an increase in dead CABE trees to 15, representing 4.7% of the total. Dead QURO and ACPL trees also showed an increase, reaching 4.7% and 0.6%, respectively, in 2023. The SP3 recorded the highest number of snags, with 11.3% of CABE, 0.5% of ACPL, and 0.5% of TICO trees being dead. SP4 reported an increase in the percentage of dead CABE and QURO trees to 7.3% and 7.7% of the total trees, respectively, in 2023, with dead TICO and ACPL trees accounting for 4.1% and 3.2%, respectively.
Table 2.
Distribution of trees by vitality status on SPs, 2016–2023
| Sample plots | Tree status | CABE | ACPL | QURO | TICO | ULLE | ROPS | FREX |
|---|---|---|---|---|---|---|---|---|
| 2016 (Schepaschenko et al. 2019) | ||||||||
| 1 | Alive | - | 142 | 98 | 1 | 2 | 5 | - |
| Snag | - | 6 | 6 | - | - | - | - | |
| 2 | Alive | 215 | 36 | 33 | 23 | - | - | - |
| Snag | 2 | - | 5 | - | - | - | - | |
| 2017 (Schepaschenko et al. 2019) | ||||||||
| 3 | Alive | 181 | 8 | 7 | 6 | 10 | 1 | - |
| Snag | 1 | - | - | - | - | - | - | |
| 4 | Alive | 57 | 73 | 63 | 9 | 1 | - | 1 |
| Snag | 8 | 2 | 8 | 4 | - | - | - | |
| 2023 | ||||||||
| 1 | Alive | - | 134 | 69 | 1 | 2 | 5 | - |
| Snag | - | 7 | 30 | - | - | - | - | |
| Missing | - | 7 | 5 | - | - | - | - | |
| 2 | Alive | 201 | 34 | 23 | 23 | - | - | - |
| Snag | 15 | 2 | 15 | - | - | - | - | |
| Missing | 1 | - | - | - | - | - | - | |
| 3 | Alive | 157 | 7 | 7 | 5 | 10 | 1 | - |
| Snag | 24 | 1 | - | 1 | - | - | - | |
| Missing | 1 | - | - | - | - | - | - | |
| 4 | Alive | 44 | 67 | 54 | 4 | 1 | - | 1 |
| Snag | 16 | 7 | 17 | 9 | - | - | - | |
| Missing | 5 | 1 | - | - | - | - | - | |
The full tree inventory on the SPs, aimed at measuring key urban forest stand parameters from 2016 (2017) (Bilous et al. 2017) to 2023, also included estimations of live and dead biomass (Tab. 3). On the SP1, above ground live biomass decreased by 12 t·ha-1 from 2016 to 2023, with QURO trees contributing the largest share at 67% in 2023 (Fig. 1). A 22.2% decrease in above-ground live biomass was observed on the SP2, largely due to an increase in dead and wind-blown QURO trees. QURO trees contributed the majority of live biomass dry matter. On the SP3, above-ground live biomass increased by 26 t·ha-1, driven by CABE and QURO trees, with CABE increasing by 11 t·ha-1, QURO by 13 t·ha-1, and ULLE by 4 t·ha-1. The SP4 experienced a 5 t·ha-1 increase in above-ground live biomass, predominantly comprised of QURO trees, which made up 81% of the total live biomass.
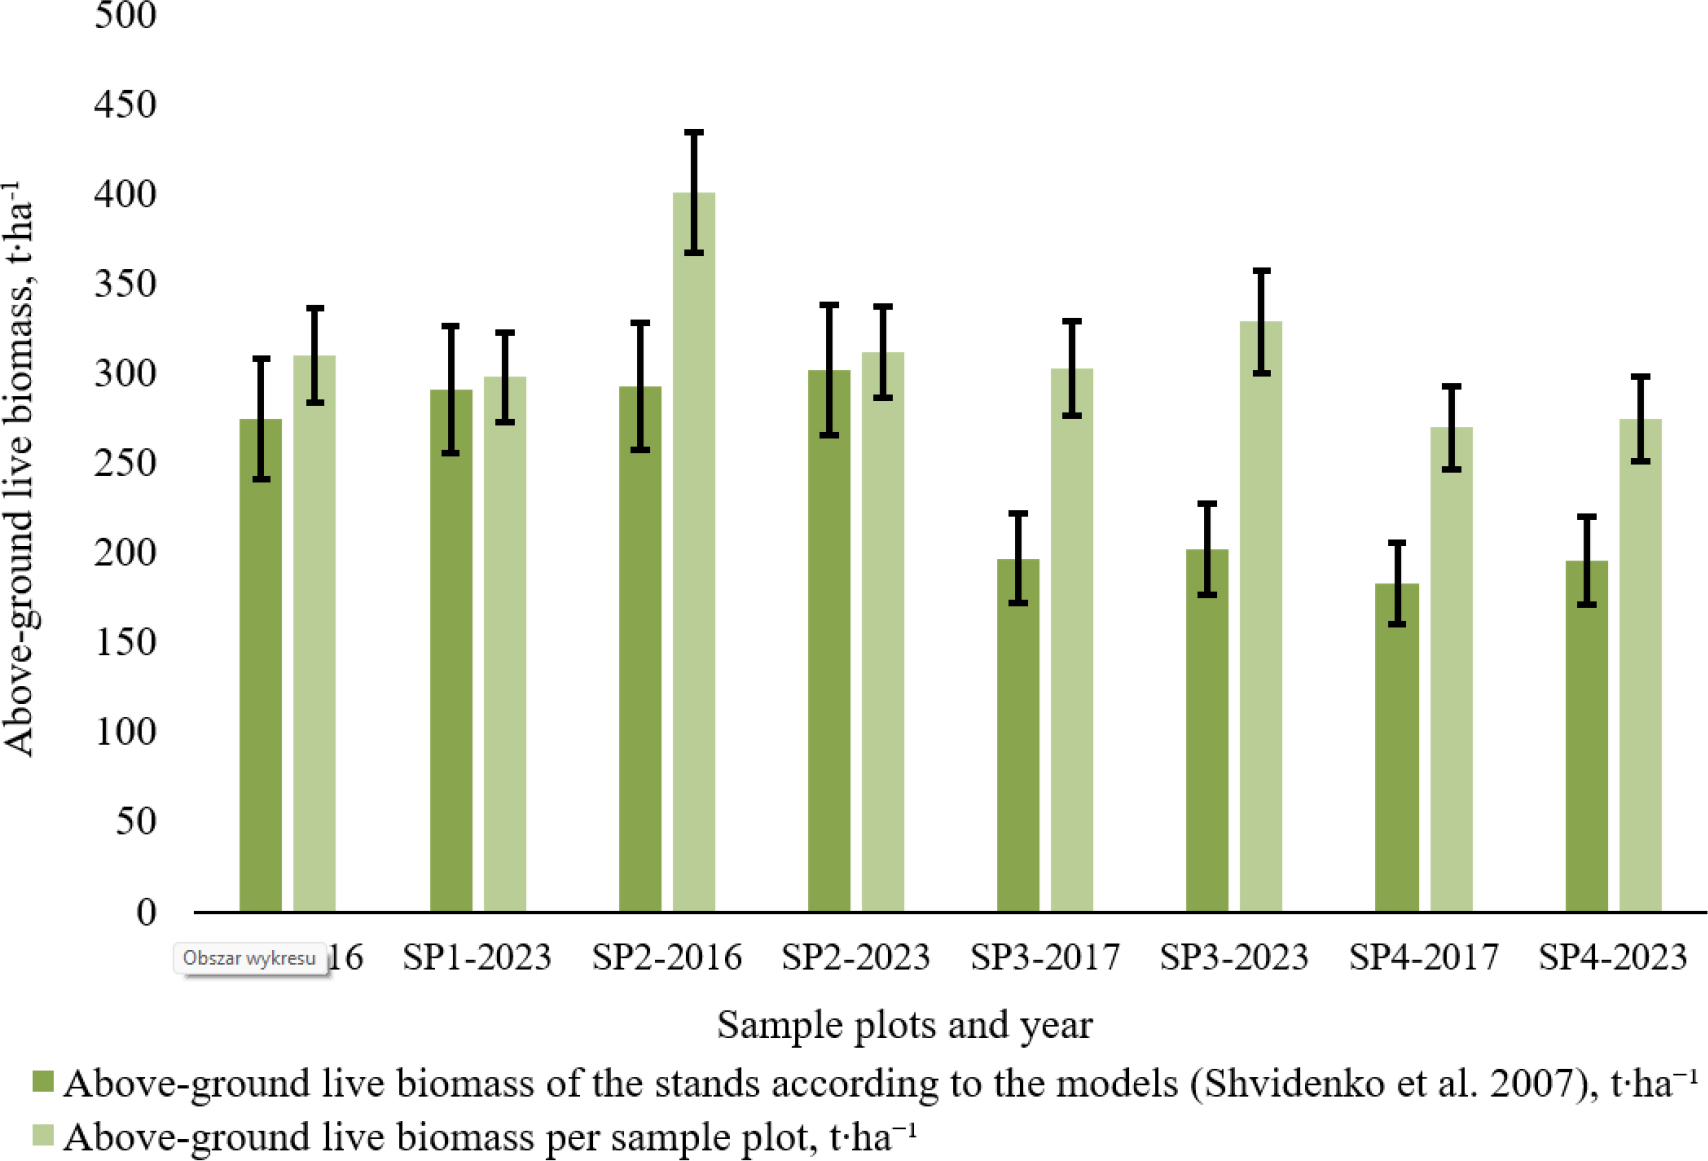
Figure 1.
Above-ground live biomass on the SPs, 2016–2023
Table 3.
Indicators of above-ground live biomass of SPs, 2016–2023
| Sample plots | Year | Above-ground live biomass, t∙ha-1 | Snags, t∙ha-1 | Total biomass of the stand, t∙ha-1 | ||||
|---|---|---|---|---|---|---|---|---|
| stem | coarse branches | small branches | leaves | total biomass | ||||
| 1 | 2016 | 201 | 22 | 70 | 17 | 310 | 3 | 313 |
| 2019 | 201 | 23 | 66 | 16 | 306 | 15 | 321 | |
| 2020 | 196 | 22 | 62 | 15 | 295 | 21 | 316 | |
| 2021 | 191 | 22 | 60 | 15 | 288 | 25 | 313 | |
| 2023 | 199 | 23 | 61 | 15 | 298 | 21 | 319 | |
| 2 | 2016 | 286 | 42 | 59 | 14 | 401 | 8 | 409 |
| 2019 | 287 | 42 | 57 | 14 | 399 | 18 | 417 | |
| 2020 | 287 | 42 | 57 | 14 | 399 | 18 | 417 | |
| 2021 | 294 | 43 | 58 | 14 | 410 | 20 | 430 | |
| 2023 | 233 | 33 | 38 | 9 | 312 | 65 | 377 | |
| 3 | 2017 | 220 | 39 | 35 | 8 | 303 | 0 (0.1) | 303 |
| 2019 | 233 | 42 | 35 | 8 | 318 | 2 | 320 | |
| 2020 | 233 | 41 | 35 | 8 | 318 | 3 | 321 | |
| 2021 | 239 | 43 | 37 | 9 | 328 | 0 (0.3) | 328 | |
| 2023 | 240 | 43 | 37 | 9 | 329 | 6 | 335 | |
| 4 | 2017 | 160 | 20 | 72 | 18 | 270 | 10 | 280 |
| 2019 | 168 | 22 | 73 | 18 | 281 | 11 | 292 | |
| 2020 | 162 | 21 | 70 | 17 | 271 | 20 | 291 | |
| 2021 | 165 | 22 | 69 | 17 | 273 | 19 | 292 | |
| 2023 | 167 | 22 | 69 | 17 | 275 | 24 | 299 | |
During natural competition for space and the subse quent mortality of weakened trees, a significant surge in snag accumulation was observed on SPs (Fig. 2).
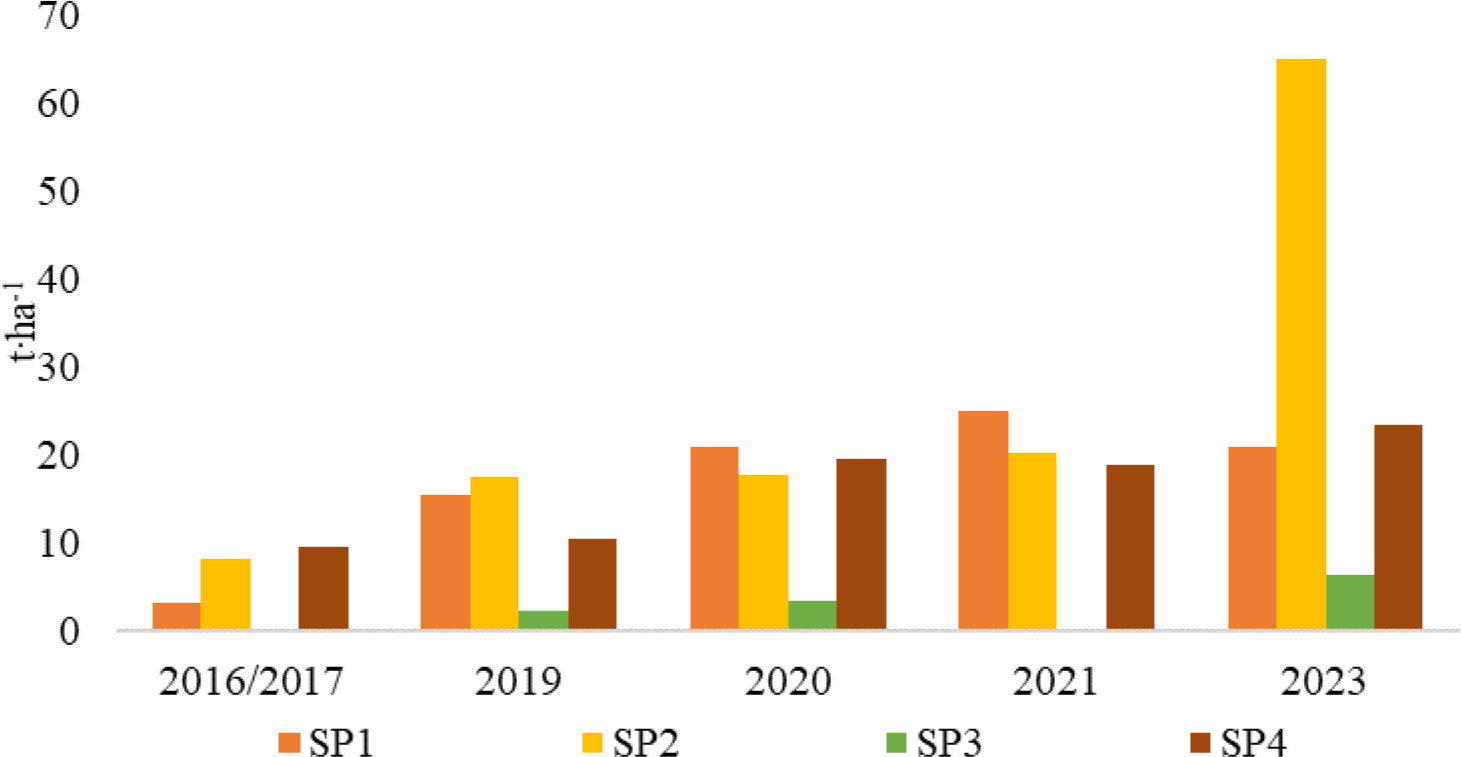
Figure 2.
Snags on the SPs
To verify the accuracy of the live biomass assessment using a model approach, the above-ground live biomass of tree stands in an absolutely dry state was assessed for each tree stand within inventory sections where SPs were established (Shvidenko et al. 2007).
The live biomass assessment results for the studied urban forests were analysed using two approaches (Tab. 4). The first approach involved estimating live biomass with a mathematical equation adapted for the European part of Eurasia, based on the models (Shvidenko et al. 2007). The second approach used data from SPs.
Table 4.
Comparison of above-ground live biomass indicators of tree stands using different assessment approaches, 2016–2023
| Sample plot | Year | Growing stock volume according to forest management planning, m3·ha-1 | Growing stock volume of SP, m3·ha-1 | Deviation, % | Above-ground live biomass of the stands according to the models (Shvidenko et al. 2007), t·ha-1 | Above-ground live biomass of SP, t·ha-1 | Deviation, % |
|---|---|---|---|---|---|---|---|
| 1 | 2016 | 350 | 359 | -3 | 275 | 310 | -11 |
| 2023 | 370 | 353 | 5 | 291 | 298 | -2 | |
| 2 | 2016 | 320 | 507 | -37 | 293 | 401 | -27 |
| 2023 | 340 | 407 | -16 | 302 | 312 | -3 | |
| 3 | 2017 | 290 | 378 | -23 | 197 | 303 | -35 |
| 2023 | 300 | 412 | -27 | 202 | 329 | -39 | |
| 4 | 2017 | 330 | 289 | 14 | 183 | 270 | -32 |
| 2023 | 350 | 299 | 17 | 196 | 275 | -29 |
According to the models developed by Shvidenko et al. (2007), all four SPs in the forest stands showed increases in aboveground live biomass during the study period. However, on SP1 and SP2, the actual live biomass decreased during this period (Fig. 3). The relative deviation of the growing stock volume, according to the model, compared to the SP data ranged from -37% to 17%. The average relative deviation in growing stock volume across all accounting years (2016, 2017, and 2023) was -9%, suggesting a possible systematic underestimation of stem volume data during forest inventory.
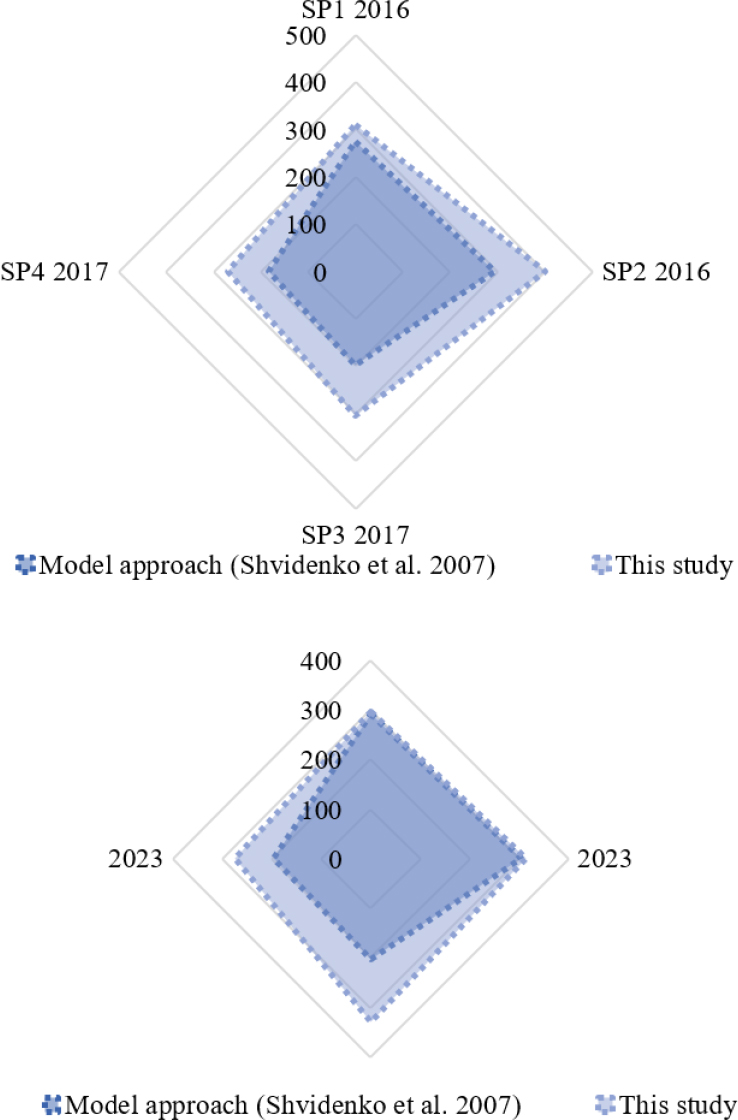
Figure 3
Comparison of parameters of the SP’s total live biomass
The relative deviation of above-ground live biomass, based on the model approach compared to the SPs data, ranged from -39% to -2%, with an average of -22% across all accounting data from 2016 (2017) to 2023. This greater deviation in above-ground live biomass compared to the growing stock volume (over bark) is likely due to the significant influence of crown live biomass on the variability of above-ground live biomass, as well as the difference in growing stock volume derived from forest management planning data and from measurements conducted on permanent sample plots (Tab. 4). Across both observation periods, the approach for above-ground biomass on SPs values consistently yielded higher values than the corresponding model-based estimates for all sample plots, resulting in uniformly positive paired differences. The median difference reached 96.5 t·ha-1 in 2016/2017 and decreased to 44.5 t·ha-1 in 2023, suggesting a persistent positive bias of the SPs data relative to the models. Although the Wilcoxon signed-rank test (Hollander et al. 2014) did not indicate statistical significance (p = 0.125 for both periods), the large effect size (r=0.77) points to a strong and coherent between-method difference, with the non-significant result mainly reflecting the limited sample size.
Discrepancies between model-based and permanent sample plot estimates of above-ground live biomass were additionally evaluated using the mean absolute error (MAE). During the initial observation period (2016/2017), MAE amounted to 84 t·ha-1, reflecting considerable differences between the two estimation approaches. By 2023, MAE had decreased to 55.75 t·ha-1, indicating a closer agreement between model-derived and field-based biomass estimates. The observed reduction in MAE may be attributed to a more accurate determination of growing stock volume obtained in this study using forest management planning methods, compared with standard production measurements applied during routine forest inventory. Variability in growing stock estimates constitutes a major source of uncertainty and directly influences differences in above-ground biomass values produced by the model-based approach.
The assessment and comparison with previous results of the EEI study of the total live biomass of the stands in the Feofania Park for the period 1958–2023 (Bilous et al. 2017), according to the model approach, revealed fluctuations in live biomass density (Tab. 5). Due to periodic changes in the park's area, the analysis focused on the density of above-ground live biomass (t·ha-1) to understand the dynamics. A notable increase in live biomass density (by 57%) was observed from 1958 to 1979. However, by 1991, live biomass density had decreased by 25% compared to 1979. This decline continued alongside reductions in the park area until 2013. Since 2013, with the park's area stabilising at 107 hectares, live biomass density has increased, reaching 241 t·ha-1 (Fig. 4), indicating a trend towards sustainable management of urban forest stands in the park.
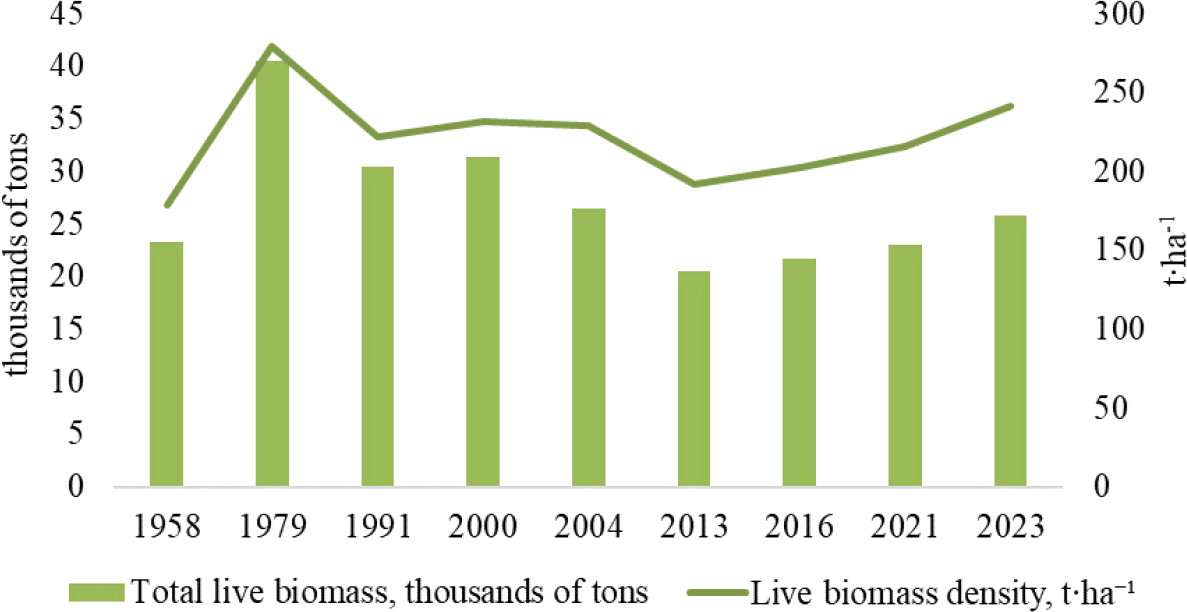
Figure 4.
Live biomass of forest stands of the Feofania Park. Data up to 2013 adapted from the IEE sources (Bilous et al. 2017).
Table 5.
The total live biomass of forest stands of the Feofania Park, 1958–2023
| Year | Area, ha | Live biomass of the forest, thousands of tons | Total live biomass, thousands of tons | Live biomass density, t-ha-1 | ||||||
|---|---|---|---|---|---|---|---|---|---|---|
| stem over bark | bark | branches | leaves | roots | green forest floor | understory and under growth | ||||
| 1958 | 130.6 | 13.7 | 2.1 | 2.9 | 0.3 | 5.4 | 0.5 | 0.5 | 23.3 | 178 |
| 1979 | 144.7 | 24.8 | 3.7 | 5.1 | 0.4 | 9.0 | 0.6 | 0.6 | 40.5 | 280 |
| 1991 | 136.7 | 18.5 | 2.8 | 3.7 | 0.3 | 6.7 | 0.7 | 0.5 | 30.4 | 222 |
| 2000 | 135.7 | 19.3 | 2.8 | 3.8 | 0.3 | 6.5 | 0.7 | 0.8 | 31.4 | 231 |
| 2004 | 115.5 | 16.3 | 2.4 | 3.1 | 0.2 | 5.6 | 0.6 | 0.7 | 26.5 | 230 |
| 2013 | 107.0 | 12.5 | 1.8 | 2.3 | 0.2 | 4.3 | 0.6 | 0.6 | 20.5 | 191 |
| 2016 | 107.0 | 13.2 | 2.0 | 2.5 | 0.2 | 4.6 | 0.6 | 0.6 | 21.6 | 202 |
| 2021 | 107.0 | 14.4 | 2.1 | 2.7 | 0.2 | 4.7 | 0.6 | 0.6 | 23.0 | 215 |
| 2023 | 107.0 | 15.5 | 2.4 | 3.1 | 0.2 | 5.6 | 0.7 | 0.7 | 25.8 | 241 |
1 Source: developed by the authors, data up to 2013 (inclusive), adapted from the IEE sources (Bilous et al. 2017)
The structure of the accumulated total live biomass in various components showed a tendency to increase over the period from 1958 to 2023. The average percentage of stem biomass accounted for 60% of the total live biomass. Among other components, roots accounted for a significant share, comprising 21% of the total live biomass in urban forests. Branches contributed an average of 12%. The green forest floor, understory, and saplings contributed 2%, while leaves accounted for the smallest part of live biomass, less than 1%.
The carbon cycle in forest ecosystems is influenced by the productivity of urban forests, their diversity, and anthropogenic factors. In this context, nature reserve areas provide an important ecological service, particularly as carbon storage. In the floodplain forests of Kyiv, annual carbon sequestration in Quercus robur stems increases with tree age (Prokopuk 2018). Mature oak trees, aged 200 years or more, can sequester up to 20 kg of carbon per year in their stem wood (Prokopuk and Netsvetov 2016).
Based on data on the live biomass of stands, the amount of carbon storage was determined to be 13.0 GgC in 2013 (Fig. 5). The density of stored carbon in the total live biomass of forest stands increased by 27%, from 89 MgC·ha-1 in 1958 to 122 MgC·ha-1 (Tab. 6).
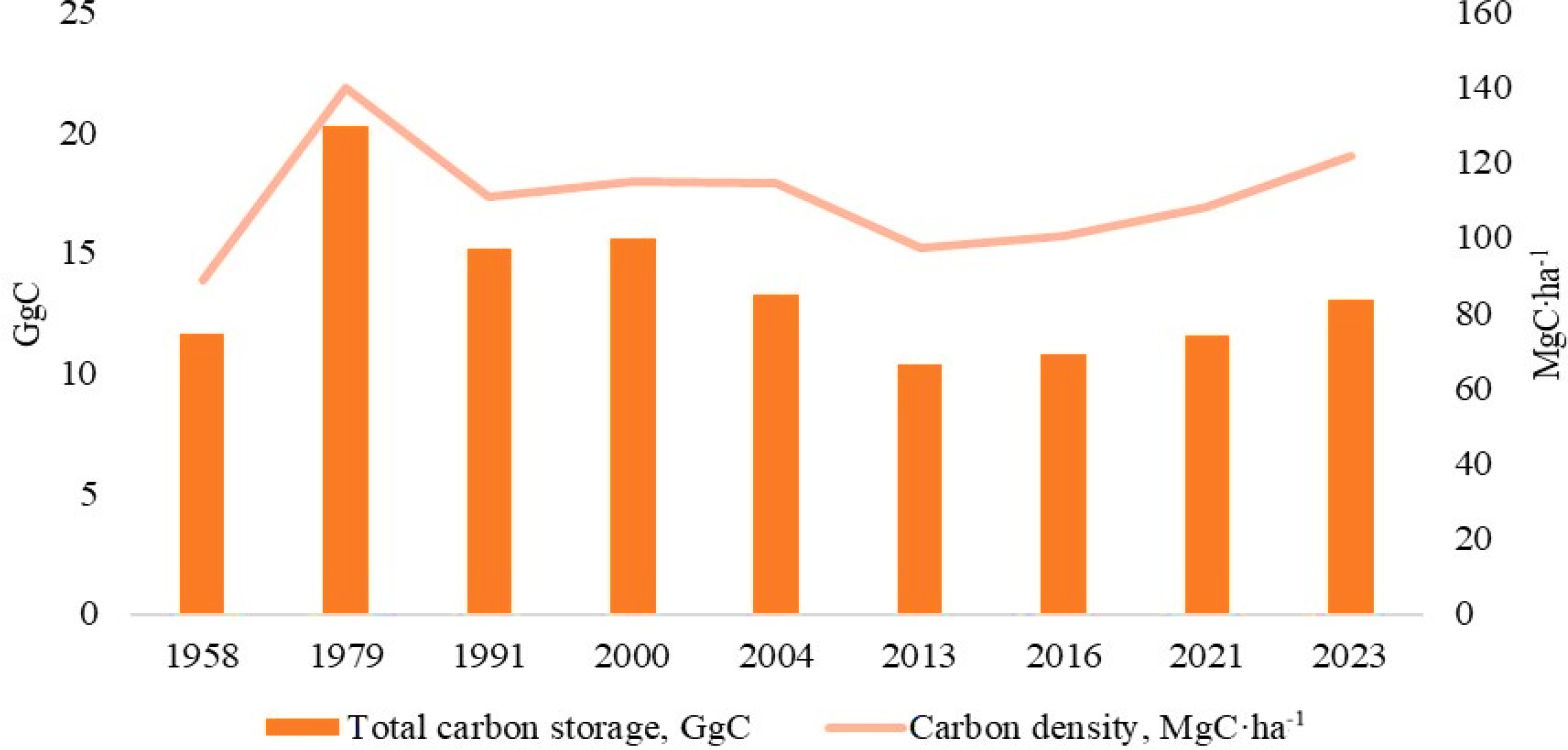
Figure 5.
The carbon storage in the live biomass of forest stands in the Feofania Park, 1958–2023.Data up to 2013 adapted from the IEE sources (Bilous et al. 2017).
Table 6.
The carbon storage in live biomass components. Data up to 2013 adapted from the IEE sources (Bilous et al. 2017).
| Year | Area, ha | Carbon storage in live biomass components, GgC | Total carbon storage, GgC | Carbon density, MgC·ha-1 | ||||||
|---|---|---|---|---|---|---|---|---|---|---|
| stem over bark | bark | branches | leaves | roots | green forest floor | understory and undergrowth | ||||
| 1958 | 130.6 | 6.8 | 1.0 | 1.4 | 0.1 | 2.7 | 0.2 | 0.2 | 11.6 | 89 |
| 1979 | 144.7 | 12.4 | 1.9 | 2.5 | 0.2 | 4.5 | 0.3 | 0.3 | 20.2 | 140 |
| 1991 | 136.7 | 9.2 | 1.4 | 1.8 | 0.1 | 3.4 | 0.3 | 0.3 | 15.1 | 111 |
| 2000 | 135.7 | 9.6 | 1.4 | 1.9 | 0.1 | 3.2 | 0.3 | 0.4 | 15.6 | 115 |
| 2004 | 115.5 | 8.2 | 1.2 | 1.6 | 0.1 | 2.8 | 0.3 | 0.3 | 13.2 | 115 |
| 2013 | 107.0 | 6.3 | 0.9 | 1.2 | 0.1 | 2.1 | 0.3 | 0.3 | 10.2 | 95 |
| 2016 | 107.0 | 6.6 | 1.0 | 1.3 | 0.1 | 2.3 | 0.3 | 0.3 | 10.8 | 101 |
| 2021 | 107.0 | 7.2 | 1.1 | 1.4 | 0.1 | 2.3 | 0.3 | 0.3 | 11.6 | 108 |
| 2023 | 107.0 | 7.8 | 1.2 | 1.6 | 0.1 | 2.8 | 0.4 | 0.4 | 13.0 | 122 |
The highest rate of stem carbon storage was recorded in 1979, at 12.4 GgC (16.8%), while the lowest was recorded in 2013, at 6.3 GgC (8.6%). The reduction in forest area in the park significantly impacted overall carbon storage indicators during the studied period, with a decrease of 23.6 hectares from 1958 to 2013.
Ecosystems provide various services that depend on their species composition, spatial distribution, and other factors. Forest ecosystems, both globally and regionally, are among the primary producers of oxygen. Additionally, the oxygen production capacity of urban forests is a key metric in evaluating ecosystem services, alongside carbon storage and temperature regulation. These functions are essential for enhancing atmospheric air quality and align with the primary objectives of international and national environmental programs, as well as EU Directives ratified by Ukraine (Directive (EU) 2016/2284 2016). In general, the oxygen-producing capacity of urban forest stands of the Feofania Park depends on their area and the dynamics of net primary products (Fig. 6).
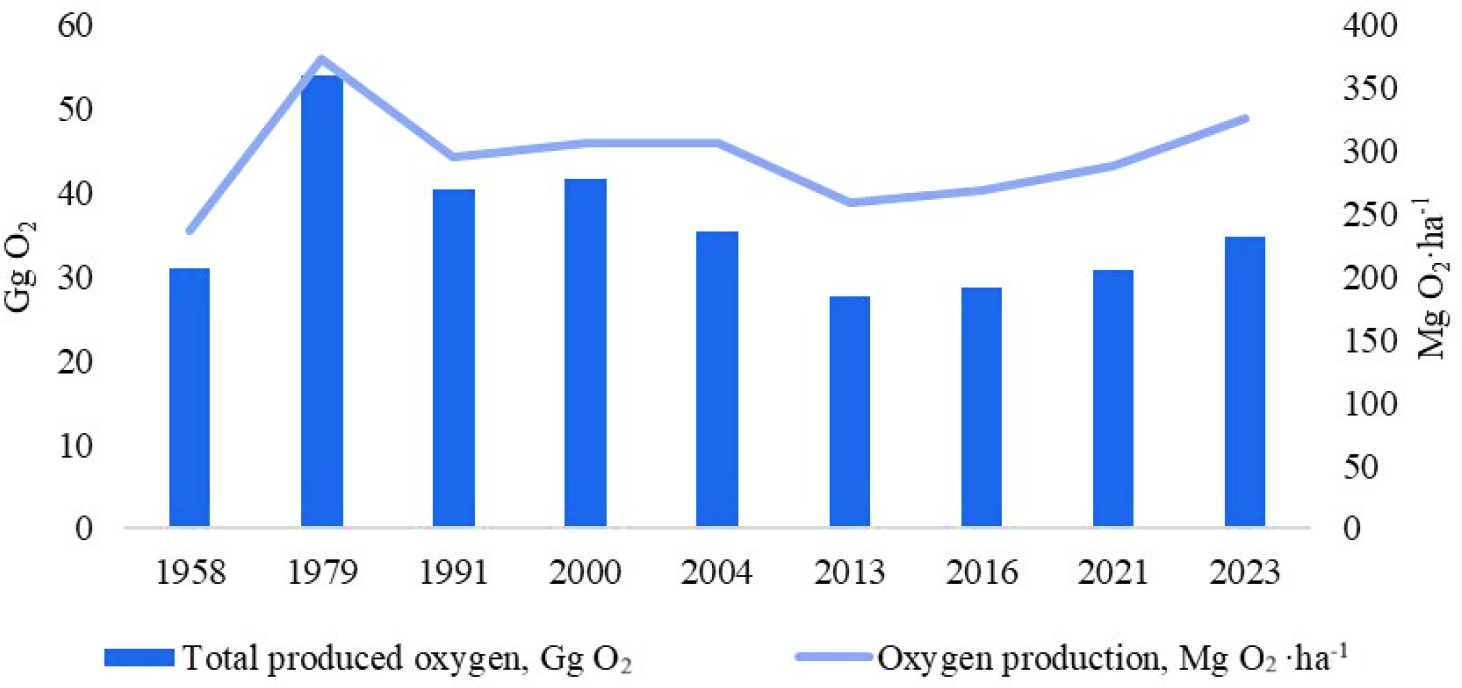
Figure 6.
Oxygen production of forest stands in the Feofania Park, 1958–2023. Data up to 2013 adapted from the IEE sources (Bilous et al. 2017).
The temporal changes in average oxygen production show an increasing trend in recent years, rising from 254 Mg O2∙ha-1 in 2013 to 288 Mg O2∙ha-1 in 2023. Data on the total available live biomass of forests also allow for the estimation of the total amount of oxygen produced during the growth and development of living trees. In 2013, the total amount of oxygen produced was 27 Gg O2, which increased to 31 Gg O2 by 2023. This increase highlights the growing importance of forests in providing essential ecosystem services.
Forest phytocenoses are characterised by long-term carbon storage and gradual carbon emissions, accompanied by energy accumulation and transformation. These processes of substance transformation and circulation reflect the complex relationships within the ecosystem and occur alongside the development of forests' energy potential. A positive energy potential in these ecosystems indicates their sustainable development.
Indicators of the energy potential of the park's forests are derived from storage carbon dynamics. Like carbon dynamics, this indicator also depends on the park's area, which has changed and decreased over the past 65 years. The reduction in the park's area has influenced the varied dynamics of average energy stored in forest biomass, with the highest values recorded in 1979 at 5.0 TJ·ha-1 and the lowest in 1958 at 3.2 TJ∙ha-1 (Fig. 7).
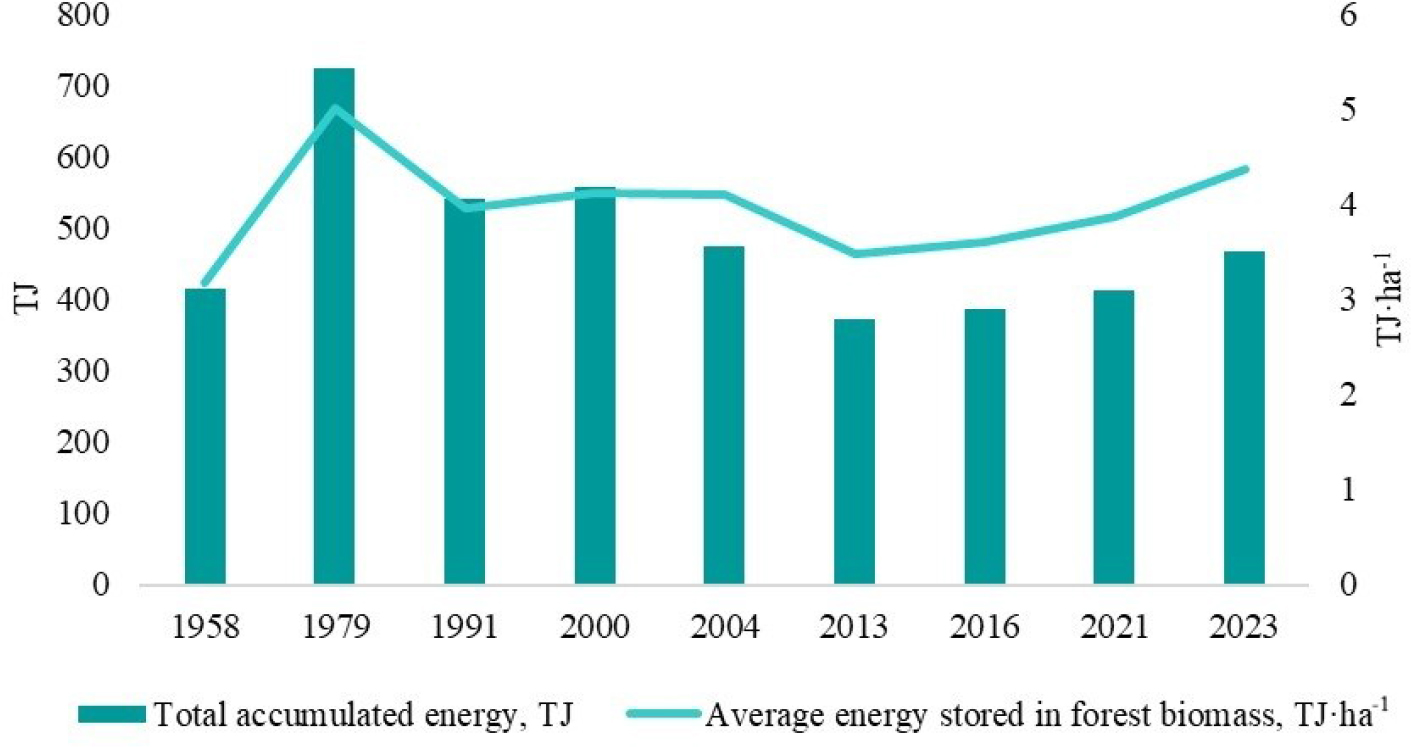
Figure 7.
Energy stored in forest biomass in the Feofania Park, 1958–2023 Data up to 2013 adapted from the IEE sources (Bilous et al. 2017).
In recent years, there has been a clear trend of increasing energy potential in the forests, indicating stable development and the establishment of robust energy dynamics within the forest ecosystem. By 2023, the average energy stored in forest biomass had reached 4.4 TJ·ha-1. Given the park's conservation status, this stable energy potential is essential for preserving biodiversity across various ecosystem levels and ensuring the continued functionality of the urban forest stands.
Conclusions
This research provides validation of a biomass-based modelling approach at the forest-stand level using long term observations from permanent sample plots established in the urban forests of Feofania Park. The comparison of model-based estimates with field measurements indicates that applying generalised biomass models to individual urban forest stands is associated with considerable uncertainty. This effect is most pronounced in structurally complex and uneven-aged stands with an increased share of dead trees, where tree mortality and crown biomass substantially influence overall above ground biomass dynamics.
At the same time, the results show that the consistency of model-based biomass estimates increases when data are analysed for a set of forest stands rather than at the plot level. This pattern suggests that deviations are primarily driven by differences in the assessment of growing stock volume during forest management planning and by the structural heterogeneity typical of urban and protected forests, rather than by deficiencies in the model approach itself. Consequently, the accuracy of growing stock volume assessment remains a key prerequisite for the reliable application of biomass-based models in forest ecosystems.
The analysis also confirms the role of stand age and structural characteristics in shaping biomass dynamics and ecosystem service provision. Younger stands are characterised by higher relative biomass increment, whereas older, mixed and structurally complex stands dominated by mature oak trees store the largest proportion of carbon. These results emphasise the functional importance of structurally diverse urban forests for the long-term maintenance of ecosystem functions.
In summary, biomass-based models may be suitable for large-scale assessments of forest biomass and ecosystem services in urban and protected forests, provided that their limitations at the stand level are explicitly recognised. The combined use of model-based estimates and permanent sample plot data represents an effective approach for urban and protected forest monitoring and for supporting forest management decisions aimed at sustainable development.
Acknowledgements
This research was supported by the State Institution “Institute for Evolutionary Ecology of the National Academy of Sciences of Ukraine”. The authors gratefully acknowledge Academician of the National Academy of Sciences of Ukraine Volodymyr Radchenko, Corresponding Member of the National Academy of Sciences of Ukraine Maksym Netsvetov and Prof. Vasyl Budzhak for their valuable contributions to methodological discussions, which were instrumental to this work.
Notes
[2] Conflicts of interest Conflict of interest
The authors declare no conflict of interest.