
Introduction
Beetles (Coleoptera) predominate among dendrophilic insects or xylobionts (Speight 1989; Gossner et al. 2019; Diedus et al. 2022). Some of them are associated with wood, wood fungi, and myxomycetes, and are pests of viable trees, wood destroyers, predators, or vectors of tree pathogens (Chumak 2017; Zou et al. 2023; Peris and Condamine 2024). The ratio of insect trophic groups varies across regions, ecological conditions, habitats, and food sources (Warzée et al. 2006; Bergman et al. 2025). Human activity, including forest management and recreation, affects the number of habitats and nutrient substrates for dendrophilic insects, disrupting trophic chains, circulation of substances in the forest ecosystem, and, in particular, carbon deposition (Gossner et al. 2019; Holuša et al. 2021; Bergman et al. 2025). In this regard, the species composition of dendrophilic insects and certain trophic groups can be the indicators of the health and productivity of forest ecosystems (Shan and Ma 2026). In national natural parks, forestry activities and recreation (the main types of anthropogenic influence) are limited in certain territories (zones). Therefore, it is possible to evaluate and compare the taxonomic structure of dendrophilic beetles, their trophic specialization, and biodiversity, which is necessary to predict possible negative consequences for forests in the future and take preventive measures.
In 2019, we started such research in deciduous stands of Gomilshanski lisy National Nature Park (NNP), which covers the forest-steppe natural complexes of the Seversky Donets valley and is included in the List of officially adopted Emerald Network sites – UA0000034 Gomilshanski lisy NNP (List of officially adopted Emerald Network sites 2020). During the analysis, 200 species of dendrophilic Coleoptera from 130 genera and 40 families were identified. The dependence of diversity indices on anthropogenic load was established, particularly the greatest difference between the complexes of dendrophilic Coleoptera of the protected zone and the plot of clear felling (Bieliavtsev and Skrylnyk 2020; Skrylnyk and Bieliavtsev 2020; Bieliavtsev 2021). However, the dominance of Xyleborini (Curculionidae: Scolytinae) in all sample plots (Meshkova et al. 2022) could have influenced the conclusion.
In this study, we focused on predatory beetles. Predatory beetles are often used to evaluate the impact of forest management on biodiversity (Gencal and Sarikaya 2023; Kempraj and Park 2024; Miller and Sweeney 2025). At the same time, predators can increase biodiversity by reducing competition among prey species, but intense predation can also cause the local extinction of certain species. Predatory forest insects are most often considered potential biocontrol agents (Gossner et al. 2019; Holuša et al. 2025; Meshkova et al. 2025). In fact, most predators prey on any species they can capture, as well as different developmental stages of prey species, other predators, or even various stages of their own species. A wider host spectrum allows them to remain active during different seasons. In the lack of a food source, monophagous predators risk extinction or are forced to migrate to another forest plot (Marrec et al. 2021; Zajicek et al. 2021).
The purpose of this research was to assess the species composition and biodiversity indices of predatory beetles collected by window traps in the zones of Gomilshanski lisy National Nature Park with different management regimes and anthropogenic loading.
Material and methods
The research was conducted in 2019–2022 within the Gomilshanski lisy National Nature Park (NNP). The territory of Gomilshanski lisy NNP is located within the leftbank forest-steppe zone of Ukraine, in Kharkiv region (49°35’ N 36°19’ E), in the Seversky Donets valley (Fig. 1). The climate of the region is temperate-continental. The average long-term temperature in January is -5.0°C, in July +22.0°C. The average annual precipitation is 522.4 mm (Meshkova et al. 2022). Sample plots were established in the deciduous stands of 80–100 years old with Quercus robur L. as the main forest-forming species, including also Fraxinus excelsior L., Tilia cor-data Mill., Acer platanoides L., Betula pendula Roth. and Ulmus laevis Pall. in the stand composition.
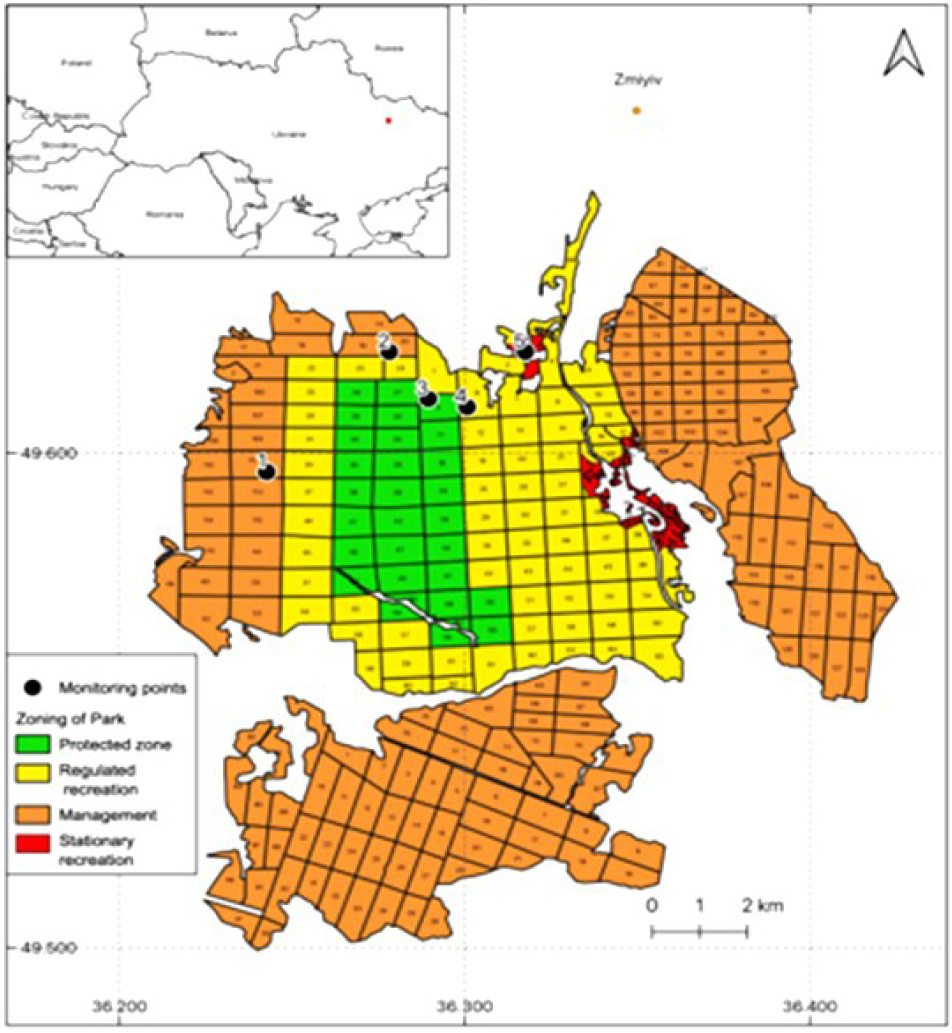
Figure 1.
Location of Gomilshanski lisy National Nature Park and sample plots (1 – plot of clear felling in the managed zone; 2 – plot of selective sanitary felling in the managed zone; 3 – protected zone; 4 – zone of regulated recreation; 5 – zone of stationary recreation) (Meshkova et al. 2022)
Sample plots were established in each of the zones of the Gomilshansky lisy NNP: two sample plots in the forest management zone and one sample plot in each of the protected, regulated recreation, and stationary recreation zones (see Fig. 1).
Four window traps (flight interception traps) of our own design (Skrylnyk and Bieliavtsev 2020; Meshkova et al. 2022) were placed in each of the five groups of sample plots:
– clear felling in 2019 in the managed zone (49.5962° N, 36.2427° E);
– selective sanitary felling in 2019 in the managed zone (49.6204° N, 36.2782° E);
– regulated recreation (moderate recreational load) (49.6092° N, 36.3007° E);
– stationary recreation (location of recreation centers) (49.6204° N, 36.3176° E);
– protected zone (forest management activity and recreational load is absent) (49.6109° N, 36.2895° E).
Every 10 days, from the second ten days of April to the second ten days of October, in 2019, 2020, 2021, and 2022, insects were collected from traps in all sample plots, placed in separate Eppendorf tubes, and labeled with the trap number and sampling date. In the laboratory, the material was partly mounted for identification, and the rest was stored on cotton mattresses for measurement and other research.
Insect species were identified using a microscope MBS-9, special publications (Kuhnt 1913; Johansen 1914; Freude et al. 1964, 1974; Assing and Schülke 2012; Krivosheyev 2014; Krivosheyev et al. 2025), database Danbillerbank (https://www.danbiller.dk/), Käfer Europas (https://coleonet.de/), and our own observations (Bieliavtsev and Skrylnyk 2020; Bieliavtsev 2021) and compared with the specimens from the collections of the Forest Protection Laboratory of Ukrainian Research Institute of Forestry and Forest Melioration and Kharkiv Entomological Society.
Species names are presented according to Fauna Europaea (de Jong 2016).
The proportions of species and specimens in sample plots and zones were compared using a z-test in the two proportions comparisons (StatisticsLectures.com. Z-Test for Proportions, Two Samples 2017). The difference between the proportions was considered significant for p < 0.05 at z > 1.96.
The dominance of each predator species (relative D) was calculated as the proportion of individuals in the sample plot or zone. It was assessed by dominance classes according to the Stocker-Bergmann scale (Stocker and Bergmann 1977): eudominants (more than 33%), dominants (10.1–33.0%), subdominants (3.1–10.0%), recedents (1.0–3.0%), and subrecedents (less than 1.0%).
Frequency of occurrence (F, %) of each predator species was calculated as the proportion of samples with this species present (Hilszczański et al. 2019).
Synthetic index (Q) was calculated as the geometric mean of dominance (D) and the frequency of occurrence of each predator species in the given sample plot (F) (Hilszczański et al. 2019).
The diversity of predatory beetles was assessed by the number of species (S), the number of individuals (N), and the Shannon Diversity Index (H) (2), which considers both species richness (number of species) and evenness (relative abundance).
where pi is the proportion of individuals of species i relative to the total number of individuals.The Hutcheson t-test for pairwise comparison of Shannon indices was calculated for groups of sample plots.
To compare predatory beetle species community in the sample plots and zones, the Sörensen-Czekanowski index (Csc) was calculated (3) (Leontyev 2007).
where:a – number of species in the first sample, b – number of species in the second sample, c – number of species presented in both samples.
The Ward method of hierarchical clustering was used to compare the predatory beetle community at the sample plots by frequency of occurrence (F) and the synthetic index (Q). The evaluation of Shannon Diversity Index, the Hutcheson t-test for pairwise comparison of sample plots, and clustering were performed using the statistical software package PAST (Hammer et al. 2001).
Results
A total of 36 species of predatory beetles from 24 genera and 10 families were caught using window traps in the sample plots (Tab. 1). Most of these species are predators at the larval and adult stages, while the adults of four species (Aplocnemus impressus, Dasytes fusculus, D. niger, and D. plunbeus) are pollinophagous. Some Histeridae (Paromalus flavicornis, P. parallelepipedus, and Platysoma compressum, as well as Tenebrionidae (Corticeus bicolor) are facultative predators, and Salpingidae (Salpingus planirostris, S. ruficollis, and Vincenzellus ruficollis) are also mycetophagous.
Table 1.
Taxonomy of Coleopterous predators in the sample plots of Gomilshanski Lisy NNP
| Family, Species | Family, Species |
|---|---|
| Family Histeridae | Family Cantharidae |
| 1. Acritus minutus (Herbst, 1792) | 22. Malthinus flaveolus (Herbst, 1786) |
| 2. Dendrophilus punctatus (Herbst, 1792) | Family Trogossitidae |
| 3. Paromalus flavicornis (Herbst, 1792) | 23. Nemozoma caucasicum Ménétriés, 1832 |
| 4. Paromalus parallelepipedus (Herbst, 1792) | 24. Nemozoma elongatum (Linnaeus, 1761) |
| 5. Platysoma compressum Herbst, 1783 | 25. Tenebroides fuscus (Goeze, 1777) |
| 6. Teretrius fabricii Mazur, 1972 | Family Cleridae |
| Family Staphylinidae | 26. Clerus mutillarius Fabricius, 1775 |
| 7. Thoracophorus corticinus Motschulsky, 1837 | 27. Thanasimus formicarius (Linnaeus, 1758) |
| 8. Bibloporus minutus Raffray, 1914 | 28. Korynetes caeruleus (De Geer, 1775) |
| 9. Bibloporus ultimus Guillebeau, 1892 | Family Rhadalidae |
| 10. Ctenistes palpalis (Reichenbach, 1816) | 29. Aplocnemus impressus (Marsham, 1802) |
| 11. Euplectus duponti Aubé, 1833 | Family Melyridae |
| 12. Euplectus karstenii (Reichenbach, 1816) | 30. Dasytes fusculus (Illiger, 1801) |
| 13. Euplectus mutator Fauvel, 1895 | 31. Dasytes niger (Linnaeus, 1761) |
| 14. Euplectus punctatus Mulsant et Rey, 1861 | 32. Dasytes plumbeus (Müller, 1776) |
| 15. Euplectus signatus (Reichenbach, 1816) | Family Salpingidae |
| 16. Lordithon lunulatus (Linnaeus, 1760) | 33. Salpingus planirostris (Fabricius, 1787) |
| 17. Sepedophilus bipustulatus (Gravenhorst, 1802) | 34. Salpingus ruficollis Linnaeus, 1761 |
| 18. Sepedophilus immaculatus (Stephens, 1832) | 35. Vincenzellus ruficollis (Panzer, 1794) |
| 19. Tachyporus corpulentus Sahlberg, 1876 | Family Tenebrionidae |
| 20. Tachyporus dispar (Paykull, 1789) | 36. Corticeus bicolor (Olivier, 1790) |
| Family Elateridae | |
| 21. Lacon lepidopterus (Panzer, 1800) |
Staphylinidae dominated in both species and specimens. Histeridae and Cleridae took second and third place (Fig. 2).
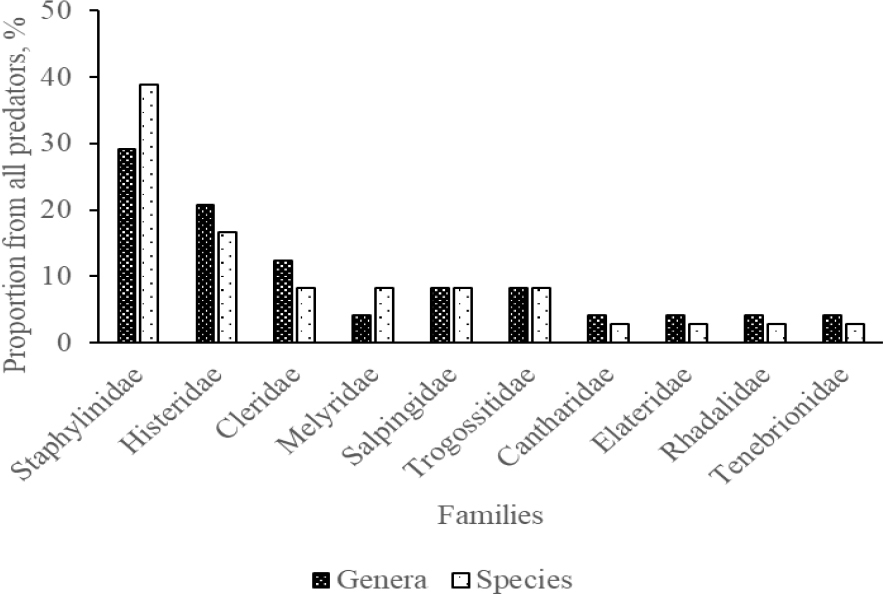
Figure 2.
The proportion of genera and species of individual families in the total number of trapped predators in Gomilshanski lisy NNP (pooled sample)
The proportion of predator species among trapped Coleoptera is significantly lower in both recreation sample plots compared to other plots (Tab. 2).
Table 2.
The two-proportion Z-test for pairwise comparison of predator species proportion among trapped Coleoptera across sample plots and zones in Gomilshanski lisy NNP (Clear fell. – clear felling in the managed zone; Sel. fell. – selective sanitary felling in the managed zone; Stat. recr. – zone of stationary recreation; Reg. recr. - zone of regulated recreation; Prot. – protected zone; Z0.05 = 1.96; Z0.01 = 3.96; bold Z shows the significant differences between sample plots; proportions in the parentheses)
| Sample plots | Sel. fell. (17.2 %) | Stat. recr. (15.5 %) | Reg. recr. (15.4 %) | Prot. (18.5 %) |
|---|---|---|---|---|
| Clear fell. (13.4 %) | -0.69 | -2.23 | -2.48 | -0.94 |
| Sel. fell. (17.2 %) | – | 0.31 | 0.32 | -0.23 |
| Stat. recr. (15.5 %) | – | – | 0.02 | -0.55 |
| Reg. recr. (15.4 %) | – | – | – | -0.56 |
The Shannon Index was the lowest in the sample plot of clear felling (H=1.61), and its values in all other groups of sample plots and zones were very close (2.45–2.53) (Fig. 3). The Hutcheson t-test for pairwise comparison of Shannon indices proves a significant difference in the Shannon Index in the clear felling plot and other groups of sample plots (Tab. 3).
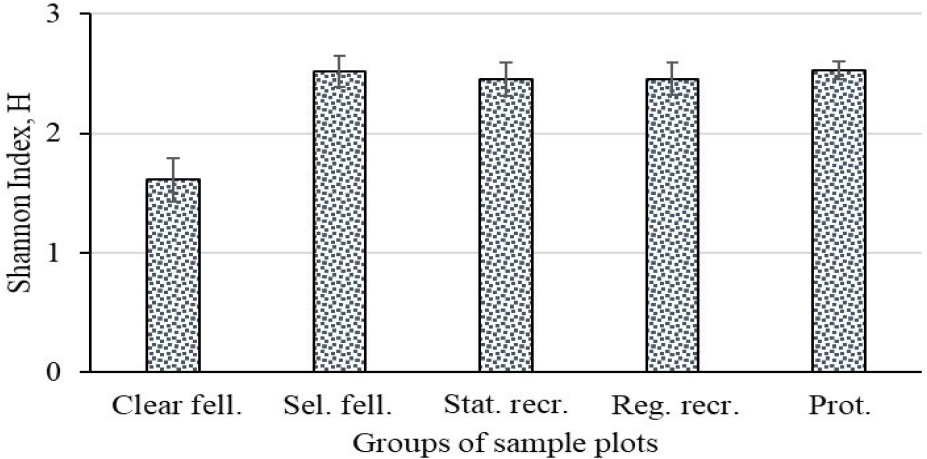
Figure 3.
Shannon Index (±standard deviation) in sample plots and zones in Gomilshanski lisy NNP (H – Shannon Index; Clear fell. – clear felling in the managed zone; Sel. fell. – selective sanitary felling in the managed zone; Stat. recr. – zone of stationary recreation; Reg. recr. – zone of regulated recreation; Prot. – protected zone)
Table 3.
The Hutcheson t-test for pairwise comparison of Shannon indices across sample plots and zones in Gomilshanski lisy NNP (Clear fell. – clear felling in the managed zone; Sel. fell. – selective sanitary felling in the managed zone; Stat. recr. – zone of stationary recreation; Reg. recr. – zone of regulated recreation; Prot. – protected zone; numerator – t, denominator – p; bold t shows the significant differences between sample plots; Shannon index H is in the parentheses)
| Sample plots | Sel. fell. (2.52) | Stat. recr. (2.45) | Reg. recr. (2.46) | Prot. (2.53) |
|---|---|---|---|---|
| Clear fell. (1.61) | -4.04 / 0.0001 | -3.63 / 0.0005 | -3.72 / 0.0003 | -4.61 / 1.56E-05 |
| Sel. fell. (2.52) | – | 0.38 / 0.71 | 0.35 / 0.72 | -0.03 / 0.98 |
| Stat. recr. (2.45) | – | – | -0.03 / 0.97 | -0.48 / 0.63 |
| Reg. recr. (2.46) | – | – | – | -0.46 / 0.65 |
Data analysis shows that eudominants, according to the Stocker-Bergmann dominance classes, are absent in the pooled sample of predators (Fig. 4). Two species (C. mutillarius and P. flavicornis) are dominants (5.6%), eight species (22.2%) are subdominants, nine species (25%) are recedents, and 17 species (47.2%) are subrecedents (Fig. 4, 5).
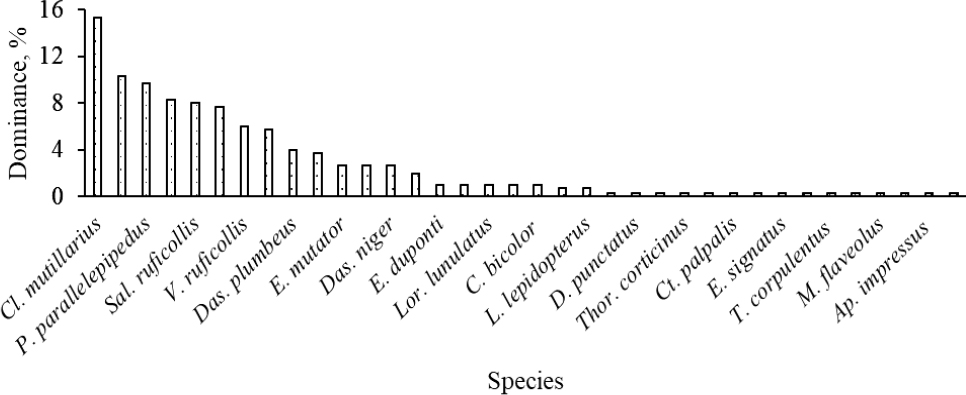
Figure 4.
Dominance of predatory beetle species in window traps in Gomilshanski lisy NNP (pooled sample)
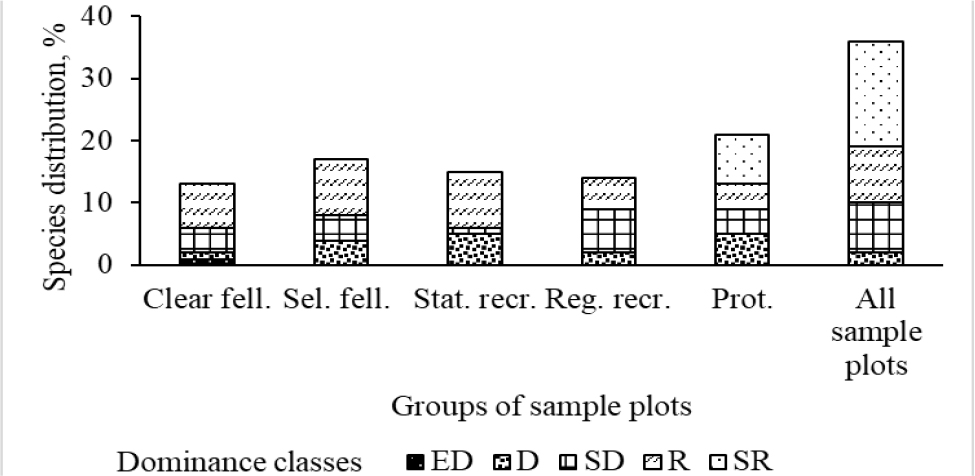
Figure 5.
Distribution of predatory beetles in Gomilshanski lisy NNP by Stöcker-Bergmann dominance classes (ED – eudominants; D – dominants; SD – subdominants; R – recedents; SR – subrecedents) in different groups of sample plots of Gomilshanski lisy National Nature Park. (Clear fell. – clear felling in the managed zone Sel. fell. – selective sanitary felling in the managed zone; Stat. recr. – zone of stationary recreation; Reg. recr. – zone of regulated recreation; Prot. – protected zone)
However, C. mutillarius was eudominant only in the clear felling sample plot (see Tab. 4). It is subdominant in the selective sanitary felling sample plot and in the zone of stationary recreation, subdominant in the zone of regulated recreation, and subrecedent in the protected zone. Another well-known bark beetle predator – T. formicarius was not trapped in the sample plot of selective sanitary felling and zone of stationary recreation, and was represented in greater numbers in the protected zone than in the plot of clear felling. At the same time, according to the Stocker-Bergmann dominance classes, T. formicarius was dominant only in the sample plot of clear felling. In the zone of regulated recreation and the protected zone, it was subdominant.
Table 4.
Dominance (D) and frequency of occurrence (F) of predatory beetle species in groups of sample plots and zones of Gomilshanski lisy NNP
| Predatory beetle species | Dominance, % (D) | Frequency of occurrence, % (F) | ||||||||
|---|---|---|---|---|---|---|---|---|---|---|
| Clear fell. | Sel. fell. | Stat. recr. | Reg. recr. | Prot. | Clear fell. | Sel. fell. | Stat. recr. | Reg. recr. | Prot. | |
| A. minutus | 0.00 | 0.00 | 2.94 | 0.00 | 0.00 | 0.00 | 0.00 | 3.13 | 0.00 | 0.00 |
| D. punctatus | 0.00 | 0.00 | 0.00 | 0.00 | 0.75 | 0.00 | 0.00 | 0.00 | 0.00 | 3.13 |
| P. flavicornis | 5.17 | 6.82 | 11.76 | 0.00 | 15.67 | 6.25 | 6.25 | 6.25 | 0.00 | 12.50 |
| P. parallelepipedus | 5.17 | 6.82 | 14.71 | 6.25 | 11.94 | 6.25 | 6.25 | 6.25 | 6.25 | 28.13 |
| Pl. compressum | 1.72 | 11.36 | 2.94 | 6.25 | 10.45 | 3.13 | 12.50 | 3.13 | 6.25 | 34.38 |
| Ter. fabricii | 0.00 | 0.00 | 2.94 | 0.00 | 0.00 | 0.00 | 0.00 | 3.13 | 0.00 | 0.00 |
| Thor. corticinus | 1.72 | 0.00 | 0.00 | 0.00 | 0.00 | 3.13 | 0.00 | 0.00 | 0.00 | 0.00 |
| B. minutus | 0.00 | 0.00 | 0.00 | 0.00 | 0.75 | 0.00 | 0.00 | 0.00 | 0.00 | 3.13 |
| B. ultimus | 0.00 | 0.00 | 0.00 | 0.00 | 1.49 | 0.00 | 0.00 | 0.00 | 0.00 | 6.25 |
| Ct. palpalis | 0.00 | 2.27 | 0.00 | 0.00 | 0.00 | 0.00 | 3.13 | 0.00 | 0.00 | 0.00 |
| E. duponti | 0.00 | 2.27 | 0.00 | 0.00 | 1.49 | 0.00 | 3.13 | 0.00 | 0.00 | 3.13 |
| E. karstenii | 0.00 | 0.00 | 0.00 | 0.00 | 2.24 | 0.00 | 0.00 | 0.00 | 0.00 | 9.38 |
| E. mutator | 0.00 | 2.27 | 0.00 | 6.25 | 3.73 | 0.00 | 3.13 | 0.00 | 6.25 | 6.25 |
| E. punctatus | 0.00 | 0.00 | 2.94 | 0.00 | 0.00 | 0.00 | 0.00 | 3.13 | 0.00 | 0.00 |
| E. signatus | 0.00 | 0.00 | 2.94 | 0.00 | 0.00 | 0.00 | 0.00 | 3.13 | 0.00 | 0.00 |
| Lor. lunulatus | 0.00 | 2.27 | 0.00 | 0.00 | 1.49 | 0.00 | 3.13 | 0.00 | 0.00 | 6.25 |
| Sep. bipustulatus | 0.00 | 2.27 | 0.00 | 3.13 | 4.48 | 0.00 | 3.13 | 0.00 | 3.13 | 15.63 |
| Sep. immaculatus | 0.00 | 0.00 | 0.00 | 0.00 | 0.75 | 0.00 | 0.00 | 0.00 | 0.00 | 3.13 |
| T. corpulentus | 0.00 | 2.27 | 0.00 | 0.00 | 0.00 | 0.00 | 3.13 | 0.00 | 0.00 | 0.00 |
| T. dispar | 0.00 | 2.27 | 0.00 | 0.00 | 0.00 | 0.00 | 3.13 | 0.00 | 0.00 | 0.00 |
| L. lepidopterus | 1.72 | 0.00 | 0.00 | 3.13 | 0.00 | 3.13 | 0.00 | 0.00 | 3.13 | 0.00 |
| M. flaveolus | 0.00 | 2.27 | 0.00 | 0.00 | 0.00 | 0.00 | 3.13 | 0.00 | 0.00 | 0.00 |
| N. caucasicum | 0.00 | 0.00 | 14.71 | 15.63 | 0.75 | 0.00 | 0.00 | 6.25 | 3.13 | 3.13 |
| N. elongatum | 0.00 | 0.00 | 14.71 | 9.38 | 0.00 | 0.00 | 0.00 | 6.25 | 9.38 | 0.00 |
| Ten. fuscus | 0.00 | 0.00 | 5.88 | 0.00 | 0.75 | 0.00 | 0.00 | 3.13 | 0.00 | 3.13 |
| Cl. mutillarius | 58.62 | 13.64 | 11.76 | 3.13 | 0.75 | 25.00 | 15.63 | 9.38 | 3.13 | 3.13 |
| Th. formicarius | 10.34 | 0.00 | 0.00 | 9.38 | 5.97 | 12.50 | 0.00 | 0.00 | 9.38 | 21.88 |
| K. caeruleus | 1.72 | 0.00 | 0.00 | 0.00 | 0.00 | 3.13 | 0.00 | 0.00 | 0.00 | 0.00 |
| Ap. impressus | 1.72 | 0.00 | 0.00 | 0.00 | 0.00 | 3.13 | 0.00 | 0.00 | 0.00 | 0.00 |
| Das. fusculus | 0.00 | 0.00 | 2.94 | 0.00 | 0.00 | 0.00 | 0.00 | 3.13 | 0.00 | 0.00 |
| Das. niger | 0.00 | 13.64 | 2.94 | 3.13 | 0.00 | 0.00 | 15.63 | 3.13 | 3.13 | 0.00 |
| Das. plumbeus | 3.45 | 18.18 | 0.00 | 3.13 | 0.75 | 6.25 | 6.25 | 0.00 | 3.13 | 3.13 |
| Sal. planirostris | 1.72 | 4.55 | 0.00 | 18.75 | 11.94 | 3.13 | 6.25 | 0.00 | 18.75 | 34.38 |
| Sal. ruficollis | 5.17 | 2.27 | 0.00 | 6.25 | 13.43 | 9.38 | 3.13 | 0.00 | 6.25 | 40.63 |
| V. ruficollis | 0.00 | 4.55 | 2.94 | 6.25 | 9.70 | 0.00 | 3.13 | 3.13 | 6.25 | 21.88 |
| C. bicolor | 1.72 | 0.00 | 2.94 | 0.00 | 0.75 | 3.13 | 0.00 | 3.13 | 0.00 | 3.13 |
Subrecedents make up 38.1% in the protected zone, where the total number of trapped predators is the largest, and are absent in other groups of sample plots, so their proportion in the total catches in all sample plots reaches 47.2% (see Fig. 5). The most recedents were trapped in the plots with felling and in the zone of stationary recreation.
Only in one sample plot, 17 predatory beetle species were trapped; three times fewer species were trapped in two, three, and four sample plots, and only 3 species in all five sample plots (Fig. 6).
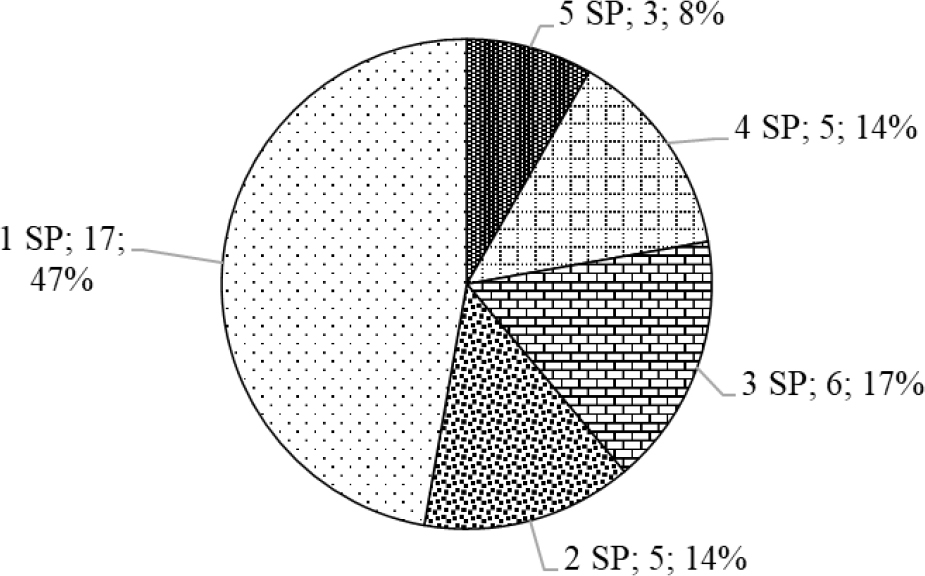
Figure 6.
Distribution of predatory beetle species by presence in sample plots (SP) of Gomilshanski lisy NNP (1 SP – 5 SP – number of sample plots with the presence of respective number of species; number of species; proportion of all species in the pooled sample)
Seventeen species of predators were found only in one sample plot each: 3 species (Thor. corticinus, K. caeruleus and Ap. impressus) only in the clear felling plot, 4 species (Ct. palpalis, T. corpulentus, T. dispar and M. flaveolus) only in the selective sanitary felling plot, 5 species (A. minutus, Ter. fabricii, E. punctatus, E. signatus and Das. fusculus) only in the stationary recreation zone, 5 species (D. punctatus, B. minutus, B. ultimus, E. karstenii and Sep. immaculatus) only in the protected zone. No species was recorded exclusively in the regulated recreation zone (see Tab. 4). P. parallelepipedus, P. compressum, and C. mutillarius were found in all sample plots. The first two species are facultative predators and/or facultative sapromycetophages, and their frequency of occurrence was highest in the protected zone.
By frequency of occurrence, predatory beetle species are unevenly distributed in individual sample areas (Tab. 4, 5). Thus, in the protected zone, Sal. ruficollis (F = 40.6%) is in first place. In the clear felling plot, it is in the third place (F = 9.4%), and in the selective sanitary felling plot, it is in the fourth place (F = 6.3%). The predator Cl. mutillarius is in first place in the clear felling, and selective sanitary felling plots (F – 25 and 15.63%, respectively), as well as in the stationary recreation zone (F = 9.4%). In the protected and regulated recreation zones, its frequency of occurrence is only 3.1%. The predator Th. formicarius is in the second place in the clear felling sample plot (F = 12.5%), and in the fifth place in the protected zone (F = 21.9%).
Table 5.
Predatory beetle species in the top ten most frequently occurring (F) in window traps in groups of sample plots and zones of Gomilshanski lisy NNP
| Species | F | Species | F | Species | F | Species | F | Species | F |
|---|---|---|---|---|---|---|---|---|---|
| Protected zone | Clear felling | Selective sanitary felling | Zone of stationary recreation | Zone of regulated recreation | |||||
| Sal. ruficollis | 40.6 | Cl. mutillarius | 25.0 | Cl. mutillarius | 15.6 | Cl. mutillarius | 9.4 | Sal. planirostris | 18.8 |
| Pl. compressum | 34.4 | Th. formicarius | 12.5 | Das. niger | 15.6 | P. parallelepipedus | 6.3 | N. elongatum | 9.4 |
| Sal. planirostris | 34.4 | Sal. ruficollis | 9.4 | Pl. compressum | 12.5 | P. flavicornis | 6.3 | Th. formicarius | 9.4 |
| P. parallelepipedus | 28.1 | P. parallelepipedus | 6.3 | Sal. planirostris | 6.3 | N. elongatum | 6.3 | P. parallelepipedus | 6.3 |
| Th. formicarius | 21.9 | P. flavicornis | 6.3 | P. parallelepipedus | 6.3 | N. caucasicum | 6.3 | Pl. compressum | 6.3 |
| V. ruficollis | 21.9 | Das. plumbeus | 6.3 | Das. plumbeus | 6.3 | Das. niger | 3.1 | V. ruficollis | 6.3 |
| Sep. bipustulatus | 15.6 | Pl. compressum | 3.1 | P. flavicornis | 6.3 | Pl. compressum | 3.1 | Sal. ruficollis | 6.3 |
| P. flavicornis | 12.5 | Sal. planirostris | 3.1 | V. ruficollis | 3.1 | V. ruficollis | 3.1 | E. mutator | 6.3 |
| E. karstenii | 9.4 | C. bicolor | 3.1 | Sal. ruficollis | 3.1 | C. bicolor | 3.1 | Cl. mutillarius | 3.1 |
| B. ultimus | 6.3 | Thor corticinus | 3.1 | E. mutator | 3.1 | Ten. fuscus | 3.1 | N. caucasicum | 3.1 |
By synthetic index Q, Cl. mutillarius takes first place in the sample plots of clear felling and selective sanitary felling and in the zone of stationary recreation (Q – 38.3, 14.6, and 10.5%, respectively). In the protected zone, Sal. ruficollis (Q = 23.4%) takes first place by Q (Tab. 6). The predator Sal. planirostris occupies second place in the protected zone (Q = 20.3%) and the first place in the zone of regulated recreation (Q = 18.8%) (see Tab. 6).
Table 6.
Predatory beetle species in the top ten by synthetic index Q for groups of sample plots and zones of Gomilshanski lisy NNP
| Species | Q | Species | Q | Species | Q | Species | Q | Species | Q |
|---|---|---|---|---|---|---|---|---|---|
| Protected zone | Clear felling | Selective sanitary felling | Zone of stationary recreation | Zone of regulated recreation | |||||
| Sal. ruficollis | 23.4 | Cl. mutillarius | 38.3 | Cl. mutillarius | 14.6 | Cl. mutillarius | 10.5 | Sal. planirostris | 18.8 |
| Sal. planirostris | 20.3 | Th. formicarius | 11.4 | Das. niger | 14.6 | P. parallelepipedus | 9.6 | N. elongatum | 9.4 |
| Pl. compressum | 19.0 | Sal. ruficollis | 7.0 | Pl. compressum | 11.9 | N. caucasicum | 9.6 | Th. formicarius | 9.4 |
| P. parallelepipedus | 18.3 | P. parallelepipedus | 5.7 | Das. plumbeus | 10.7 | N. elongatum | 9.6 | N. caucasicum | 7.0 |
| V. ruficollis | 14.6 | P. flaviciornis | 5.7 | P. parallelepipedus | 6.5 | P. flavicornis | 8.6 | P. parallelepipedus | 6.3 |
| P. flavicornis | 14.0 | Das. plumbeus | 4.6 | P. flavicornis | 6.5 | Ten. fuscus | 4.3 | Pl. compressum | 6.3 |
| Th. formicarius | 11.4 | Sal. planirostris | 2.3 | Sal. planirostris | 5.3 | Das. niger | 3.0 | V. ruficollis | 6.3 |
| Sep. bipustulatus | 8.4 | Pl. compressum | 2.3 | V. ruficollis | 3.8 | Pl. compressum | 3.0 | Sal. ruficollis | 6.3 |
| E. mutator | 4.8 | C. bicolor | 2.3 | Sal. ruficollis | 2.7 | V. ruficollis | 3.0 | E. mutator | 6.3 |
| E. karstenii | 4.6 | Thor, corticinus | 2.3 | Sep. bipustulatus | 2.7 | C. bicolor | 3.0 | Cl. mutillarius | 3.1 |
According to the Sörensen-Chekanovsky index, the closest similarity exists between the predator complexes of the selective sanitary felling plot and regulated recreation zone (10 common species), the selective sanitary felling plot and the protected zone (12 common species), the regulated recreation zone and protected zone (11 common species) (Tab. 7).
Table 7.
Similarity indices of predator complexes in groups of sample plots and zones in Gomilshanski lisy NNP
| Zone A | Zone B | Common species | Csc |
|---|---|---|---|
| Clear fell. | Sel. fell. | 7 (Sal. planirostris, Sal. ruficollis, P. flavicornis, P. parallelepipedus, Pl. compressum, Cl. mutillarius, Das. plumbeus) | 0.47 |
| Clear fell. | Stat. recr. | 5 (P. flavicornis, P. parallelepipedus, Pl. compressum, Cl. mutillarius, C. bicolor) | 0.36 |
| Clear fell. | Reg. recr. | 8 (Sal. planirostris, Sal. ruficollis, Th. formicarius, P. parallelepipedus, Pl. compressum, Cl. mutillarius, Das. plumbeus, L. lepidopterus) | 0.59 |
| Clear fell. | Prot. | 9 (Sal. planirostris, Sal. ruficollis, Th. formicarius, P. flavicornis, P. parallele-pipedus, Pl. compressum, Cl. mutillarius, Das. plumbeus, C. bicolor) | 0.53 |
| Sel. fell. | Stat. recr. | 6 (P. flavicornis, P. parallelepipedus, Pl. compressum, V. ruficollis, Cl. mutillarius, Das. niger) | 0.38 |
| Sel. fell. | Reg. recr. | 10 (Sal. planirostris, Sal. ruficollis, P. parallelepipedus, Pl. compressum, V. ruficollis, E. mutator, Cl. mutillarius, Das. niger, Das. plumbeus, Sep. bipustulatus) | 0.65 |
| Sel. fell. | Prot. | 12 (Sal. planirostris, Sal. ruficollis, P. flavicornis, P. parallelepipedus, Pl. compressum, V. ruficollis, E. mutator, Cl. mutillarius, Das. plumbeus, Sep. bipustulatus, E. duponti, Lor. lunulatus) | 0.63 |
| Stat. recr. | Reg. recr. | 7 (N. caucasicum, N. elongatum, P. parallelepipedus, Pl. compressum, V. ruficollis, Cl. mutillarius, Das. niger) | 0.48 |
| Stat. recr. | Prot. | 8 (N. caucasicum, P. flavicornis, P. parallelepipedus, Pl. compressum, V. ruficollis, Cl. mutillarius, Ten. fuscus, C. bicolor) | 0.44 |
| Reg. recr. | Prot. | 11 (Sal. planirostris, Sal. ruficollis, N. caucasicum, Th. formicarius, P. parallele-pipedus, Pl. compressum, V. ruficollis, E. mutator, Cl. mutillarius, Das. plumbeus, Sep. bipustulatus) | 0.63 |
The high number of common predatory beetle species was found for the selective sanitary felling sample plot, regulated recreation zone, and protected zone (Csc ≥ 0.6). A low number of common predatory beetle species was found for the stationary recreation zone with clear felling and selective sanitary felling sample plots (Csc – 0.36 and 0.38, respectively). A moderate number of common predatory beetle species (0.4 ≤ Csc ≤ 0.59) was found for most other pairs of plots and zones (see Tab. 7).
Cluster analysis by frequency of predatory beetle occurrence (F) confirmed the greatest dissimilarity between the sample plot of clear felling and the rest of the sample plots and zones (Fig. 7a), while cluster analysis by the synthetic index (Q) confirmed the greatest dissimilarity between the protected zone and the rest of the sample plots and zones (Fig. 7b)
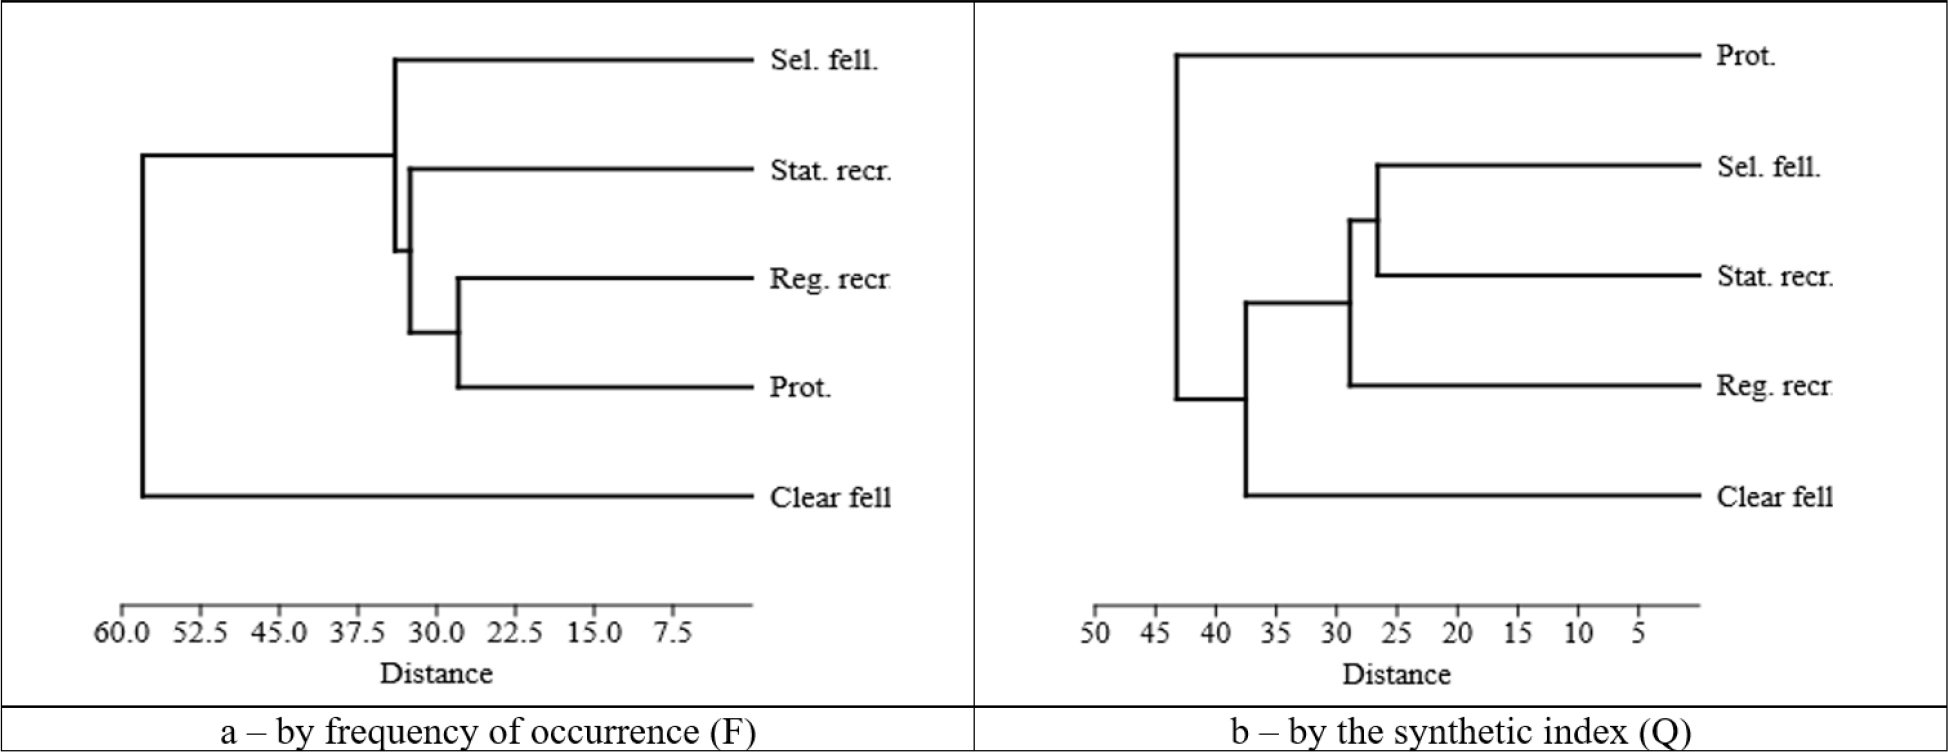
Figure 7.
Cluster analysis of predatory beetle complexes in sample plots and zones of the Gomilshanski lisy NNP (Clear fell. – clear felling in the managed zone Sel. fell. - selective sanitary felling in the managed zone; Stat. recr. – zone of stationary recreation; Reg. recr. – zone of regulated recreation; Prot. – protected zone)
Discussion
We initiated a study in the zones of Gomilshanski lisy NNP with different management regimes and recreation to evaluate the impacts of anthropogenic load on xylophagous beetles. It was found that the number of xylophagous beetles was the highest in plots with forest management activity (clear and selective sanitary felling), lower in the recreation zones, and the lowest in the protected zone. Logging residues attracted xylophages in the sample plots of forest management activity (felling), and severely weakened trees attracted xylophages in the plots of felling and recreation. Xyleborinus saxesenii (Ratzeburg, 1837) (66%–85% individuals) and Anisandrus dispar (Fabricius, 1792) (8.5%–20.7% individuals) (Curculionidae: Scolytinae) dominated in all groups of sample plots (Meshkova et. al. 2022). Both species are polyphagous; however, A. dispar prefers thin branches and X. saxesenii the stem part of the tree (Skrylnik et al. 2019; Holuša et al. 2021). Besides xylophages, window traps also attracted pantophages, mycetophages, saproxylophages, and predators. The largest number of xylophagous and xylomycetophagous species was found in the plots of clear felling, and the largest number of predators, saproxylophagous, and myxomycetophagous insects was found in the protected zone (Bieliavtsev 2023). Therefore, this paper is devoted to predators.
We trapped 36 species of predatory beetles from sample plots in the Gomilshanski lisy NNP, 20 of which belong to two families – Staphylinidae and Histeridae. The Staphylinidae species captured were primarily generalist predators, while Histeridae included facultative predators (Belyavtsev 2021). The most well-known bark beetle predators belong to the family Cleridae, among which Th. formicarius is widely used in biocontrol (Warzée et al. 2006; Korolyova et al. 2024; Meshkova et al. 2025; Papek et al. 2025).
The highest number of predatory beetle species and specimens was recorded in the protected zone, and the lowest number of species was in the clear felling sampling plot. The Shannon Index was the lowest in the sample plot of clear felling (Fig. 3, Tab. 3).
In southern Sweden, the highest numbers of saproxylic beetles were trapped in reserves and 65–85-year-old managed forests with larger volumes of deadwood, while the lowest numbers were trapped in young managed forests (Bergman et al. 2025). Clear felling practices result in even-aged stands, where deadwood quickly decays and disappears, leading to a bottleneck in availability before increasing in older forests (Jonsson et al. 2016).
A dominance assessment showed that Cl. mutillarius was eudominant only in the sample plot of clear felling (see Tab. 4), and its dominance decreased from the plot of selective sanitary felling (dominant) to the zone of stationary recreation, the zone of regulated recreation (recedent), and the protected zone (sub-recedent). This confirms the association of this insect with the prey, whose numbers increase with increasing deadwood.
However, Th. formicarius was more frequent in the protected zone than in the sample plot of the clear felling (see Tab. 4), maybe due to feeding by various insect stages (Özcan and Koçoğlu 2018), which were widespread in the protected zone (Bieliavtsev 2021).
Eudominant predator was represented by only one species (Cl. mutillarius) in the sample plot of clear felling, while dominant, subdominant, and recedent predators were present in varying proportions across all sample plots and zones (see Tab. 4).
Subrecedent predators were present only in the protected zone. As noted previously (Meshkova et al. 2022), among xylophages, rare and single species were present in all sample plots and zones. Across all sample plots, the proportion of abundant and common species was the lowest, while the proportion of rare and single species was the highest. Rare species were almost half of all species in the sample plot of clear felling and the zone of stationary recreation. The single species dominated in all other sample plots and zones. The generalism of predators explains the difference in the dominance of xylophages and predators in the sample plots.
Calculations show that the predatory beetle complex in the selective sanitary felling sample plot, regulated recreation zone, and the protected zone had the greatest dissimilarity (Csc ≥ 0.6). (see Tab. 7). Compared to predators, xylophagous insects (Meshkova et al. 2022) had the highest dissimilarity between the zones of clear felling and stationary recreation (Csc = 0.72), high dissimilarity (Csc ≥ 0.6) between the protected zone, on the one hand, and clear felling sample plot, selective sanitary felling sample plot, and regulated recreation, on the other hand.
The highest species diversity of xylophagous insects in the sample plots of clear and selective sanitary felling can be explained by their attraction to logging residues and severely weakened trees (Foit 2015).
The ambiguous relationship between predator distribution across sample plots and zones of the Gomilshanski lisy NNP is confirmed by differences in the results of cluster analysis conducted using the frequency of predatory beetle occurrence (F) and the synthetic index (Q) (Fig. 7). In the first case, the sample plot of clear felling is distinguished, and in the second case, the protected zone is distinguished from the rest of the sample plots and zones.
It should be noted that the species composition of individual trophic groups depends on trap type. All our surveys were conducted using identical window traps (flight interception traps). However, in forest ecosystems, there are also predator species that are not captured by window traps, but whose adults and/or larvae can prey on xylophages in living and dead trees by running into galleries. These species could be captured in pitfall traps or sticky traps (Vogel et al. 2021). Research has shown that for assessing overall community diversity, flight interception traps capture more saproxylic species than emergence traps and sticky traps (Köhler et al. 2022).
Conclusions
A total of 36 species of predatory beetles from 24 genera and 10 families were caught using window traps in Gomilshanski lisy NPP. Staphylinidae, Histeridae, and Cleridae were the most prevalent. Species richness was the highest (21 species, or 58.3%) in the protected zone and the lowest (13 species, or 36.1%) in the clear felling plot. In the pooled sample of predatory beetles, Cl. mutillarius and P. flavicornis were dominant. The lowest diversity of predatory beetles was recorded in the sample plot of clear felling (H = 1.61). P. parallelepipedus, Pl. compressum, and Cl. mutillarius were found in all sample plots. The first two species had the highest occurrence in the protected zone. Cl. mutillarius (Cleridae) was an eudominant only in the clear felling plot. Its dominance decreased in order from the clear felling to the selective sanitary felling sample plots, both zones of recreation, and the protected zone. Th. formicarius (Histeridae) was dominant only in the plot of clear felling, subdominant in the zone of regulated recreation and the protected zone, and was not trapped in the zones of selective sanitary felling and stationary recreation.
By synthetic index Q, Cl. mutillarius takes first place in the sample plots of clear felling and selective sanitary felling and in the zone of stationary recreation (Q – 38.3, 14.6, and 10.5%, respectively). In the protected zone, Sal. ruficollis (Q = 23.4%) takes first place by Q. Sal. planirostris occupies second place in the protected zone (Q = 20.3%) and the first place in the zone of regulated recreation (Q = 18.8%).
A high number of common predatory beetle species was found in the selective sanitary felling plot, regulated recreation zone, and protected zone (Csc ≥ 0.6). A low number of common predatory beetle species was found in the stationary recreation zone, compared to the sample plots of clear felling and selective sanitary felling (Csc – 0.36 and 0.38, respectively). A moderate number of common predatory beetle species (0.4 ≤ Csc ≤ 0.59) was found for most other pairs of plots and zones.
Cluster analysis by frequency of predatory beetle occurrence (F) confirmed the greatest dissimilarity between the sample plot of clear felling and the rest of the sample plots and zones, and cluster analysis by the synthetic index (Q) confirmed the greatest dissimilarity between the protected zone and the rest of the sample plots and zones.
Acknowledgement
The authors are grateful to Dr. Sergii Glotov (Lviv) for his valuable help with the search for the guides and the identification of Staphylinidae.