In our modern society where the standard of living is getting higher and higher, the need for energy is constantly increasing. Currently, six types of energy are used in parallel (fossil fuels, hydro, solar, wind, nuclear, and biofuels), the prototype stage being the geothermal and combustion of hydrogen obtained by electrolysis. Although in the last 100 years massive investments have been made in finding alternative renewable sources to fossil fuels, today the global energy system is still dominated by fossil fuels, and renewable sources represent only 7% of the total global energy production (Gheorghe et al. 2023).
With the exception of fossil fuels and radio-nuclides, which represent non-renewable sources of energy, the rest are renewable sources. Rapid industrial progress has caused a sudden increase in energy consumption at the global level. This phenomenon is especially visible in developing countries. The most important sources of energy production were based on fossil fuels (mostly oil and gas but coal also – exhaustible energy resources), which caused consequences in the form of excess emission of greenhouse gasses (Ziemiński et al. 2012).
Any organic materials that are living or that have been dead for a short period derived from plants or animals are classified as biomass. In plants, biomass is formed through the conversion of carbon dioxide in the atmosphere into carbohydrates in the presence of the sun’s energy (Basu 2018). Bioenergy derived from biomass is a renewable source of energy that can be utilized as an alternative to non-renewable sources of energy like coal for energy generation (and electricity production). However, biomass as provided by nature has less energy density and more moisture and volatiles when compared with that provided by coal (Wen et al. 2014). Biofuel is a fuel that is produced by contemporary biomass processes rather than by the very slow geological processes involved in the formation of fossil fuels, such as oil. Biofuel can be produced from plants (i.e., energy crops) or by agricultural, commercial, domestic, and/or industrial wastes (if the waste has a biological origin). Biofuel generally involves contemporary carbon fixation, such as those that occur in plants or microalgae through the process of photosynthesis (Karatzos et al. 2014).
The most important biofuels are bioethanol, biodiesel, herbaceous biomass, wood, and methane (gas obtained by anaerobic fermentation of plant residues). These biofuels have biomass as a precursor. Hydrothermal liquefaction (HTL) is a thermo-chemical process that converts wet biomass or organic waste into a liquid bio-oil under high temperature and pressure conditions in the presence of water (Halil 2023). Biomass is one of the most promising alternative energy sources because similar to that of carbon neutrality and availability from multiple sources (Mamvura et al. 2020). Biomass is an inexhaustible source of energy that regenerates at a rapid rate compared to the regeneration rate of other inexhaustible resources. It is produced naturally without the need for infrastructure and equipment; through the process of photosynthesis, it fixes, stores, and recycles the CO2 from combustions. Hence, biomass is the most cost-effective source of energy for the future having zero risk compared to nuclear energy and most low ecological footprint (Gheorghe et al. 2023).
The production of energy from wood biomass is becoming increasingly important in civilized countries that have important forestry resources. However, there is considerable confusion about the various measurement units used in the forestry sector. The forest owner usually estimates and sells its production in units of mass (tons, biomass) for the wood removed, while a harvester records its production in volume units (volume in solid cubic meters – over bark). Once the wood fibers are chipped, the volume of chips is expressed in cubic meters (loose volume). What is most important is the amount of energy that is contained in those chips. This depends mostly on the moisture content (Pieter 2010). As for wood sawdust, the carbon content is almost half of the biomass, for example, spruce wood sawdust, which has a carbon content of 46.55% by weight (Nurgül et al. 2023).
The rate of carbon accumulation through the process of photosynthesis and its storage capacity are dependent on the percentage of the area covered by vegetation and the type of vegetation. The most effective areas are those with complex plant communities, which are the forest areas (Gheorghe et al. 2007). Forest vegetation is an important source of energy through biomass production and a key factor in the maintenance of global carbon cycle balance under the current climate change conditions. Forest ecosystems are buffers against both extreme climatic events accompanying climate change and carbon sinks diminishing the environmental impact of anthropogenic greenhouse gas emissions (Gheorghe et al. 2010). In an ecosystem, the evolution of the structure of the primary producers, respectively of the vegetation, tends toward an optimal complexity that utilizes the radiant solar energy with a maximum yield (Botnariuc 1982). In the temperate continental climatic region, the type of vegetation with the most complex structure and high carbon fixation and storage capacity is the forest (Gheorghe 2008). For this reason, the current study is focused on forest ecosystems, respectively the amount of wood produced by them. In forest ecosystems, wood represents almost 85% of biomass production (Gheorghe et al. 2010).
The present study analyzes the energy and carbon storage capacity for the representative types of forest ecosystems present on the territory of Romania, a European country present in a temperate continental climate. The study tests the hypothesis according to which forest ecosystems with high-energy potential have a high carbon storage capacity. The most significant contribution to stand carbon storage capacity (in terms of both quantity and storage time) is that of the stems since the carbon stock represents approximately half of the biomass accumulated by a forest stand (Nair et al. 2009)
A total of 90 forest ecosystems spread along an altitudinal gradient from the lower Danube floodplain (15 m asl.) to the Carpathian Mountains, Romania (2100 m asl.), were selected. These ecosystems were grouped into three categories: pure natural forests, mixed natural forests, and planted forests. In each ecosystem, five circular sample areas were established. In these areas, measurements were made and samples were taken to estimate a series of parameters. Structural parameters were provided also for all the stands by “Marin Drăcea” National Institute for Research and Development in Forestry (INCDS) (planning studies between 1999 and 2017). Those parameters were tree species composition, average age, total timber volume (m3/ha), and annual productivity (m3/ha/year). The data were selectively validated by traveling in the field where for each type of ecosystem; a sample of 5 circular test areas was analyzed, each with an area of 500 m2. In each sample area, trees were inventoried, the diameters and the heights were measured at 1.3 m (HDB), and growing carrots were sampled with the Pressler increment borer. Timber volume was estimated based on published dendrological tables (Giurgiu 1972). Wood density was obtained from Filipovici (1964). Timber volume was used together with wood density (Filipovici 1964) to estimate woody biomass. Tree species with abundances higher than 10% were considered dominant per stand and considered separately for all analyses. Species with abundances lower than 10% were grouped according to the wood density and considered together as soft wood (wood density between 0.25 and 0.40 g/cm3) or hardwood (wood density between 0.80 and 0.98 g/cm3) in subsequent analyses. Stem productivity was estimated according to Whittaker and Woodwell (1968) as volume accumulated per area and time unit. Briefly, five circular plots of 500 m2 were randomly selected for each stand. For each plot and dominant species, five representative trees were selected. Two stem cores per tree were harvested at 1.3 m height on perpendicular directions with a Pressler increment borer and used for productivity, growth, and age determination. The age of tree samples was calculated by counting the growth rings and used subsequently in a diameter vs. age regression to estimate the age of other trees from the same species. Basal increase area was calculated according to the following equation:
where:
r – tree radius at 1.3 m height and i is the mean across five years of the annual radial increment.
Annual stem productivity Pi was calculated using the equation:
ρ – the specific density of the wood and h is the tree height (Whittaker and Woodwell 1968).
Site stem productivity PW was calculated using the equation:
BA – the average basal area/m2 for the given site,
BC – the total basal area of the sample trees.
For each species, the standing biomass (kg/ha) and the biomass productivity (kg/ha/year) were calculated using the equation:
M – the wood biomass,
ρ – the wood density, and V is the volume.
For mixed forests, the proportion of wood represented by each species was taken into account.
For each woody species present in the forest ecosystems, the calorific capacity of the wood was determined by calorimetric methods using the Bomb Calorimeter (Model-IKA C2000).
The calorific capacity of the wood was tested when the wood had a water content of 30%, 15%, and 0%. Three wooden cubes with a side of 10 cm were made for each woody species; they were moistened and dried one for each until humidity of 30% (the average humidity content of wood cut from the forest), 15% (the humidity of the working wood), and 0%.
Dry woody biomass (0% humidity) thus estimated was used to calculate woody carbon stocks.
The representative trees group’s carbon stock was calculated using CO2FIX31EXE based on woody biomass carbon stocks. The carbon content was measured with a EA 1110 CHNS-O, CE Instruments, Italian producer.
The highest volume of wood per ha was recorded in the 95-year-old spruce forest, the age at which the production cycle closes, and it is the optimal time for exploitation (555.09 m3/ha). This is followed by the 110-year-old mixed forest in which fir represents 70% of the composition (550.32 m3/ha) and the 35-year-old poplar plantation (407.19 m3/ha), and both the forests are at the optimal age for exploitation. The radial growth of trees in volume was 36.7 m3/ha/year in the 110-year-old mixed forest in which beech represents 50% of the composition, followed by the 95-year-old spruce forest (30.2 m3/ha/year) and the 15-year-old willow planted forest (18.3 m3/ha/year). From the point of view of standing crop biomass, the most valuable are pure forests 130-year-old (355 t/ha) or mixed beech forests where beech dominates 110-year-old (300.8 t/ha); in the case of planted forest, the 35-year-old poplar plantation was the most productive (199.5 t/ha). The highest productivity was in the 10-year-old poplar planted forest (7.14 t/ha/year), followed by the 110-year-old sessile oak forest (2.35 t/ha/year) and 110-year-old mixed beech forests, 50% beech in composition. The volume of wood per ha and the annual rate of wood production depend on the species of trees present in the composition and the age of the respective tree (Tab. 1).
Trees composition, age, stand crop woody volume, volume annual wood productivity, stand crop biomass, and annual increase of biomass (data provided by “Marin Drăcea” National Institute for Research and Development in Forestry (INCDS) – planning studies between 1999 and 2017)
| No. | Type of forest | Tree composition | Average age (years) | Volume/ha (m3/ha) | Productivity (m3/ha/year) | Biomass (t/ha) | Increase of biomass (t/ha/year) |
|---|---|---|---|---|---|---|---|
| 1 | 2 | 3 | 4 | 5 | 6 | 7 | 8 |
| Natural pure forests | |||||||
| 1 | Spruce forest | 10Mo | 100 ± 15 | 208.75 | 11.08 | 90.13 | 4.78 |
| 2 | Spruce forest | 10Mo | 95 ± 25 | 555.09 | 30.18 | 239.96 | 13.05 |
| 3 | Spruce forest | 10Mo | 25 ± 5 | 92.48 | 10.37 | 42.17 | 4.73 |
| 4 | Spruce forest | 10Mo | 100 ± 15 | 463.26 | 14.95 | 196.07 | 6.33 |
| 5 | Pine forest | 10Pi | 85 ± 25 | 256.31 | 14.56 | 119.18 | 6.77 |
| 6 | Beech forest | 10Fg | 130 ± 25 | 171.30 | 13.89 | 129.63 | 10.51 |
| 7 | Beech forest | 10Fg | 105 ± 5 | 170.94 | 14.96 | 130.13 | 11.39 |
| 8 | Beech forest | 10Fg | 75 ± 35 | 179.98 | 19.04 | 139.31 | 14.74 |
| 9 | Beech forest | 10Fg | 150 ± 15 | 121.00 | 5.28 | 88.40 | 3.86 |
| 10 | Beech forest | 10Fg | 105 ± 25 | 215.02 | 11.04 | 158.24 | 8.12 |
| 11 | Beech forest | 10Fg | 140 ± 15 | 276.03 | 9.03 | 199.54 | 6.53 |
| 12 | Beech forest | 10Fg | 100 ± 25 | 201.91 | 10.31 | 148.55 | 7.59 |
| 13 | Beech forest | 10Fg | 150 ± 5 | 402.04 | 14.80 | 283.93 | 10.45 |
| 14 | Beech forest | 10Fg | 150 ± 15 | 389.72 | 15.89 | 249.76 | 10.18 |
| 15 | Beech forest | 10Fg | 130 ± 20 | 342.97 | 13.83 | 355.00 | 14.32 |
| 16 | Beech forest | 10Fg | 170 ± 5 | 495.98 | 11.16 | 102.00 | 2.30 |
| 17 | Beech forest | 10Fg | 180 ± 5 | 139.98 | 5.74 | 291.79 | 11.97 |
| 18 | Turkey oak forest | 10Ce | 50 ± 15 | 148.54 | 5.73 | 121.87 | 4.70 |
| 19 | Turkey oak forest | 10Ce | 50 ± 15 | 144.08 | 6.21 | 118.73 | 5.12 |
| 20 | Turkey oak forest | 10Ce | 55 ± 15 | 114.63 | 4.19 | 93.87 | 3.43 |
| 21 | Turkey oak forest | 10Ce | 60 ± 15 | 140.08 | 3.99 | 113.82 | 3.24 |
| 22 | Turkey oak forest | 10Ce | 80 ± 15 | 147.68 | 3.88 | 119.73 | 3.15 |
| 23 | Sessile oak forest | 10Go | 110 ± 15 | 196.82 | 15.87 | 291.79 | 23.53 |
| 24 | Oak forest | 10St | 45 ± 15 | 209.44 | 8.21 | 154.53 | 6.06 |
| 25 | Oak forest | 10St | 55 ± 15 | 209.99 | 8.36 | 155.03 | 6.17 |
| Natural mixed forests | |||||||
| 26 | Fir forest | 7Br, 2Fg, 1Mo | 130 ± 30 | 443.90 | 20.96 | 217.55 | 10.27 |
| 27 | Fir forest | 7Br, 2Fg, 1Mo | 110 ± 40 | 550.32 | 15.92 | 265.00 | 7.67 |
| 28 | Fir forest | 4Br, 3Fg, 3Mo | 120 ± 30 | 396.03 | 18.63 | 206.09 | 9.69 |
| 28 | Fir forest | 6Br, 2Fg, 2Mo | 110 ± 25 | 519.04 | 20.02 | 252.28 | 9.73 |
| 30 | Fir forest | 8Br, 2Fg | 110 ± 25 | 168.98 | 10.42 | 83.96 | 5.18 |
| 31 | Fir forest | 6Br, 1Fg, 3Mo | 130 ± 15 | 486.29 | 16.13 | 220.56 | 7.32 |
| 32 | Fir forest | 5Br, 3Fg, 2Mo | 170 ± 10 | 412.98 | 14.98 | 212.70 | 7.72 |
| 33 | Fir forest | 6Br, 4Fg | 130 ± 25 | 439.98 | 17.57 | 240.67 | 9.61 |
| 34 | Fir forest | 6Br, 2Fg, 2Mo | 140 ± 15 | 316.03 | 10.49 | 152.81 | 5.07 |
| 35 | Fir forest | 6Br, 2Fg, 2Mo | 130 ± 15 | 327.85 | 11.60 | 158.86 | 5.62 |
| 36 | Fir forest | 6Br, 4Fg | 160 ± 10 | 157.89 | 9.76 | 88.18 | 5.45 |
| 37 | Fir forest | 6Br, 4Fg | 170 ± 10 | 62.98 | 10.18 | 38.48 | 6.22 |
| 38 | Fir forest | 6Br, 2Fg, 2Mo | 140 ± 15 | 101.04 | 10.63 | 52.26 | 5.50 |
| 39 | Fir forest | 6Br, 2Fg, 2Mo | 140 ± 15 | 276.04 | 12.59 | 135.08 | 6.16 |
| 40 | Fir forest | 8Br, 2An | 150 ± 15 | 243.31 | 7.87 | 82.41 | 2.67 |
| 41 | Fir forest | 5Br, 2Fg, 3Mo | 130 ± 20 | 224.90 | 10.37 | 110.11 | 5.08 |
| 42 | Alpine mixed forest | 4Br, 4Fg, 2Mo | 150 ± 10 | 258.03 | 11.88 | 141.97 | 6.54 |
| 43 | Alpine mixed forest | 4Br, 4Fg, 2Mo | 150 ± 10 | 497.03 | 16.17 | 269.94 | 8.78 |
| 44 | Alpine mixed forest | 5Br, 5Fg, | 150 ± 10 | 306.06 | 10.95 | 175.94 | 6.29 |
| 45 | Beech forest | 6Fg, 3Br, 1Mo | 120 ± 15 | 86.40 | 10.08 | 56.34 | 6.57 |
| 46 | Beech forest | 6Fg, 4Br, | 170 ± 10 | 265.02 | 12.32 | 161.97 | 7.53 |
| 47 | Beech forest | 5Fg, 3Br, 2Mo | 110 ± 30 | 509.02 | 33.03 | 300.84 | 19.52 |
| 48 | Beech forest | 5Fg, 3Br, 2Mo | 110 ± 30 | 480.03 | 36.72 | 286.80 | 21.94 |
| 49 | Beech forest | 7Fg, 2Br, 1Mo | 150 ± 10 | 407.04 | 17.18 | 260.05 | 10.98 |
| 50 | Spruce forest | 5Mo, 3Br, 2Fg | 120 ± 15 | 208.75 | 11.08 | 102.88 | 5.46 |
| 51 | Spruce forest | 5Mo, 3Br, 2Fg | 120 ± 15 | 421.04 | 12.50 | 202.90 | 6.02 |
| 52 | Spruce forest | 5Mo, 3Br, 2Fg | 140 ± 15 | 523.02 | 15.54 | 252.05 | 7.49 |
| 53 | Spruce forest | 5Mo, 3Br, 2Fg | 150 ± 10 | 411.02 | 13.46 | 198.66 | 6.51 |
| 54 | Spruce forest | 6Mo, 2Br, 2Fg | 90 ± 10 | 414.26 | 8.64 | 197.92 | 4.13 |
| 55 | Spruce forest | 9Mo, 1Fg | 120 ± 5 | 475.04 | 6.42 | 211.36 | 2.86 |
| 56 | Spruce forest | 5Mo, 3Br, 2Fg | 130 ± 10 | 537.18 | 4.79 | 215.70 | 1.92 |
| 57 | Turkey oak forest | 7Ce, 2Gi, 1Fr | 45 ± 20 | 30.97 | 4.38 | 28.67 | 4.05 |
| 58 | Turkey oak forest | 6Ce, 4Gi | 30 ± 25 | 129.18 | 4.98 | 114.04 | 4.40 |
| 59 | Turkey oak forest | 6Ce, 3St, 1Ca | 120 ± 5 | 247.35 | 2.87 | 189.42 | 2.20 |
| 60 | Turkey oak forest | 6Ce, 3St, 1Gi | 65 ± 15 | 221.77 | 5.72 | 177.67 | 4.58 |
| 61 | Oak forest | 7St, 3Fr | 60 ± 15 | 91.96 | 6.71 | 69.76 | 5.09 |
| 62 | Oak forest | 6St, 4Ce | 50 ± 15 | 124.12 | 7.62 | 97.75 | 6.00 |
| 63 | Oak forest | 6St, 4Fr | 45 ± 20 | 166.09 | 7.49 | 122.55 | 5.53 |
| 64 | Willow forest | 6Sa, 4Fr | 20 ± 15 | 72.49 | 9.36 | 47.96 | 6.19 |
| 66 | Poplar forest | 7Pl, 3Fr | 35 ± 10 | 294.02 | 8.19 | 169.24 | 4.71 |
| 66 | Ash forest | 8Fr, 2Pl | 30 ± 10 | 144.85 | 7.69 | 100.68 | 5.34 |
| Planted forests | |||||||
| 67 | Acacia planted forest | 10Sc | 5 | 10.48 | 5.62 | 9.82 | 5.27 |
| 68 | Acacia planted forest | 10Sc | 5 | 7.96 | 7.01 | 9.13 | 8.04 |
| 69 | Acacia planted forest | 10Sc | 10 | 32.02 | 5.81 | 23.08 | 4.19 |
| 70 | Acacia planted forest | 10Sc | 5 | 17.02 | 6.39 | 14.28 | 5.36 |
| 71 | Acacia planted forest | 10Sc | 7 | 19.01 | 8.20 | 16.60 | 7.16 |
| 72 | Acacia planted forest | 10Sc | 30 | 66.03 | 1.98 | 41.49 | 1.24 |
| 73 | Poplar planted forest | 10Pl | 35 | 326.16 | 6.97 | 159.82 | 3.49 |
| 74 | Poplar planted forest | 10Pl | 30 | 300.28 | 11.99 | 147.14 | 6.11 |
| 75 | Poplar planted forest | 10Pl | 15 | 99.34 | 14.22 | 48.68 | 7.97 |
| 76 | Poplar planted forest | 10Pl | 35 | 407.19 | 11.22 | 199.52 | 5.65 |
| 77 | Poplar planted forest | 10Pl | 25 | 76.35 | 15.26 | 37.41 | 8.97 |
| 78 | Poplar planted forest | 10Pl | 25 | 138.12 | 6.42 | 67.68 | 3.29 |
| 79 | Poplar planted forest | 10Pl | 10 | 78.15 | 16.04 | 38.29 | 71.41 |
| 80 | Poplar planted forest | 10Pl | 10 | 13.31 | 5.9 | 6.52 | 2.89 |
| 81 | Poplar planted forest | 10Pl | 5 | 5.49 | 6.32 | 2.69 | 3.10 |
| 82 | Ash planted forest | 10Fr | 90 | 269.02 | 2.97 | 190.39 | 2.10 |
| 83 | Willow planted forest | 10Sa | 15 | 148.69 | 18.31 | 85.17 | 10.49 |
| 84 | Willow planted forest | 10Sa | 5 | 7.29 | 3.98 | 3.72 | 2.03 |
| 85 | Spruce planted forest | 10Mo | 50 | 278.35 | 11.38 | 118.79 | 4.86 |
| 86 | Spruce planted forest | 10Mo | 30 | 174.97 | 9.85 | 75.78 | 4.27 |
| 87 | Spruce planted forest | 10Mo | 25 | 109.23 | 10.36 | 49.03 | 4.65 |
| 88 | Mixed planted, poplar and ash forest | 5Pla, 5Fr | 40 | 217.09 | 5.93 | 112.63 | 3.08 |
| 89 | Mixed planted, willow and poplar forest | 7Pln, 3Sa | 20 | 191.17 | 13.76 | 95.29 | 6.86 |
| 90 | Mixed planted, willow and poplar forest | 7Pln, 3Sa | 15 | 135.26 | 13.61 | 66.54 | 6.70 |
Legend: 1 = 10%, 2 = 20%, 3 = 30%, 4 = 40%, 5 = 50%, 6 = 60%, 7 = 70%, 8 = 80%, 9 = 90%, 10 = 100%; Mo = Spruce, Pi = Pine, Ce = Turkey oak, Fg = Beech, Go = Sessile oak, St = Oak, Br = Fir, Sa = Willow, Pl = Poplar, Gi = Hungarian oak, Fr = Ash, Sc = Acacia, Pln = Bleak Poplar, Pla = White Poplar, An = Alder, Ca = Hornbeam (Ex: 10 Mo = 100% Spruce; 7Br, 2Fg, 1Mo = 70% Fir, 20% Beech, 10% Spruce)
The standing crop expressed like wood volume varies a lot in forest ecosystems because the trees are of different ages, have different annual radial increases, and have different densities, and in some forests, a part of the wood volume has been extracted through exploitation.
The woody species whose radiant growth in volume units is the lowest have the highest density (see the species of the Quercus genus), and those with the highest radiation growth have the lowest wood densities (conifers and species of the genus Populus and Salix) (Tab.1, 2).
Tree wood density and wood caloric capacity at 0%, 15%, 30% humidity (data were obtained in the INCDS laboratories)
| No. | Species | Wood density (kg/m3) | Caloric capacity (Kcal/kg) 0% humidity | Caloric capacity (Kcal/kg) 15% humidity | Caloric capacity (Kcal/kg) 30% humidity | Caloric capacity (KWh/kg) 0% humidity | Caloric capacity (KWh/kg) 15% humidity | Caloric capacity (KWh/kg) 30% humidity |
|---|---|---|---|---|---|---|---|---|
| 1 | Acacia Robinia pseudoacacia | 610 | 4527 | 3575 | 3347 | 5.264 | 4.157 | 4.003 |
| 2 | Alder Alnus glutinosa | 530 | 4316 | 3392 | 3192 | 5.019 | 3.948 | 3.697 |
| 3 | Ash Fraxinus excelsior | 700 | 4255 | 3340 | 3201 | 4.948 | 3.884 | 3.529 |
| 4 | Beech Fagus sylvatica | 700 | 4494 | 3545 | 3000 | 5.226 | 4.122 | 3.488 |
| 5 | Bleak Poplar Populus nigra | 420 | 4123 | 3230 | 3128 | 4.786 | 3.780 | 3.489 |
| 6 | Fir Abies alba | 410 | 4654 | 3690 | 3520 | 5.412 | 4.291 | 3.997 |
| 7 | Hornbeam Carpinus betulus | 700 | 4062 | 3180 | 3014 | 4.723 | 3.698 | 3.416 |
| 8 | Hungarian oak Quercus frainetto | 940 | 4387 | 3452 | 3243 | 5.109 | 4.018 | 3.772 |
| 9 | Oak Quercus robur | 710 | 4390 | 3450 | 3240 | 5.105 | 4.012 | 3.767 |
| 10 | Pine Pinus sylvestris | 440 | 5066 | 4050 | 3660 | 5.891 | 4.709 | 4.256 |
| 11 | Hybrid Poplar Populus sp. hybrid | 490 | 4223 | 3231 | 3150 | 4.894 | 3.791 | 3.434 |
| 12 | Sessile oak Quercuspetraea | 710 | 4397 | 3439 | 3241 | 5.044 | 4.003 | 3.105 |
| 13 | Spruce Picea abies | 410 | 4696 | 3725 | 3400 | 5.460 | 4.331 | 3.953 |
| 14 | Turkey oak Quercus cerris | 790 | 4395 | 3448 | 3242 | 5.105 | 4.012 | 3.767 |
| 15 | White Poplar Populus alba | 500 | 4120 | 3225 | 3114 | 4.792 | 3.785 | 3.489 |
| 16 | Willow Salix sp. | 510 | 4264 | 3260 | 3112 | 4.958 | 3.756 | 3.559 |
This explains the fact that from the point of view of biomass, it is uniformly produced in different forest ecosystems in the same geographical region.
The production cycles, respectively, the optimal ages at which the forest can be exploited, are established mainly according to the volume of wood per ha. The age at which the volume of wood per ha is the highest is considered the optimal age for exploitation. Wood volume was chosen as a criterion because it is much easier to estimate in the field compared to biomass (wood weight). The productivity in volume units is influenced by the composition of the trees, their age, and the complexity of the plant composition in the respective forest. Although from the point of view of values of the volume of wood per ha, there are large discrepancies in the forest ecosystems; in the case of biomass, these are mitigated due to the fact that in composition of these ecosystems are different woody species that have different specific densities.
The productivity of wood in the forest reflects the maximum energy and carbon fixation capacity in the respective forest. Naturally, ecosystems modulate the structure of primary producers (green plants) so that they can maximize the fixation of incident radiant solar energy of the respective geographical area. The productivity values expressed as biomass per ha per year vary in a narrower range than standing crop biomass, reflecting the ability of forests to optimize the fixation of incident solar radiant energy. The caloric capacity varies depending on the humidity of the wood and its resin content (Tab. 2, Fig. 1). At a humidity of 30%, which represents the humidity of the wood when it is cut and extracted from the forest, for most tree species, the wood cannot be burned in an open source. The ideal humidity for work and for using wood as a fire source for heating homes is 15%. The highest calorific capacity of wood is at “0” humidity when all the energy accumulated through photosynthesis is released in the calorimetric bomb. In the case of wood with a humidity of 15% or 30%, a large part of the energy fixed by photosynthesis and released in the calorimetric bomb is consumed for the evaporation of water in the form of humidity (Fig. 1).
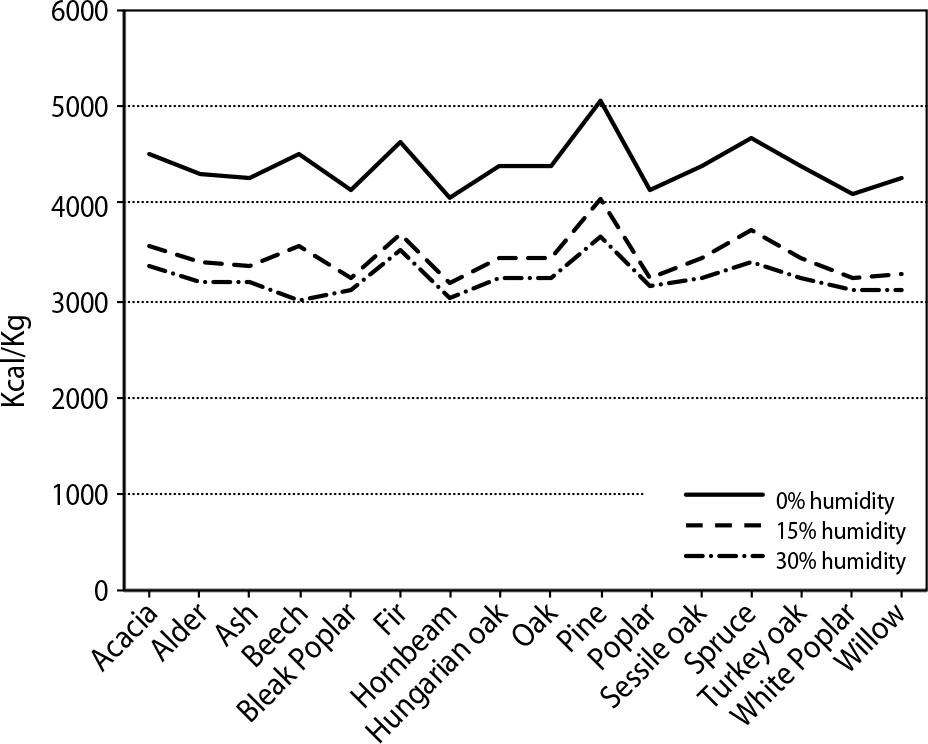
Species wood caloric capacity at 0%, 15%, 30% humidity
Conifers (pine, spruce, and fir) have the highest resin content, and therefore, they also have the highest caloric capacities (Tab. 2)
In natural forests, the energy stored in wood expressed in both Gcal/ha and MWh/ha has the same distribution as biomass per ha. In terms of energy, the most efficient are pure beech forests and those mixed with fir and spruce; the second position of the ranking is the spruce forest (Fig. 2, 3). This is since in pure and mixed beech forests, beech wood is produced in a large volume per ha (509.03 m3/ha), has a high density (0.7 g/cm3), and a high calorific value (5,226 KWh/kg). The most efficient planted forest, in terms of energy, is the poplar forest because the hybrid poplar used in the plantations produces a large volume of wood per ha (407.19 m3), has a higher wood density (0.49 g/cm3 compared to 0.42 g/cm3 of black poplar), and has a higher calorific value (4223 Kcal/kg compared to 4123 Kcal/kg of black poplar) (Fig. 4).
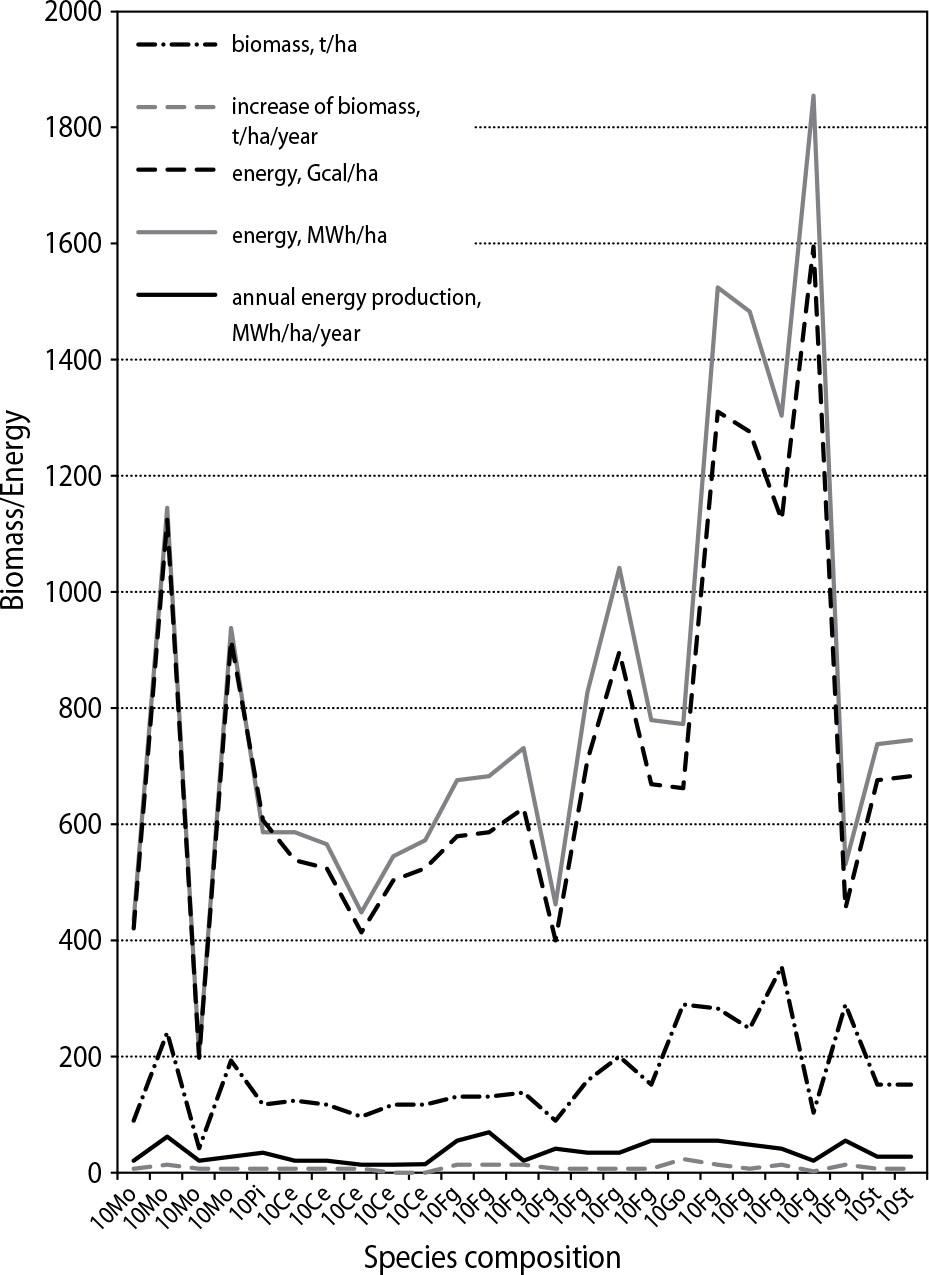
Biomass, annual increase of biomass, energy, and annual energy production of the pure natural forests

Biomass, annual increase of biomass, energy, and annual energy production of the mixed natural forests
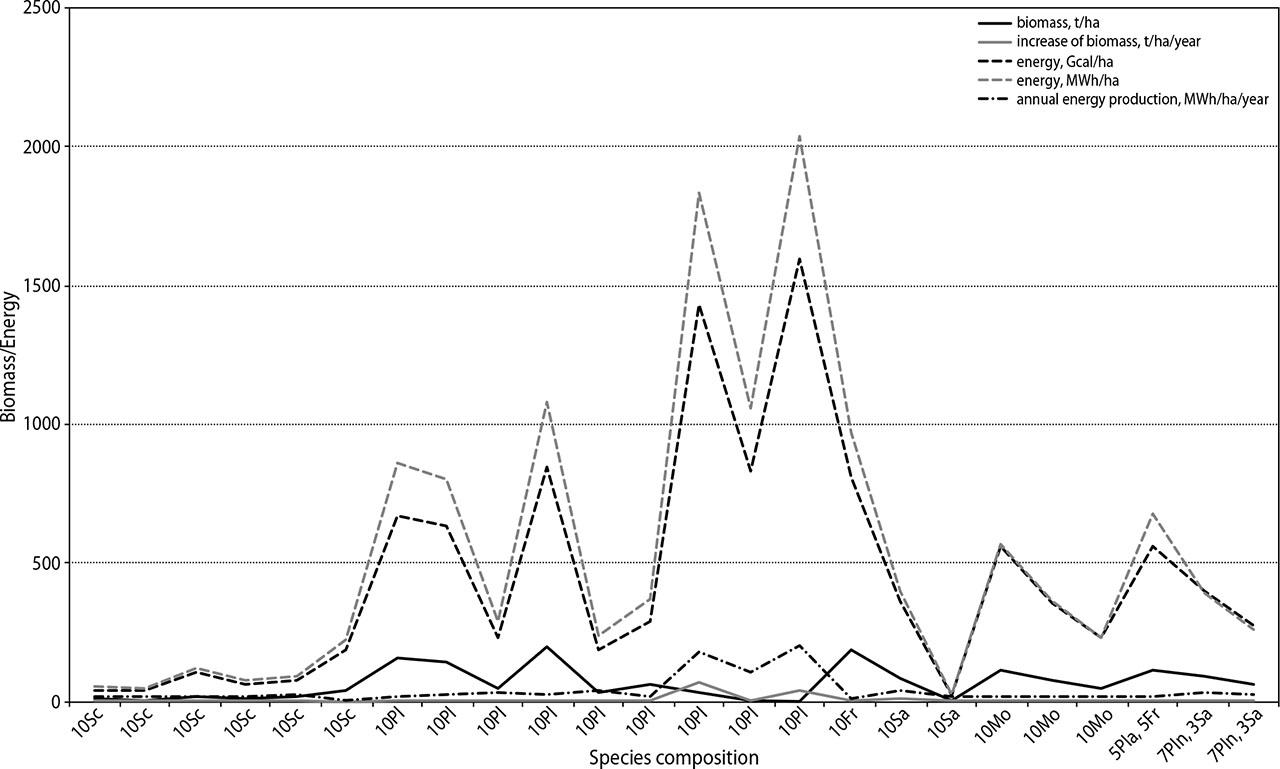
Biomass, annual increase of biomass, energy, and annual energy production of the planted forest
In all 90 forest types, the amount of energy present in the form of wood per ha has the same distribution as biomass; the most efficient forests in terms of energy were the most productive forests in terms of biomass.
The carbon content per gram of woody dry biomass varied between 0.498 mgC/g d.s. and 0.578 mgC/g d.s., the greatest content being in sessile oak and the lowest in willow.
Carbon stocks, in all the 90 types of forests, represent about half of the biomass, and forests with a higher amount of biomass per ha have a higher carbon storage capacity (Fig. 5).

Wood biomass, increase of wood biomass, carbon stock, and annual carbon stock in all the 90 types of forests
In the forest ecosystem, there is an interdependence between the wood production capacity and the carbon storage capacity, and the key parameter in explaining this interdependence is biomass.
We observe a correlation between wood quality and growth rates: species with high wood density typically have slow growth, while fast-growing species are frequently characterized by low wood density. While the first type of species can accumulate more carbon in the long term and has a higher energy capacity, fast-growing species allow rapid carbon fixation and faster cycle time, but the wood is of poor-energy quality.
The results of this study are the basis of the predictions, and the comparisons using stand carbon storage capacity and energetical capacity of this are valuable for forest management plans including those of aforestation and reforestation.
In Romania, there is a large number of forest types, each type having a certain internal structure imposed by the pedoclimatic conditions dictated by a relatively broad altitude gradient.
The structure of these types of forests is in close correlation with the way they function, and the result of the functions is biological production (biomass) and productivity (annual growth of biomass). The proportion of wood is very high (85%) in the biomass production of forest ecosystems, that is why the other components of the biomass were ignored. In a forest ecosystem, there is a direct correlation between the production of biomass as a standing crop and the ability to fix radiant solar energy; the more biomass the forest produces, the more energy efficient it is.
This close correlation is also observed in the case of carbon storage, approximately half of the biomass is the carbon content.
The values of the annual growth of biomass as productivity are not very different in the different types of forest because the internal structure of the forest is adapted to maximize the fixation of radiant solar energy.
Forest ecosystems that have a large amount of biomass distributed per surface unit have a high energy and carbon storage capacity, and therefore, there is a direct correlation between the energy efficiency of a forest and the carbon storage capacity.
The study demonstrated a direct correlation between the capacity to produce and store energy of the forest ecosystems and the capacity to fix and store the carbon through photosynthesis; the hypothesis is validated.
The use of biomass, especially wood, as a source of renewable energy, represents the most advantageous option because it is an inexhaustible source, it does not require equipment to be produced, and its production involves the reduction of greenhouse gases (CO2) incriminated in the climatic changes.