Have a personal or library account? Click to login
Early assessment of endocan level as a predictor of remission status in acute leukemia patients Cover

Early assessment of endocan level as a predictor of remission status in acute leukemia patients

Open Access
|Mar 2026

Figures & Tables

Table 1:

Patient characteristics and disease categorization of analyzed patients.

Total no. = 45
AgeMean ± SD31.38 ± 10.36
Range14–56
GenderFemale55.6% (n = 25)
Male44.4% (n = 20)
ComorbiditiesNegative68.9% (n = 31)
Positive31.1% (n = 14)
DiagnosisAML44.4% (n = 20)
ALL51.1% (n = 23)
FAB (AML)Mixed phenotypic4.4% (n = 2)
M125% (n = 5)
M220% (n = 4)
M320% (n = 4)
M420% (n = 4)
M515% (n = 3)
(ALL)B ALL47.8% (n = 11)
T ALL52.2% (n = 12)

[i] Data indicate the demographic characteristics of studied patients, including the mean and standard deviation (SD) of patients' age, numbers (n), and percentage (%) of each gender, as well as comorbidities and diagnoses.

Table 2:

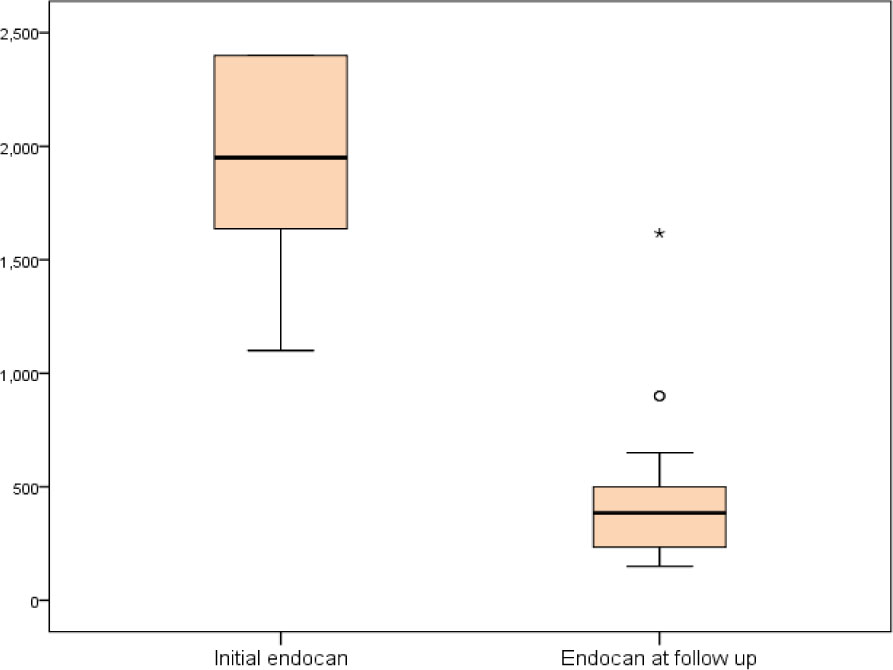
Comparison between initial endocan level and post-induction endocan.
InitialPost-inductionTest valueP-valueSig.
EndocanMedian (IQR)1950 (1637–2400)385 (234–500)−5.481≠0.000***HS***
Range1100–2400150–1617

Data reveal the median values of initial and post-induction endocan levels.

*** P-value < 0.01: highly significant (HS).

Fig. (a):

Comparison between initial endocan level and post-induction endocan level among the examined patients.

Table 3:

Comparison of endocan levels in responders and non-responder patients.

RespondersNon-responders
No. = 40No. = 5
Initial endocanMedian (IQR)1915 (1582–2377.5)2400 (2300–2400)−1.841≠0.066*NS
Range1100–24001885–2400
Post-induction endocanMedian (IQR)342 (231.5–500)496 (404–500)−1.300≠0.193*NS
Range150–1617302–615

Data reveal the median values of initial and post-induction endocan levels in responders and non-responder patients.

* P-value > 0.05: non-significant (NS).

Table 4:

Endocan levels in responders versus non-responders AML and ALL patients.

RespondersNon-responders
No. = 18No. = 2
Initial endocanMedian (IQR)1898 (1566–2356)2400 (2400–2400)1.9050.057**NS
Range1100–24002400–2400
Post-induction endocanMedian (IQR)388 (320–492)399 (302–496)0.1260.900*NS
Range202–900302–496
RespondersNon-responders
No. = 20No. = 3
Initial endocanMedian (IQR)2251 (1663.5–2400)2300 (1885–2400)0.5560.578*NS
Range1150–24001885–2400
Post-induction endocanMedian (IQR)246 (210–510.5)500 (404–615)1.2330.218*NS
Range150–1617404–615

Data reveal the median values of initial and post-induction endocan levels in responders and non-responder patients in AML and ALL patients.

** P-value near 0.05: nearly significant (N.S.);

* P-value > 0.05: non-significant (NS).

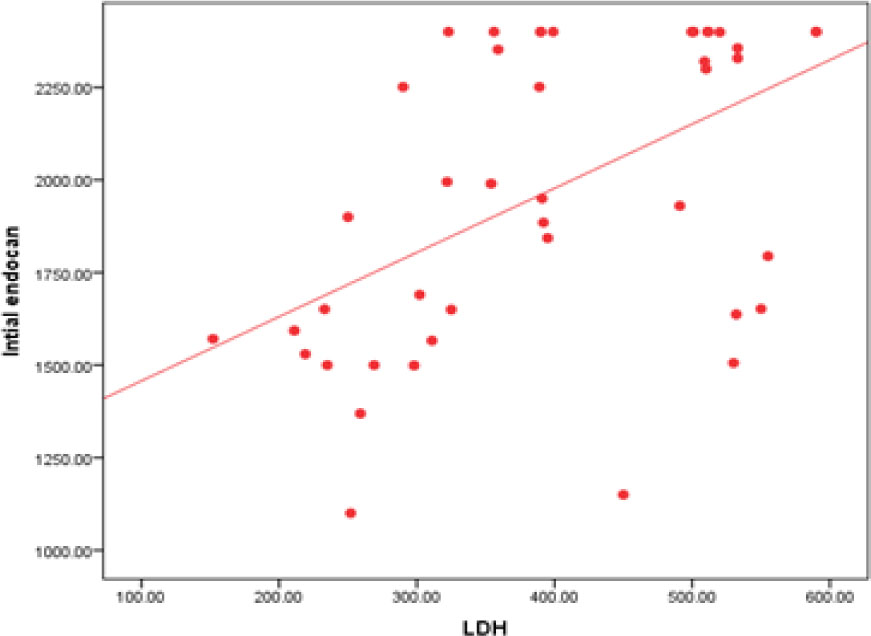
Fig. (b):

Correlation between initial endocan level and LDH level among the studied patients.
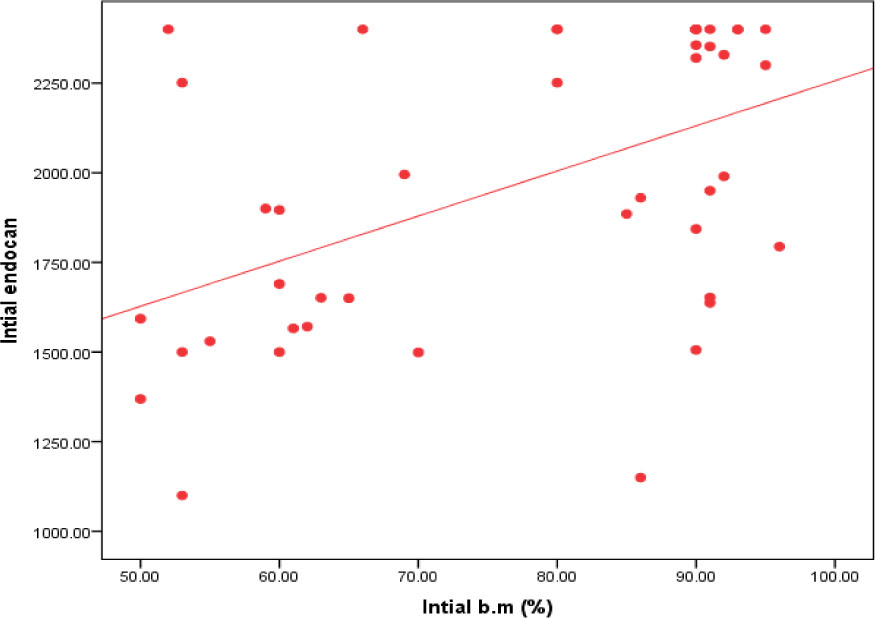
Fig. (c):

The correlation between initial endocan and initial bone marrow blasts percentage among the studied patients.

Table 5:

Outcome of the examined patients.

Total no. = 45
MortalityAlive86.7% (n = 39)
Died13.3% (n = 6)
OS (6 months)Mean ± SD3.87 ± 1.73
Range1–6
Remission statusResponders88.9% (n = 40)
Non-responders11.1% (n = 5)
PFS (6 months)Mean ± SD3.44 ± 1.73
Range1–6

[i] Data indicate the number and percentages (%) of deaths and responders and non-responder patients. Mean and standard deviation (SD) of overall survival (OS) and progression-free survival (PFS).

DOI: https://doi.org/10.2478/fco-2024-0019 | Journal eISSN: 1792-362X | Journal ISSN: 1792-345X
Language: English
Submitted on: Aug 2, 2025
Accepted on: Nov 4, 2025
Published on: Mar 24, 2026
Published by: Helenic Society of Medical Oncology
In partnership with: Paradigm Publishing Services

© 2026 Rasha Magdy M Said, Tamer M. Ahmed, Rana Z. Abbas, Heba S. Agamy, Raed A. Shamkh, Basma S. M. Ali, published by Helenic Society of Medical Oncology
This work is licensed under the Creative Commons Attribution-NonCommercial-NoDerivatives 4.0 License.