
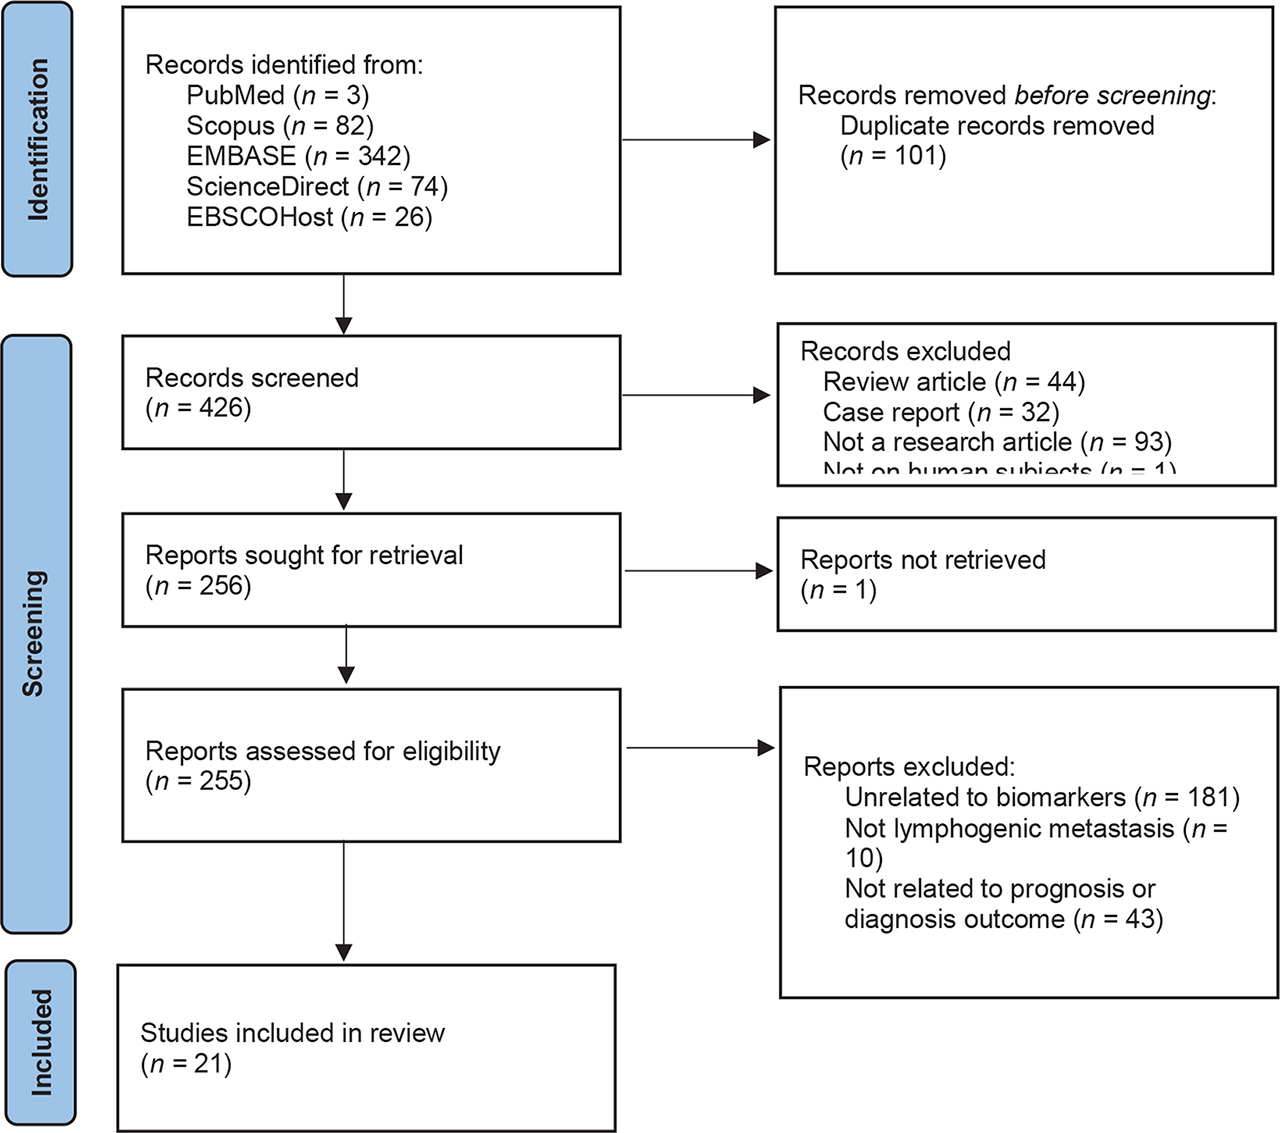
Figure 1:
PRISMA flow chart PRISMA, Preferred Reporting Items for Systematic Review and Meta-Analysis.
Table 1:
Summary of eligible studies.
| Author | Year | Location | Settings | Total samples | Type of patients |
|---|---|---|---|---|---|
| De Bacco et al.12 | 2020 | Porto Alegre, Brazil | Prospective cohort | 40 patients | Penile squamous cell carcinoma |
| Udager et al.13 | 2016 | Ann Arbor, USA | Retrospective observational study | 37 patients | Penile squamous cell carcinoma |
| Ottenhof et al.14 | 2018 | Amsterdam, the Netherlands | Retrospective observational study (immunohistochemistry analysis) | 487 patients | Penile squamous cell carcinoma |
| Hu et al.15 | 2020 | Changsha, China | Prospective cohort | 84 patients | Penile squamous cell carcinoma |
| Steffens et al.16 | 2013 | Hannover, Germany | Retrospective cohort study | 79 patients | Penile cancer |
| Al Ghazal et al.17 | 2013 | Ulm, Germany | Retrospective cohort study | 51 patients | Penile cancer patients underwent radical or partial penectomy (pT1–pT4) |
| Jindal et al.18 | 2021 | Bengal, India | Prospective observational study | 69 patients | Penile cancer; pT1 (15), pT2 (37), pT3 (16), pT4 (1) with inguinal node dissection |
| Protzel et al.19 | 2007 | Helios-Kliniken Schwerin, Germany | Retrospective observational study (immunohistochemistry analysis) | 28 patients | Invasive penile squamous cell carcinoma |
| Cocks et al.20 | 2017 | North America | Prospective cohort | 53 patients | Invasive penile squamous cell carcinoma tissue |
| Mo et al.21 | 2021 | Hunan, China | Retrospective observational study | 81 patients | Penile cancer patients underwent surgery |
| Mo et al.22 | 2020 | Hunan, China | Retrospective observational study | 76 patients | Penile cancer patients underwent surgery |
| Mo et al.23 | 2020 | Hunan, China | Retrospective observational study | 76 patients | Penile cancer patients underwent surgery |
| Murta et al.24 | 2022 | Sao Paulo, Brazil | Prospective observational study | 24 patients | Penile cancer diagnosed in hospital |
| Ayoubian et al.25 | 2021 | Homburg, Germany | Preclinical studies (microarray analysis) | 30 patients | Penile squamous cell carcinoma; pT1a, pT1b, pT2, pT3; metastatic; nonmetastatic |
| Mohr et al.26 | 2022 | Homburg, Germany | Preclinical studies (immunohistochemistry staining analysis) | Three patients | HPV-positive penile cancer cell lines (primarius derived, metastasis derived) |
| van der Fels et al.27 | 2020 | Groningen, the Netherlands | Pilot prospective observational study | 22 patients | Penile squamous cell carcinoma |
| Zhou et al.28 | 2018 | Guangzhou, China | Prospective observational study | 114 patients | Penile squamous cell carcinoma cell lines (Penl1, Penl2, and 149RCa) |
| Fenner et al.29 | 2018 | Rostock, Germany | Preclinical study (immunohistochemistry analysis) | Four patients | Penile cancer cell lines |
| Zhu et al.30 | 2013 | Shanghai, China | Retrospective observational study (immunohistochemistry analysis) | 73 patients | Penile squamous cell carcinoma |
| Minardi et al.31 | 2011 | Ancona, Italy | Retrospective observational study (immunohistochemistry analysis) | 39 patients | Penile squamous cell carcinoma |
| Protzel et al.32 | 2011 | Rostock, Germany | Retrospective observational study | 29 patients | Invasive penile squamous cell carcinoma patients underwent surgical resection |
Table 2:
Summary of markers used.
| Author | Year | PD-L1 | CRP | NLR and LMR | Ki-67 | Chemokine motif ligands | miRNAs | Other biomarkers |
|---|---|---|---|---|---|---|---|---|
| De Bacco et al.12 | 2020 | (+) | p16 | |||||
| Udager et al.13 | 2016 | (+) | ||||||
| Ottenhof et al.14 | 2018 | (+) | HLA | |||||
| Hu et al.15 | 2020 | (+) | (+) | |||||
| Steffens et al.16 | 2013 | (+) | ||||||
| Al Ghazal et al.17 | 2013 | (+) | ||||||
| Jindal et al.18 | 2021 | (+) | ||||||
| Protzel et al.19 | 2007 | (+) | ||||||
| Cocks et al.20 | 2017 | (+) | CD8 | |||||
| Mo et al.21 | 2021 | CXCL5 | ||||||
| Mo et al.22 | 2020 | CXCL13 | ||||||
| Mo et al.23 | 2020 | CCL20 | ||||||
| Murta et al.24 | 2022 | Differentially expressed miRNAs | DEGs | |||||
| Ayoubian et al.25 | 2021 | miR-137 and miR-328-3p | ||||||
| Mohr et al.26 | 2022 | S100A8 and S100A9; CD147 | ||||||
| van der Fels et al.27 | 2020 | PSMA, VEGF, EGFR, and EpCAM | ||||||
| Zhou et al.28 | 2018 | sLAMC2 | ||||||
| Fenner et al.29 | 2018 | EF21 | ||||||
| Zhu et al.30 | 2013 | CA IX | ||||||
| Minardi et al.31 | 2011 | D2-40 | ||||||
| Protzel et al.32 | 2011 | Annexins I, II, and IV |
[i] DEG, differentially expressed gene
Table 3:
Summary of the main findings on notable biomarkers as a prognostic factor.
| Author | Year | p-value | Marker used | Summary of findings |
|---|---|---|---|---|
| De Bacco et al.12 | 2020 | p = 0.002 | PD-L1, p16 | There was statistical correlation between PD-L1 and p16 expression (p = 0.002). There was a two-fold relationship in LN involvement of patients who expressed PD-L1 (69.2% of patients with LN involvement had PD-L1 expression and only 30.8% had LN involvement with PD-L1-). p16 was expressed in 38.5% of patients with LN involvement without significant difference |
| Udager et al.13 | 2016 | p = 0.024 | PD-L1 | Twenty-three (62.2%) of 37 primary tumors were positive for PD-L1 expression, and there was strong positive correlation of PD-L1 expression in primary and metastatic samples (p = 0.72; 0.032 < p < 0.036). Primary tumor PD-L1 expression was significantly associated with regional LNM (p = 0.024) |
| Ottenhof et al.14 | 2018 |
| Nonclassical HLA class I PD-L1 | Tumor PD-L1 expression was significantly associated with LNM; diffusely PD-L1–positive tumors had higher odds of LNM in comparison to tumors to marginal PD-L1 expression only (OR 4.16, p < 0.01) and tumors with combined negative/margin PD-L1 expression (OR 3.28, p < 0.01). Upregulation of nonclassical HLA class I molecules (combined score of HLA-E and HLA-G) was associated with a higher odds of LNM compared to normal expression (OR 2.28, p = 0.02). In the multivariable analysis, diffuse PD-L1 expression was the only immunological factor that remained significantly associated with LNM, although the lower limit of the confidence interval was just above 1 (OR 2.81, 95% CI [1.01–7.81], p < 0.05) |
| Hu et al.15 | 2020 |
|
| PD-L1 and NLR increased the predictive accuracy of the clinical model. PD-1 and NLR were considered independent predictors of LNM; NLR model risk analysis: OR = 10.93 (2.81–42.53, p-value <0.01); PD-L1 model risk analysis: OR = 5.16 (1.29–20.58, p-value 0.02) |
| Steffens et al.16 | 2013 | p = 0.007 | CRP | A significantly elevated CRP level (>15 vs. ≤15 mg/l) was found more often in patients with nodal disease at diagnosis (50.0 vs. 14.6%, p = 0.007) |
| Al Ghazal et al.17 | 2013 | p = 0.04 | CRP | The mean CRP value was significantly higher in patients with nodal disease than in those without it: 24.7 versus 12.4 mg/dl (p = 0.04) |
| Jindal et al.18 | 2021 | p = 0.001 | NLR, LMR | NLR >3 and LMR ≤3 were significantly associated with the presence of inguinal LN involvement (p = 0.001 and 0.026, respectively) |
| Protzel et al.19 | 2007 | p = 0.005 | Ki-67 | None of the patients with weak Ki-67 expression had LNM, whereas eight patients with moderate Ki-67 staining (47%) and all seven patients with a strong Ki-67 expression displayed LNMs (p = 0.005). The statistical analyses revealed that Ki-67 labeling index is related to distant metastasis (p = 0.026) |
| Cocks et al.20 | 2017 | p = 0.0057 | CD8, Ki-67 | CD8 and Ki-67 expression in stromal immune cells correlated with distant metastasis (p = 0.0057). Tumors with higher CD8 and Ki-67 expression in the stromal immune cells were more likely to metastasize |
| Mo et al.21 | 2021 | p = 0.018 | CXCL5 | Preoperative serum CXCL5 levels were significantly associated with pelvic LNM (p = 0.018). |
| Mo et al.22 | 2020 | p < 0.001 | CXCL13 | Higher preoperative serum CXCL13 level was detected in PC cohorts than in healthy male controls (p < 0.001) |
| Mo et al.23 | 2020 | p = 0.007 | CCL20 | Preoperative serum CCL20 level was significantly associated with pelvic LNM (p = 0.007) |
| Murta et al.24 | 2022 | n/a | DEmiRs and DEGs | Upregulation of miR-421 and miR-744-5p is associated with metastasis of LN in penile cancer patients (based on total cohort) |
| Ayoubian et al.25 | 2021 |
| miR-137 miR-328-3p | Lower fold value in miR-137 (−3.7 [p = 0.004] and −8.54 [p = 0.004]) and miR-328-3p (−2.7 [p = 0.007] and −1.98 [p = 0.032]) in metastatic cells with negative HPV, implying lower expression |
| Mohr et al.26 | 2022 | n/a | S100A8 and S100A9; CD147 | All metastasis cell lines were stained positive for S100A8 and S100A9 (100%). All HPV+ metastasis cell lines (LM) were also positive for CD147 marker |
| van der Fels et al.27 | 2020 | n/a | The monoclonal antibodies PSMA, VEGF, EGFR, and EpCAM expression | High immunoreactivity score of VEGF and EGFR expression in metastatic LN involvement and primary tumor; however, EGFR is not expressed in tumor without metastasis. PSMA and EpCAM ae not expressed in the tumor cell at all |
| Zhou et al.28 | 2018 | n/a | sLAMC2 | LAMC2 was overexpressed in PSCC tissues, and the LAMC2 expression level was higher in metastatic LN tissues than in primary cancer tissues |
| Fenner et al.29 | 2018 | p < 0.001 | EF21 |
|
| Zhu et al.30 | 2013 | p = 0.85 | CA IX | The probability of LNM was 38.1% and 45.2% in CA IX low- and high-expression categories, respectively. CA IX was associated with LNM with OR 1.149 (p = 0.85) despite not being significant |
| Minardi et al.31 | 2011 | p = 0.326 | D2-40 | All patients whose intratumoral cells were D2-40 negative were N0, whereas all N+ patients were positive, with 66.7% strongly so. All deceased patients had high-level cell D2-40 expression. N+ patients accounted for 16.7% and 35.7% of samples with moderate and strong D2-40 reactivity, respectively (p = 0.326, χ2 test) |
| Protzel et al.32 | 2011 |
|
| There was a significant correlation between strong ANX AI expression at the invasion front and the occurrence of LNM (p = 0.001). Analysis of ANX AII expression showed no significant correlation with clinical data. Strong expression of ANX AIV at the invasion front was significantly associated with LNM (p = 0.019) |
[i] CA IX, carbonic anhydrase IX; CI, confidence interval; CRP, C-reactive protein; DEG, differentially expressed gene; DEmiRs, differentially expressed miRNAs; EGFR, epidermal growth factor receptor; HLA, human leukocyte antigen; LMR, lymphocyte/monocyte ratio; LN, lymph node; LNM, lymph node metastasis; NLR, neutrophil/lymphocyte ratio; OR, odds ratio; PD-L1, programmed death ligand-1; PSMA, prostate-specific membrane antigen; VEGF, vascular endothelial growth factor
Table 4:
NOS risk of bias assessment.
| Author | Year | Selection | Comparability | Exposure | Total score | |||||
|---|---|---|---|---|---|---|---|---|---|---|
| Adequate definition of patient cases | Representativeness of patient cases | Selection of controls | Definition of controls | Control for important or additional factors | Ascertainment of exposure | Same method of ascertainment for participants | Nonresponse rate | |||
| Mohr | 2022 | * | * | * | * | * | 5 | |||
| Ayoubian | 2021 | * | * | * | * | * | * | 6 | ||
| Jindal | 2021 | * | * | * | * | * | * | 6 | ||
| Hu | 2020 | * | * | * | * | * | 4 | |||
| De Bacco | 2020 | * | * | * | * | * | 5 | |||
| van der Fels | 2020 | * | * | * | * | * | * | 6 | ||
| Zhou | 2018 | * | * | * | * | * | * | 6 | ||
| Cocks | 2017 | * | * | * | * | * | 5 | |||
| Udager | 2016 | * | * | * | * | * | * | 6 | ||
| Al Ghazal | 2013 | * | * | * | * | * | * | 6 | ||
| Steffens | 2013 | * | * | * | * | * | * | 6 | ||
| Murta | 2022 | * | * | * | * | * | 5 | |||
| Mo | 2021 | * | * | * | * | * | * | * | * | 8 |
| Mo | 2020 | * | * | * | * | * | * | * | * | 8 |
| Mo (2) | 2020 | * | * | * | * | * | * | * | * | 8 |
| Fenner | 2018 | * | * | * | * | 4 | ||||
| Ottenhof | 2018 | * | * | * | * | * | * | 6 | ||
| Zhu | 2013 | * | * | * | * | * | * | * | 7 | |
| Minardi | 2011 | * | * | * | * | * | * | * | 7 | |
| Protzel | 2011 | * | * | * | * | * | * | * | 7 | |
| Protzel | 2007 | * | * | * | * | * | * | * | 7 | |
[i] NOS, Newcastle–Ottawa scale
[ii] Green rows signify good-quality studies, yellow rows signify fair quality studies