
Table 1
Learning outcome mean score of students’ self-assessment and teachers’ student-assessment before and after meeting †
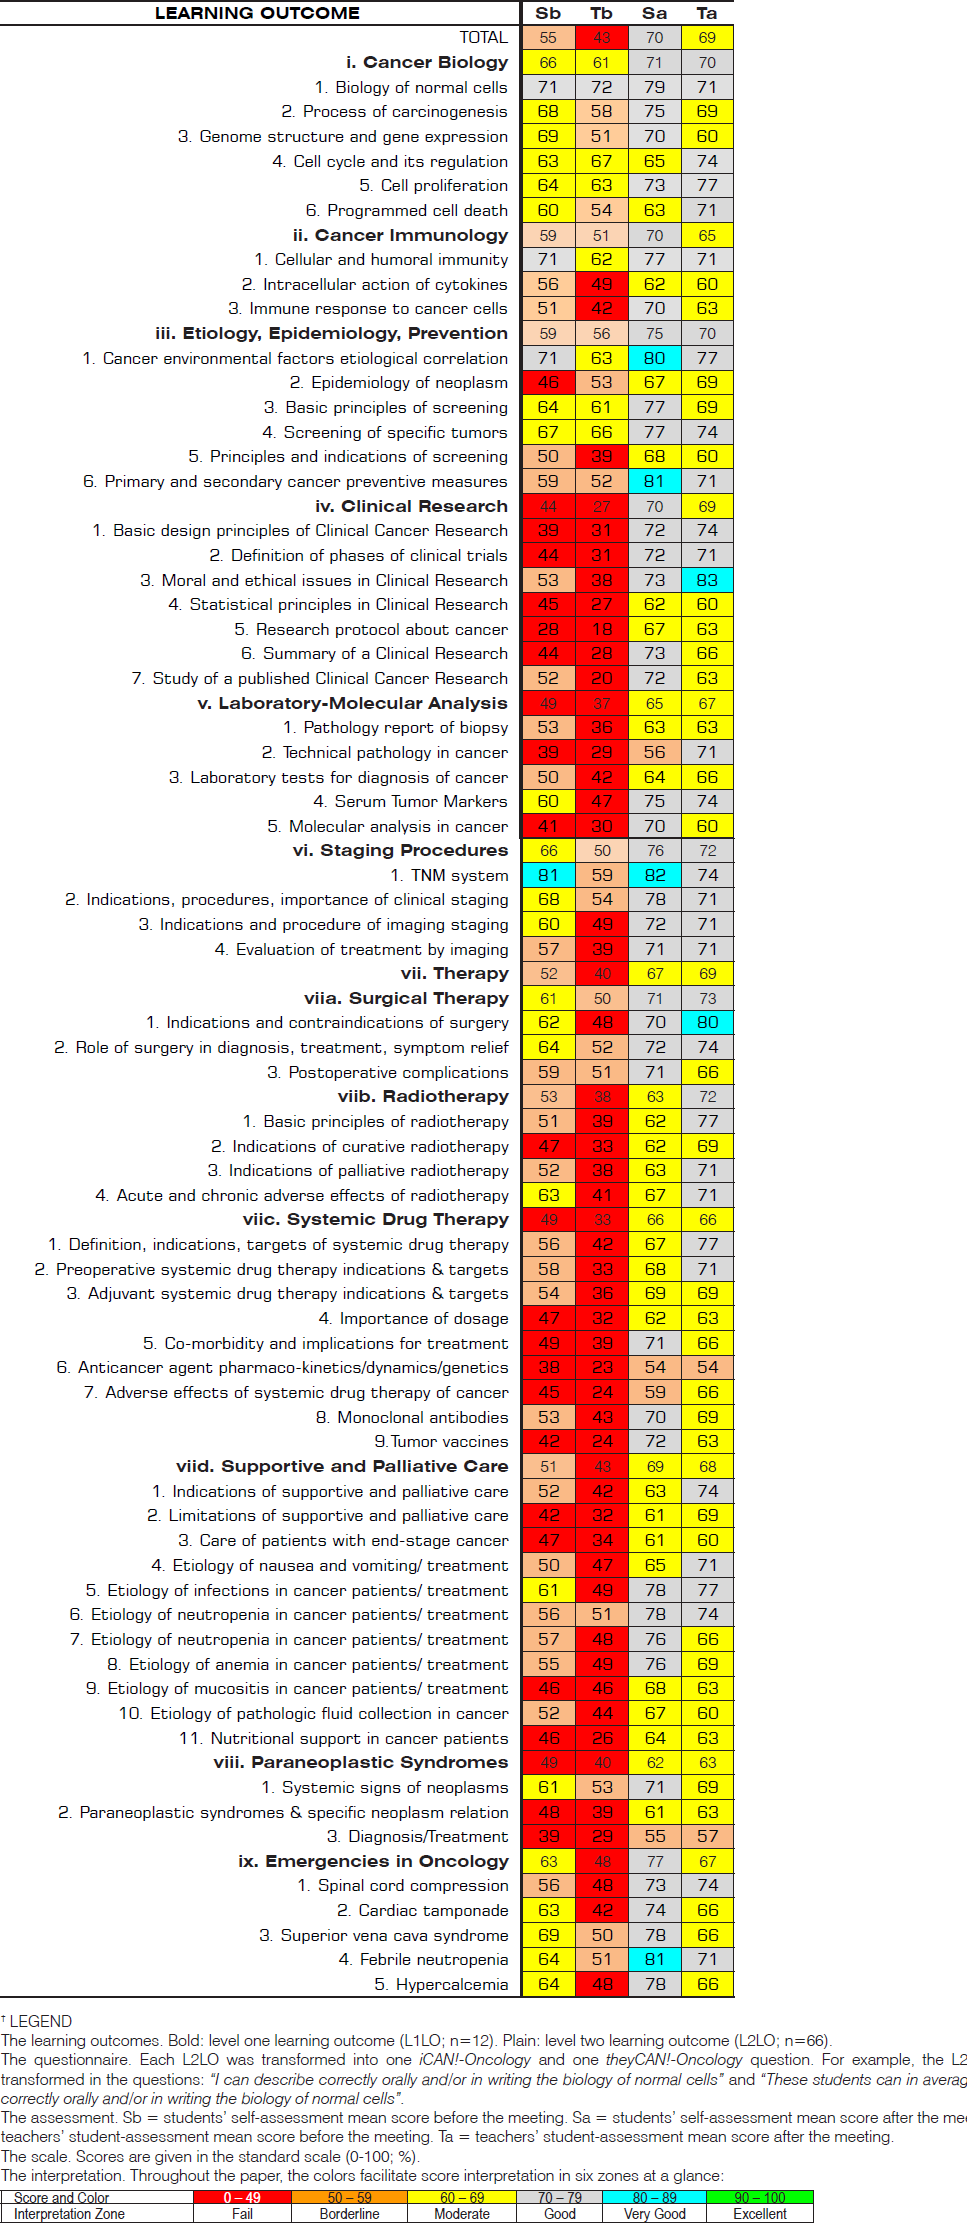 |

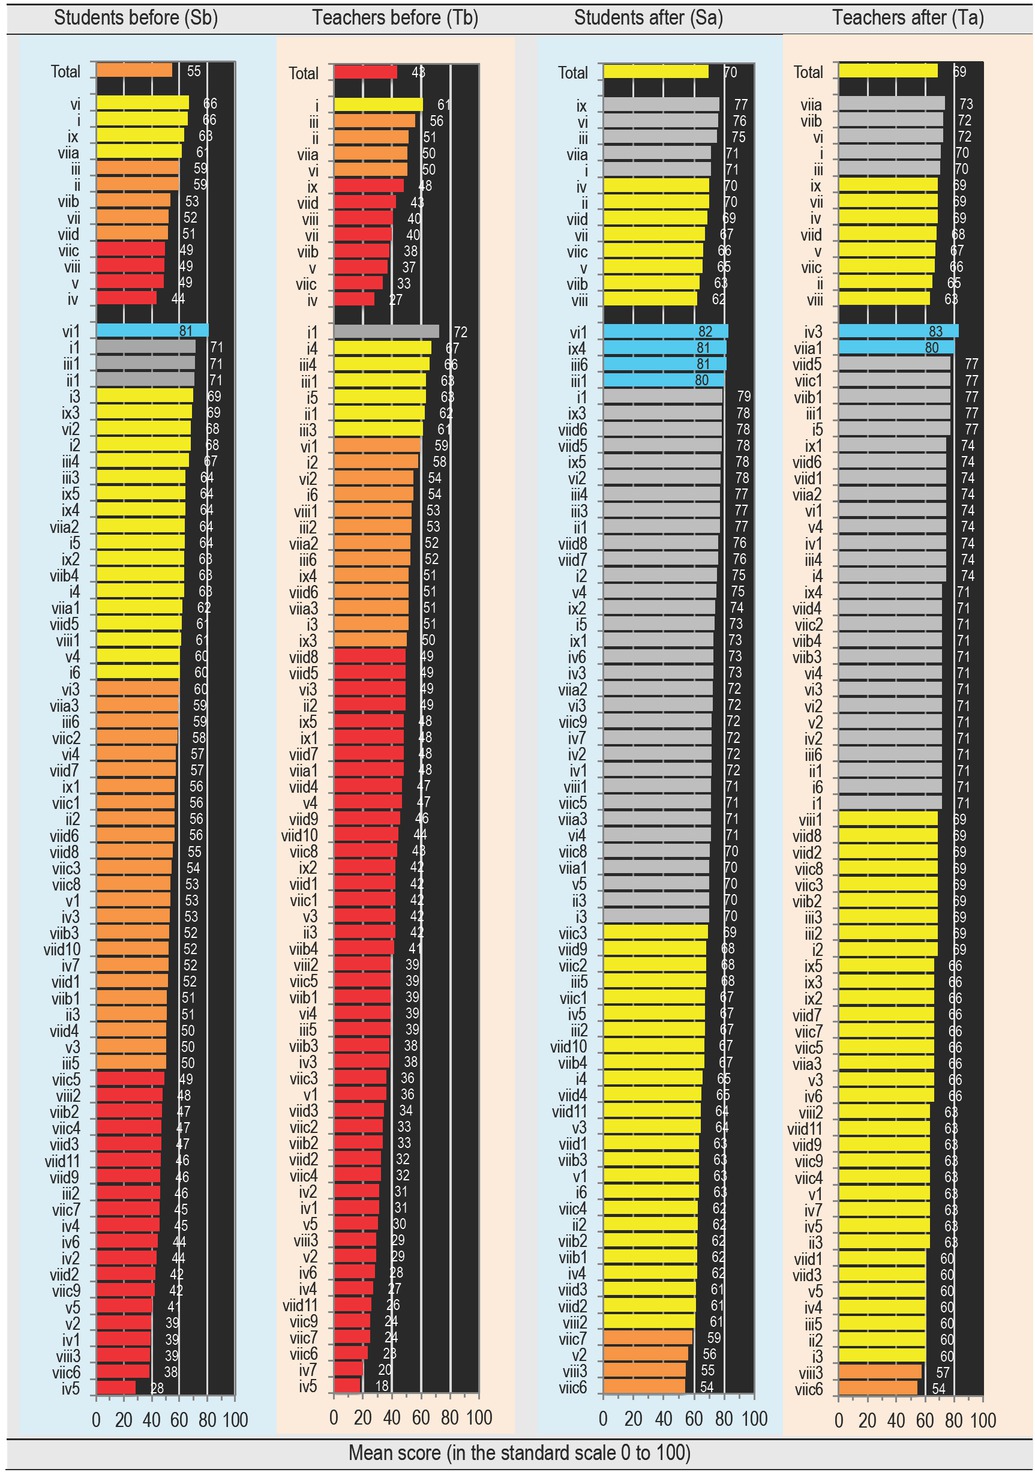
Figure 1
Descending L1LO and L2LO mean scores: Met (colored bars) and unmet (black area) learning outcomes.
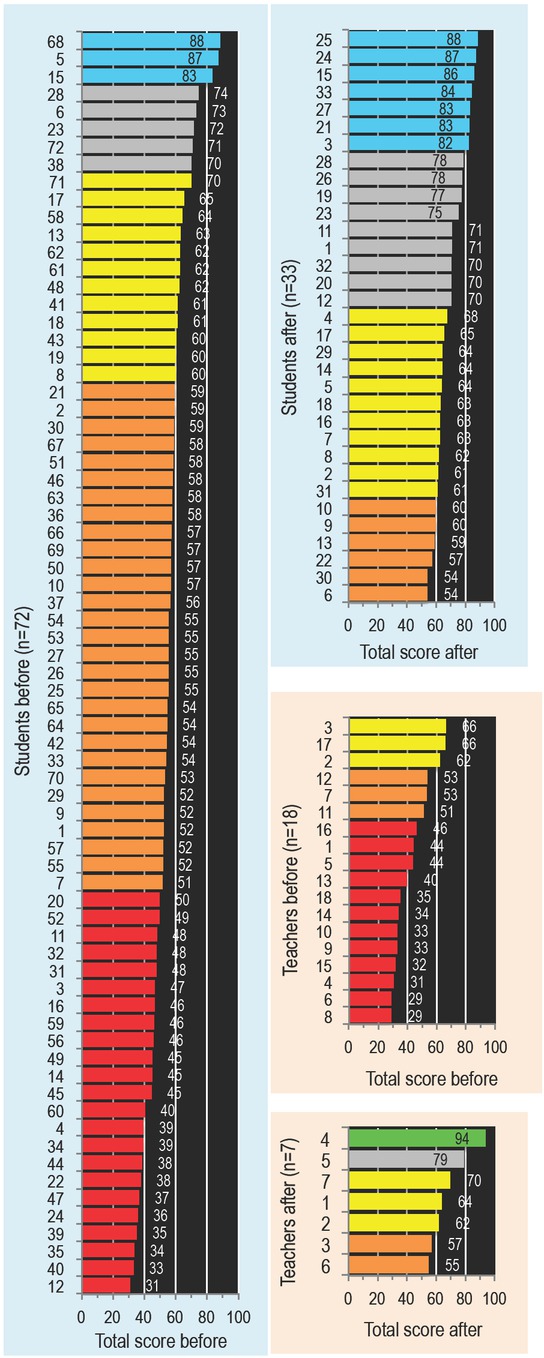
Figure 2
Descending student and teacher mean score: Students’ and teachers’ diversity.
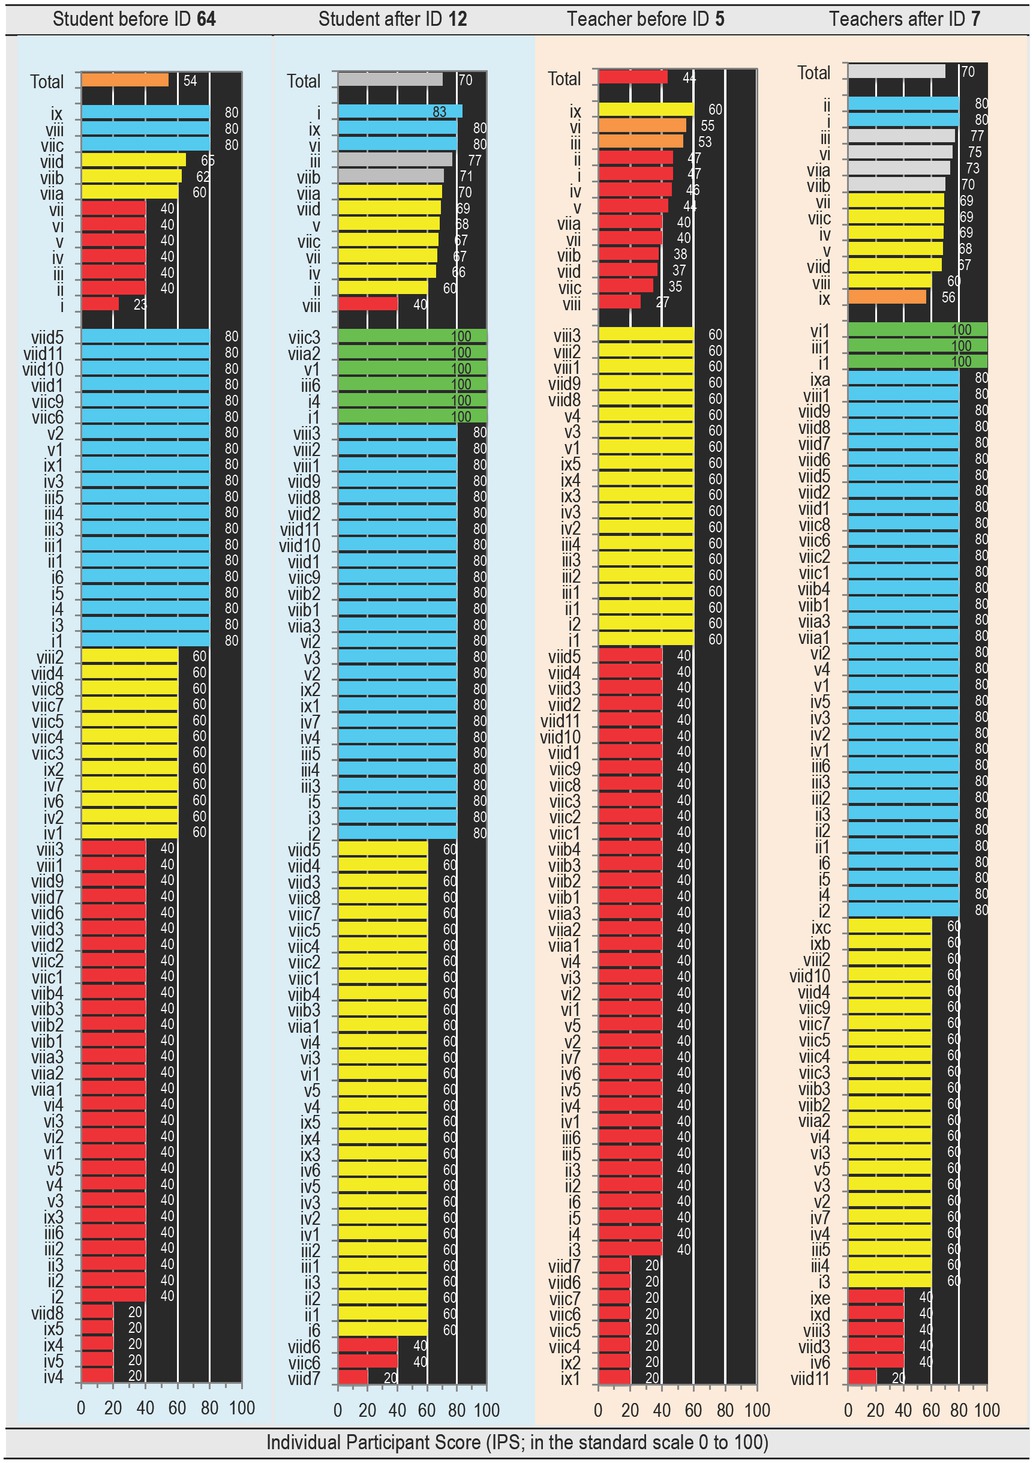
Figure 3
Particular student and teacher L1LO and L2LO score: Exact individual profile of each education partenaire.