
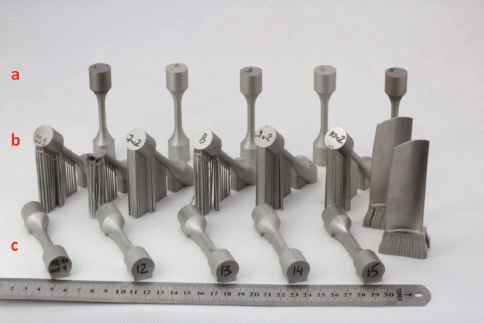
Fig. 1.
The printed specimens of all 3 directions and all 5 printing sets. The specimens printed in the direction parallel to their axis (row a), inclined 45° to their axis (row b), and perpendicular to their axis (row c).
Table 2.
Printing parameters, energy densities and porosities for all parameter sets.
| Printing parameters set no. | Laser power [W] | Scanning speed [mm/s] | Single layer thickness [mm] | Hatch spacing [mm] | Energy density [J/mm3] | Porosity [%] |
|---|---|---|---|---|---|---|
| 1 | optimized parameter set | 119.8 | 0.05% | |||
| 2 | 95 | 1000 | 0.35 | 0.09 | 30.2 | 8.06% |
| 3 | 120 | 1200 | 0.03 | 0.075 | 44.4 | 1.60% |
| 4 | 70 | 1200 | 0.02 | 0.105 | 27.8 | 16.81% |
| 5 | 145 | 800 | 0.02 | 0.06 | 151.0 | Ref. |
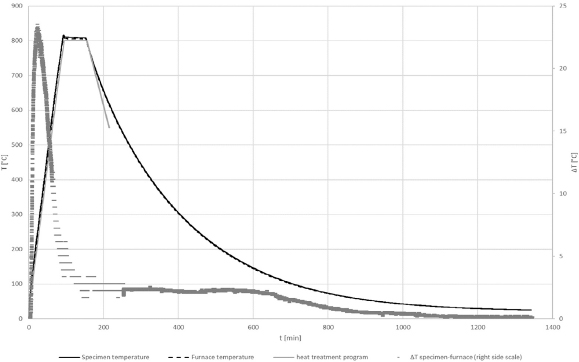
Fig. 2.
Temperature change during heat treatment.
| etching method | observations | see Fig. 3 |
|---|---|---|
| H2O2 solution in hydrochloric acid (etchant no. 22 according to Bhavar et al. (2017): 100 ml HCl + 0.5 ml H2O2 (30%)). | Promising results: the ability to distinguish grains based on the shade of their colors. Intense etching of melt boundaries and lack of etching of grain boundaries prevents their precise determination. | a |
| H2O2 solution in hydrochloric acid (ref. no. 22 according to Bhavar et al. (2017): 100 ml HCl + 0.5 ml H2O2 (30 %)) – electrolytic at 4 V. | Intensive etching of melt boundaries, grain boundaries invisible. | b |
| Kalling’s etchant 1 and 2. | Etching effects were not obtained. | - |
| 10% aqueous solution of oxalic acid – electrolytic etching at 6 V | Etching of melt boundaries, grain boundaries invisible. | c |
| 38% aqueous solution of hydrochloric acid. | A 10-minute etching first extracted the boundaries of the melts. A 3-hour etching revealed grains, but there is difficulty in precisely defining their boundaries. | d |
| 60 ml HNO3 + 40 ml H2O solution (ref. no. 219 according to Bhavar et al., 2017) – electrolytic etching at 1 V. | Promising results for observations with polarized light (the ability to distinguish grains based on the shade of their colors). Intense etching of melt boundaries and lack of etching of grain boundaries prevents their precise determination. | e, f |
| Berach’s etchant III with the addition of sodium pyrosulfate (1 g per 100 ml). | No apparent etching effects were obtained. | |
| Nital 2% (etchant no. 74 according to Kundra, 2023) – electrolytic etching at 8 V. | Etched melt boundaries in the first place, no etching of grain boundaries. Inability to distinguish between grains. | g |
| solution of 6.5 ml HCl + 1.5 ml HNO3 + 1.8 g CH3COOH + 1.17 ml H2O. | Promising results for observations with polarized light (the ability to distinguish grains based on the shade of their colors). Intense etching of melt boundaries and lack of etching of grain boundaries prevents their precise determination. | h |
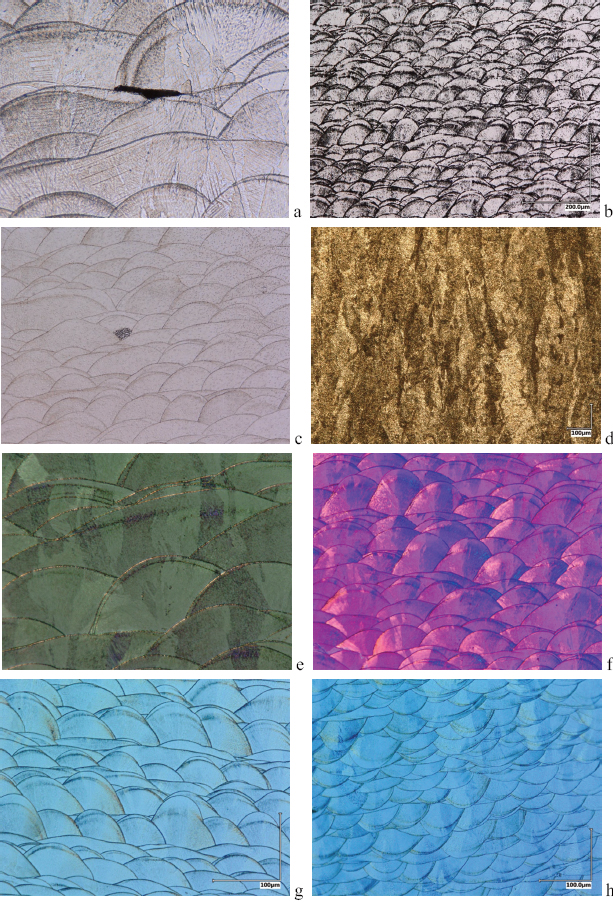
Fig. 3.
Effect of specimen etching with: a) H2O2 solution in hydrochloric acid, (etchant no. 22 according to Kundra, 2023): 100ml HCl + 0.5ml H2O2 (30%)), b) H2O2 solution in hydrochloric acid (ref. no. 22 according to Kundra, 2023): 100ml HCl + 0.5ml H2O2 (30 %)) – electrolytic etching at 4V,
c) 10% aqueous solution of oxalic acid – electrolytic etching at 6 V,
d) 38% aqueous solution of hydrochloric acid – 3h etching,
e) and f) 60 ml HNO3+ 40 ml H2O solution (ref. no. 219 according to Kundra, 2023) – electrolytic etching at 1 V – polarized light image,
g) Nital 2% (etchant no. 74 according to Kundra, 2023) – electrolytic etching at 8 V, h) solution of 6.5 ml HCl + 1.5 ml HNO3 + 1.8 g CH3COOH + 1.17 ml H2O.
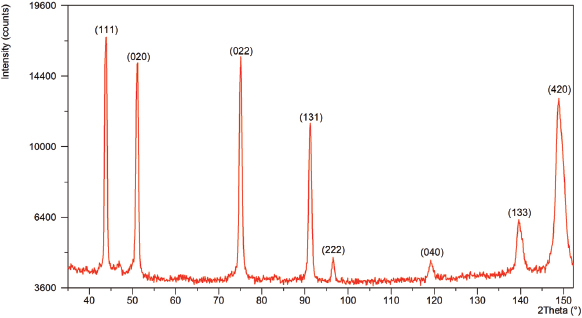
Fig. 5.
X-ray diffractogram obtained for the specimen before heat treatment with the Braggs reflections indexed.
Table 4.
Phase analysis results for the specimen after heat treatment.
| phase | ICDD card no. | structure space group | lattice parameters [Å] | % |
|---|---|---|---|---|
| Cr0.8Co0.2 | 01-071-7109 | hexagonal P63/mmc 194 | a0 = b0 = 2.52 c0= 4.062 | 44.5 |
| W0.04Co0.96 | 04-003-2727 | hexagonal P63/mmc 194 | a0 = b0= 2.523 c0 = 4.083 | 16.4 |
| W0.12Co0.88 | 04-003-2728 | cubic FCC Fm-3m 225 | a0 = 3.586 | 6.8 |
| Co304 | 04-014-7747 | cubic Fd-3m 227 | a0 = 8.1773 | 32.3 |
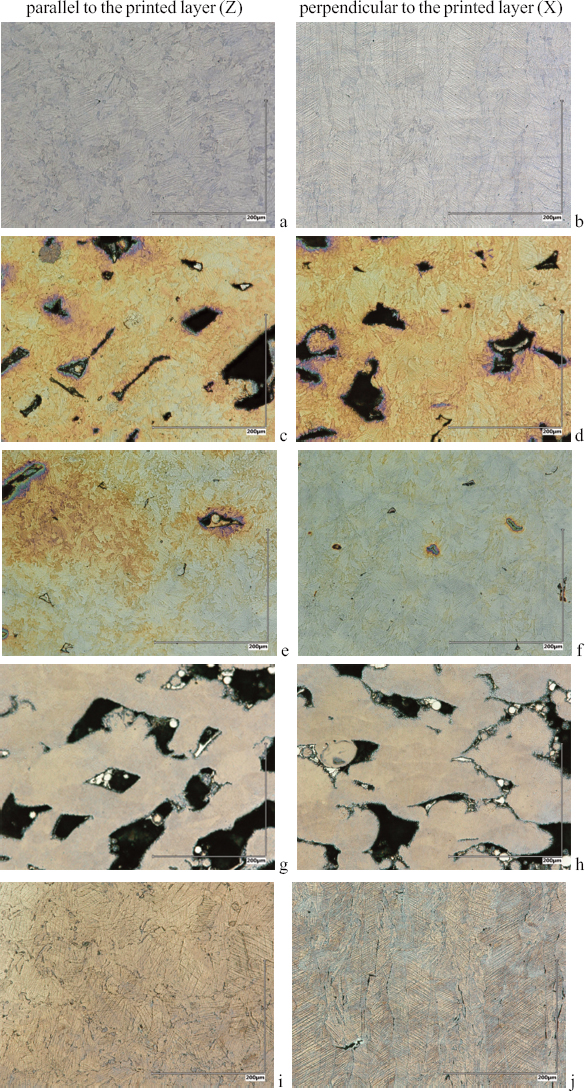
Fig. 4.
Microstructure of specimen no. 1 (a, b), no. 2 (c, d), no. 3 (e, f), no. 4 (g, h), no. 5 (i, j).
Table 3.
Phase analysis results for the specimen before heat treatment.
| phase | ICDD card no. | structure space group | lattice parameters [Å] | % |
|---|---|---|---|---|
| W0.12Co0.88 | 04-003-2728 | cubic FCC Fm-3m 225 | a0 = 3.586 | 73.7 |
| Cr0.38Co0.62 | 04-002-1030 | hexagonal P63/mmc 194 | a0 = b0 = 2.53 c0 = 4.08 | 12.4 |
| Co | 04-006-8066 | hexagonal P63/mmc 194 | a0 = b0 = 2.052 c0 = 4.09 | 11.4 |
| Mo Co3 | 04-004-3529 | hexagonal P63/mmc 194 | a0 = b0 = 5.1245 c0 = 4.1125 | 2.5 |
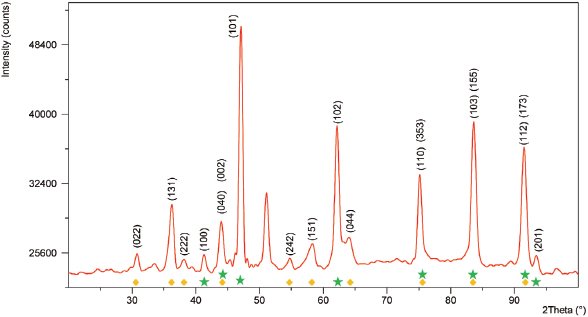
Fig. 6.
X-ray diffractogram obtained for the specimen after heat treatment with the Braggs reflections indexed: the yellow square corresponds to reflections of the cubic Co3O4 phase and the green stars to reflections of the hexagonal Cr0.8Co0.2 phase.
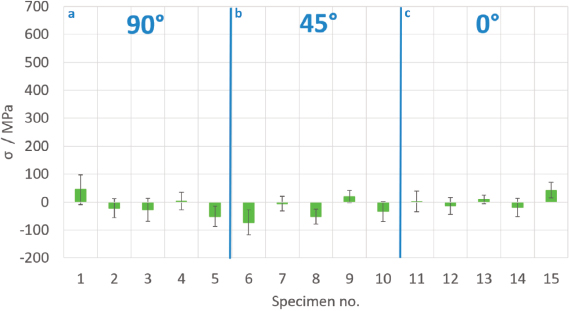
Fig. 7.
Results of stress measurements in the circumferential direction before heat treatment: a) for specimens with printing direction along the specimen axis, b) for specimens printed at an angle of 45° with respect to their axis, c) for specimens printed in a direction perpendicular to their axis.
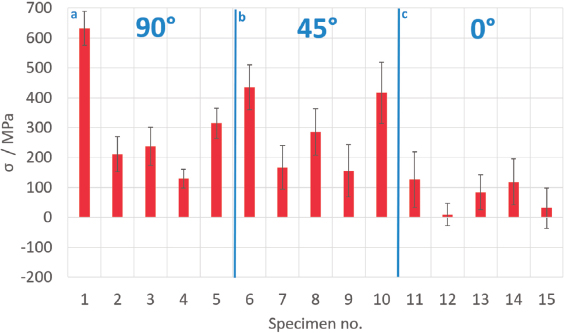
Fig. 8.
Results of stress measurements in the axial direction before heat treatment: a) for specimens with printing direction along the specimen axis, b) for specimens printed at an angle of 45° with respect to their axis, c) for specimens printed in a direction perpendicular to their axis.
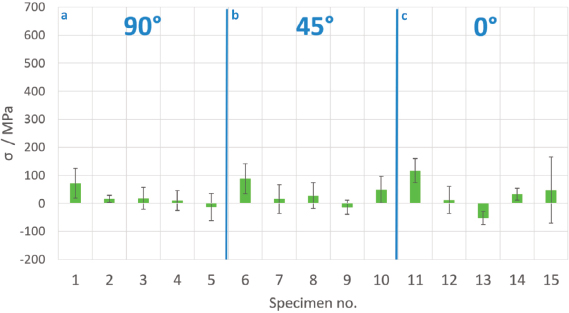
Fig. 9.
Results of stress measurements in the circumferential direction after heat treatment: a) for specimens with printing direction along the specimen axis, b) for specimens printed at an angle of 45° with respect to their axis, c) for specimens printed in a direction perpendicular to their axis.
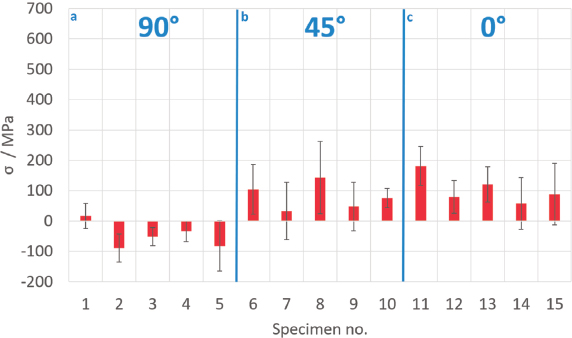
Fig. 10.
Results of stress measurements in the axial direction after heat treatment: a) for specimens with printing direction along the specimen axis, b) for specimens printed at an angle of 45° with respect to their axis, c) for specimens printed in a direction perpendicular to their axis.