
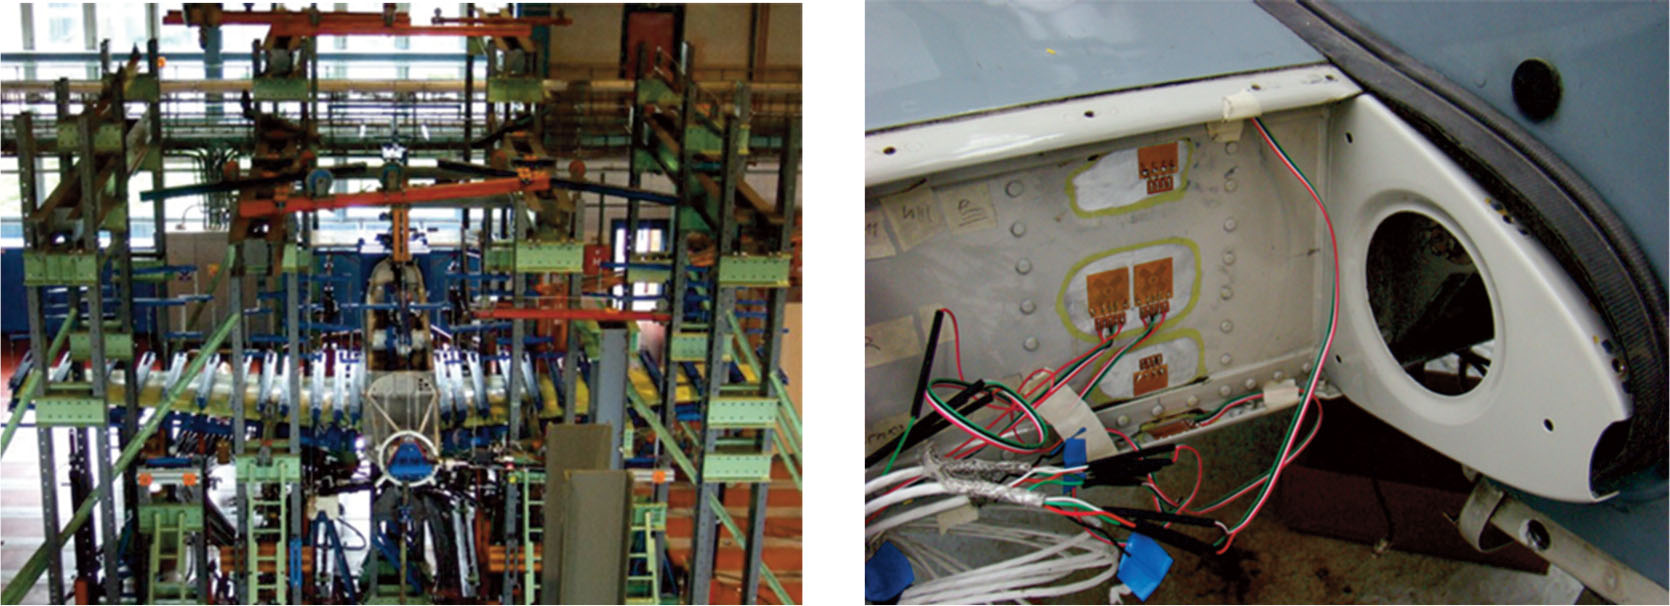
Figure 1.
Test specimen mounted in the test rig and the right front wing spar with installed strain gages.
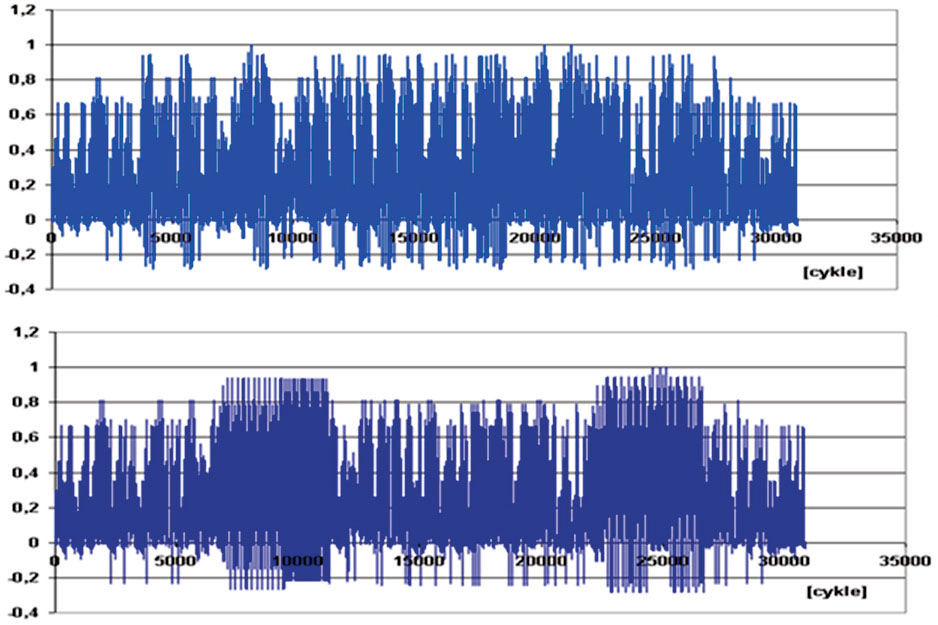
Figure 2.
Depiction of the PZL-130 load spectrum used during the test.
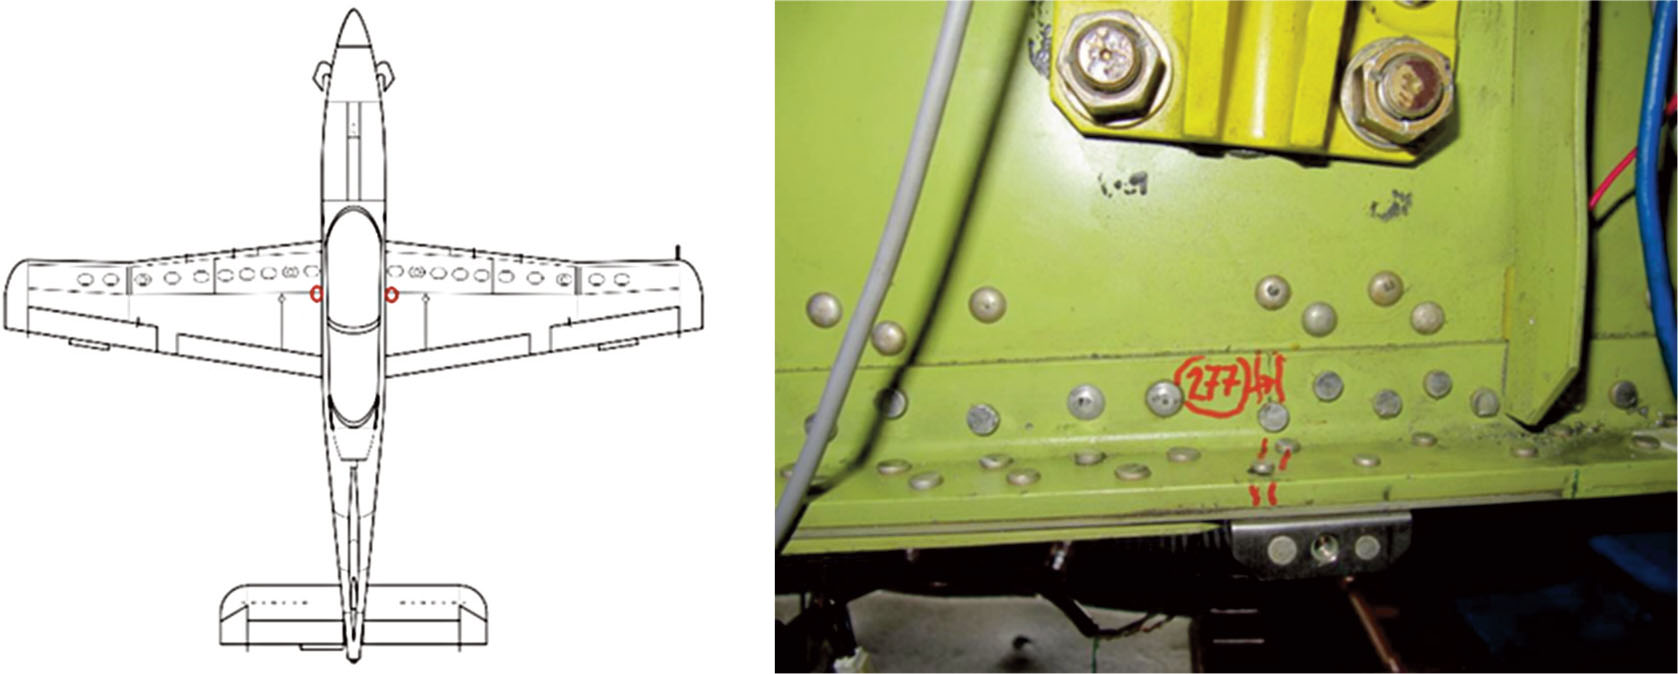
Figure 3.
Location of the CP2 – lower flange of the rear spar near rib No. 2. CP2, critical point No. 2.
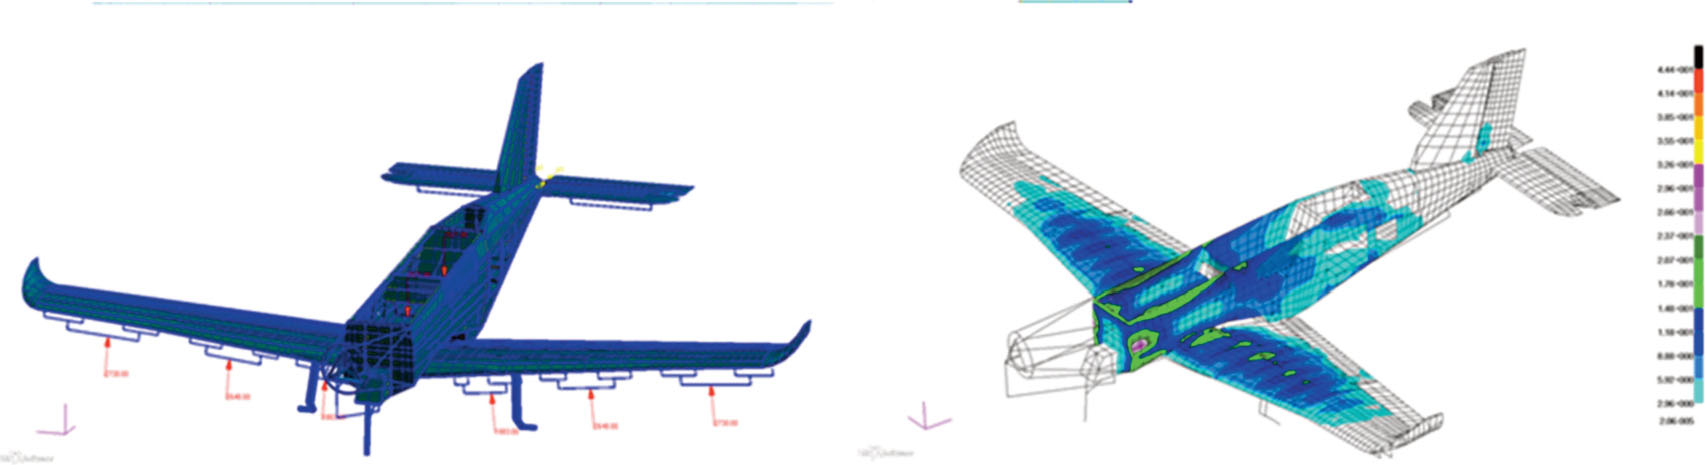
Figure 4.
Global-local model approach.
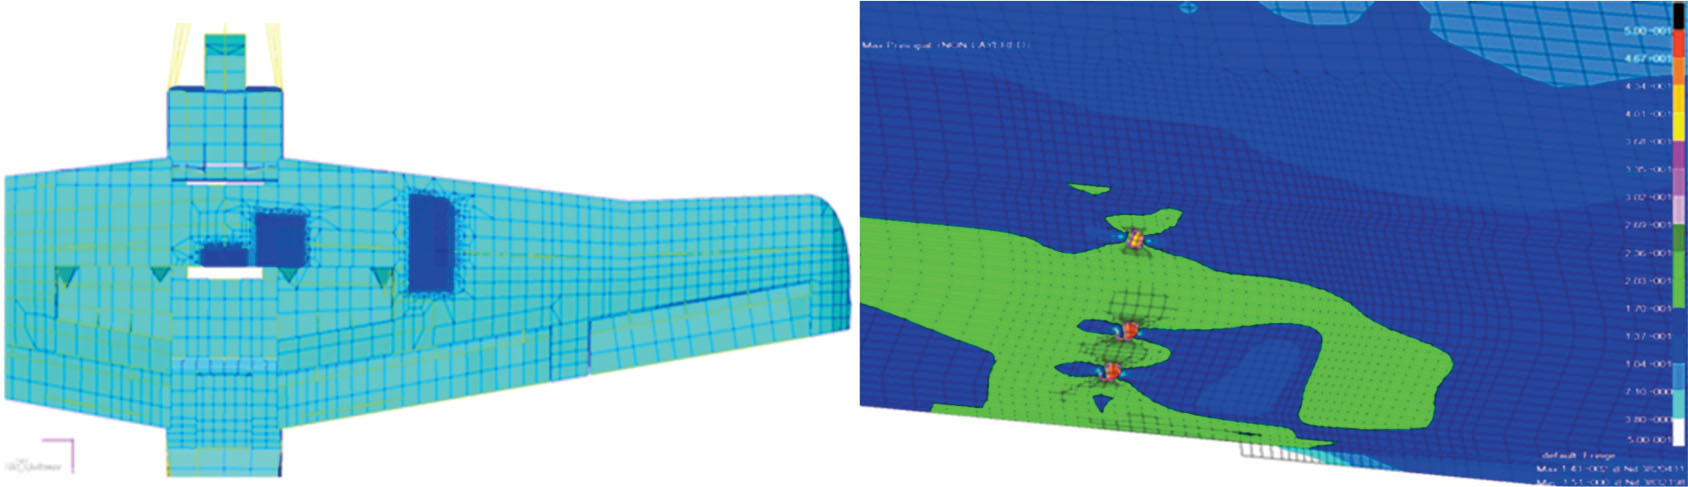
Figure 5.
Global strain fields and local stresses indicating crack initiation locations.
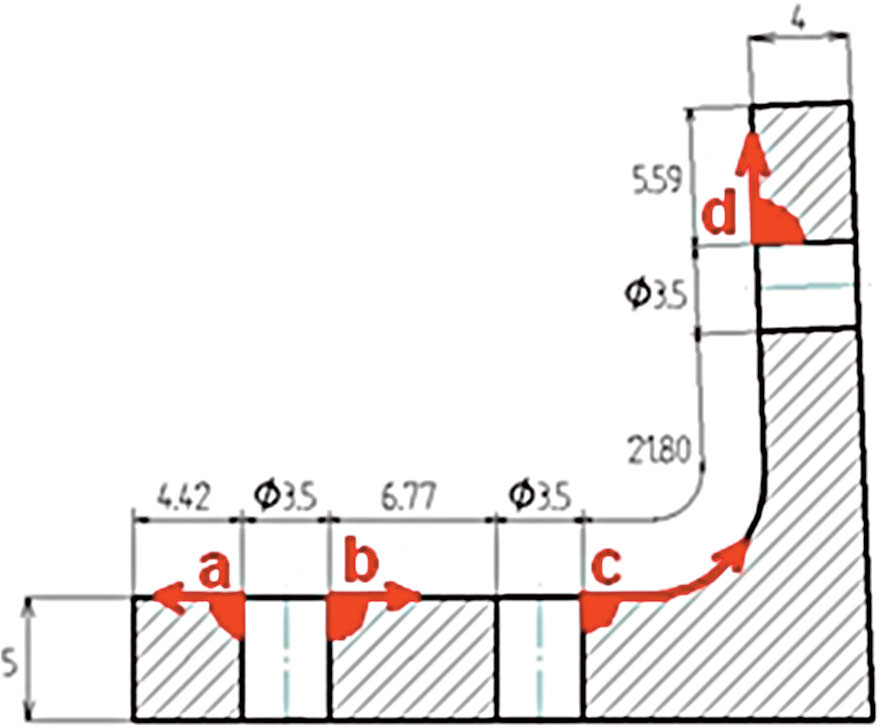
Figure 6.
Cross section of the damaged structure with the initiation and assumed crack propagation.
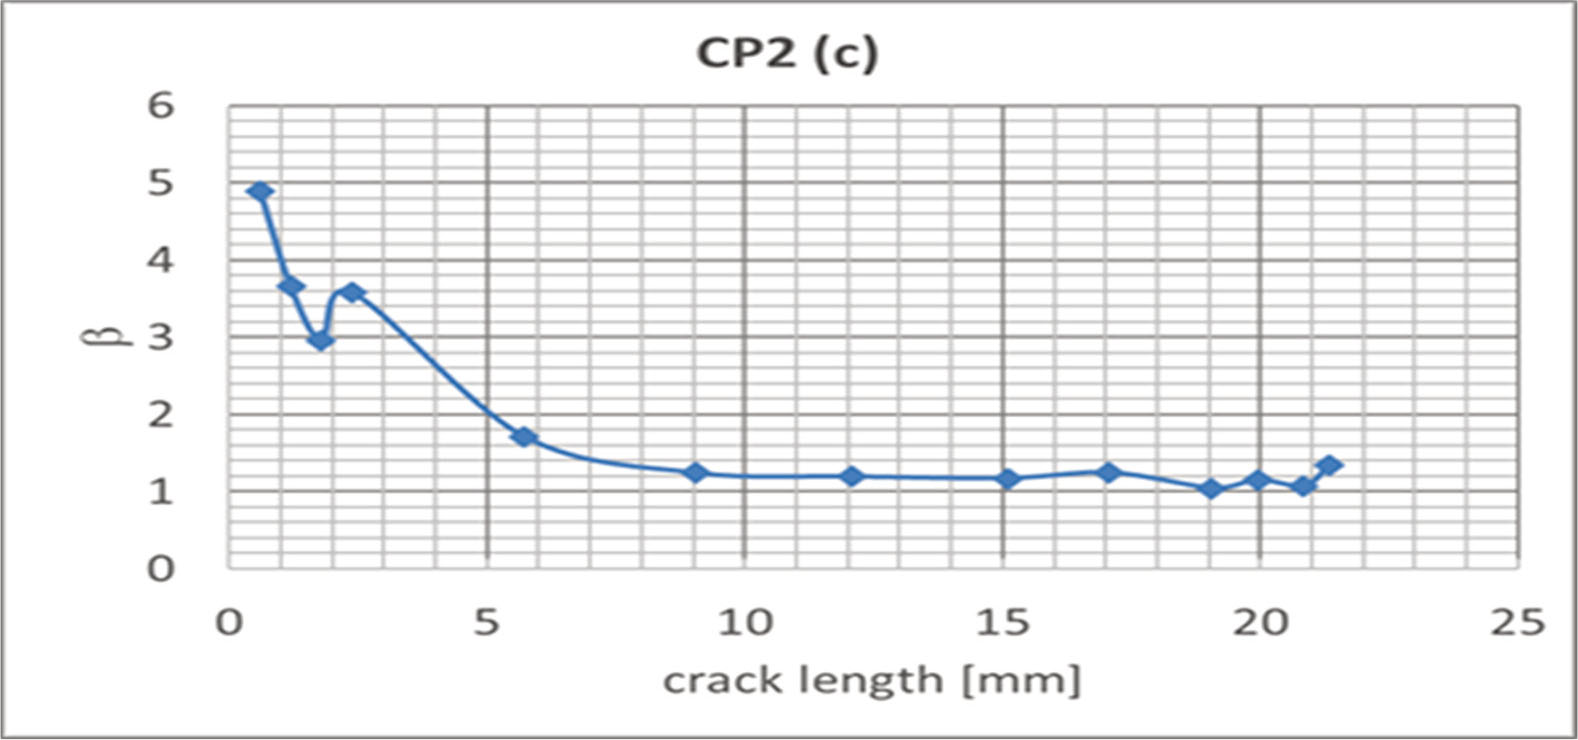
Figure 7.
Estimated β factor along crack length.
Table 1.
Initial data used in the analysis
| initial data | ||
| [m] | W | 0.0218 |
| [m] | T | 0.005 |
| [-] | SMF | 0.072 |
| [MPa] | E | 72000 |
| [-] | ν | 0.33 |
| [MPa] | YLD | 319 |
| [MPam-2] | KIC | 36.75 |
| [MPam-2] | KC | 74.722 |
| [-] | C | 1.71E-10 |
| [-] | n | 3.353 |
| [-] | p | 0.5 |
| [-] | q | 1 |
| [-] | Cth | 1.5 |
| [-] | Alpha | 1.5 |
| [h] | SFH | 7454.96 |
Table 2.
Exemplary results obtained for β value variations
| input data | β-10% | β-5% | β | β+5% | β+10% | ||
|---|---|---|---|---|---|---|---|
| [m] | W | 0.0218 | 0.0218 | 0.0218 | 0.0218 | 0.0218 | 0.0218 |
| [m] | T | 0.005 | 0.005 | 0.005 | 0.005 | 0.005 | 0.005 |
| [-] | SMF | 0.072 | 0.072 | 0.072 | 0.072 | 0.072 | 0.072 |
| [MPa] | E | 72000 | 72000 | 72000 | 72000 | 72000 | 72000 |
| [-] | n | 0.33 | 0.33 | 0.33 | 0.33 | 0.33 | 0.33 |
| [MPa] | YLD | 319 | 319 | 319 | 319 | 319 | 319 |
| [MPam-2] | KIC | 36.75 | 36.75 | 36.75 | 36.75 | 36.75 | 36.75 |
| [MPam-2] | KC | 74.722 | 74.722 | 74.722 | 74.722 | 74.722 | 74.722 |
| [-] | C | 1.71E-10 | 1.7073E-10 | 1.7073E-10 | 1.71E-10 | 1.7073E-10 | 1.7073E-10 |
| [-] | n | 3.353 | 3.353 | 3.353 | 3.353 | 3.353 | 3.353 |
| [-] | p | 0.5 | 0.5 | 0.5 | 0.5 | 0.5 | 0.5 |
| [-] | q | 1 | 1 | 1 | 1 | 1 | 1 |
| [-] | Cth | 1.5 | 1.5 | 1.5 | 1.5 | 1.5 | 1.5 |
| [-] | Alpha | 1.5 | 1.5 | 1.5 | 1.5 | 1.5 | 1.5 |
| [h] | SFH | 7454.96 | 11040.33 | 9026.14 | 7454.96 | 6240.39 | 5251.65 |
| 7454.96 | 48.09% | 21.08% | 0.00% | -16.29% | -29.55% | ||
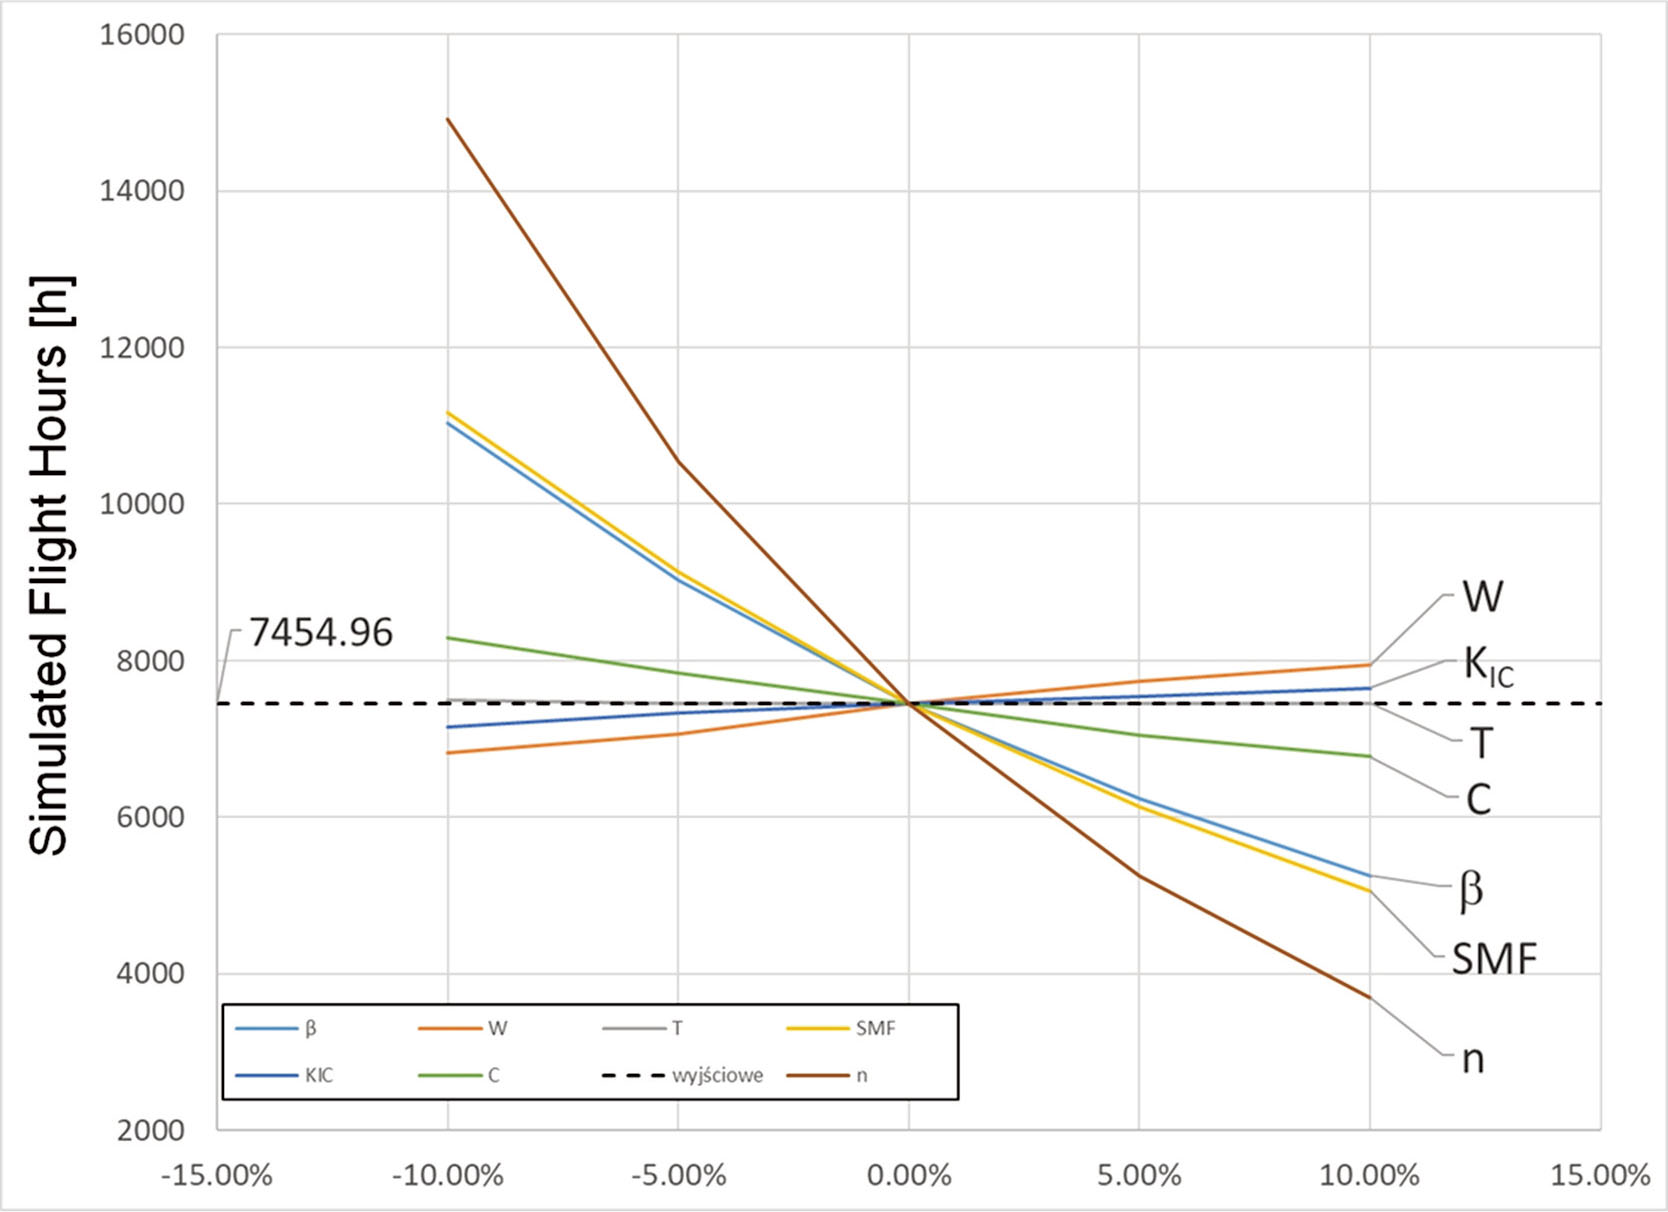
Figure 8.
Final results depicting sensitivity of the estimation on input data change. SFH, simulated flight hours; SMF, stress multiplication factor.