
Figure 1:
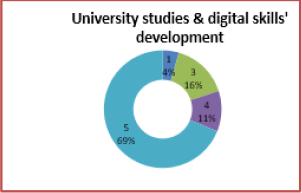
Figure 2:
Figure 3:
Figure 4:
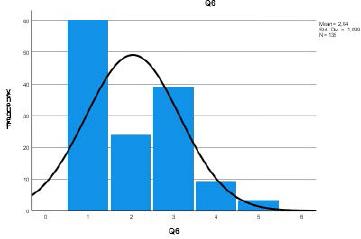
Figure 5:
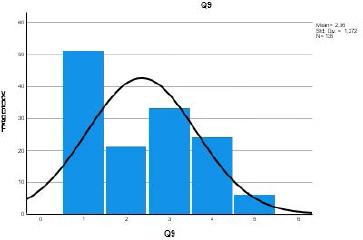
Figure 6:
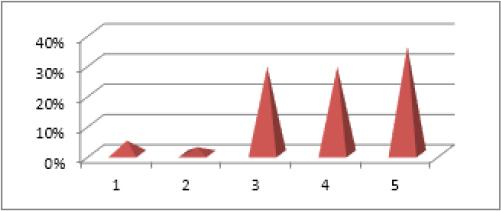
Figure 7:
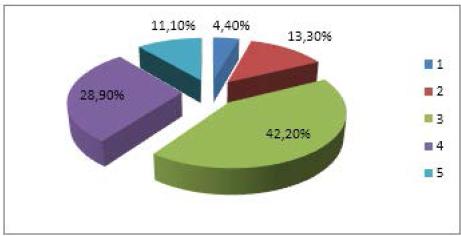
Figure 8:
COVID-19 and digital literacy
| Likert scale | COVID-19 disruption of education (%) | Digital conduct of exams satisfaction (%) | Confidence in digital exams (%) | COVID-19 digital competence (%) | COVID-19 online education (%) |
|---|---|---|---|---|---|
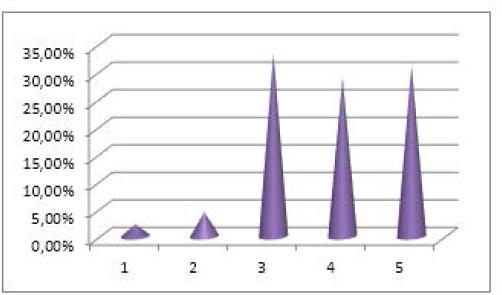
| 1. Not at all satisfied | 4.40 | 2.20 | 2.20 | ||
| 2. Little satisfaction | 13.30 | 4.40 | 2.20 | ||
| 3. Neutral | 42.20 | 33.30 | 24.40 | 24.40 | 15.60 |
| 4. Satisfied | 28.90 | 28.90 | 35.60 | 26.70 | 31.10 |
| 5. Very satisfied | 11.10 | 31.10 | 35.60 | 48.90 | 53.30 |
Reliability statistics
| Item-Total Statistics | ||||||
|---|---|---|---|---|---|---|
| Scale Mean if Item Deleted | Scale Variance if Item Deleted | Corrected Item-Total Correlation | Squared Multiple Correlation | Cronbach’s Alpha if Item Deleted | ||
| Q1 | 74.78 | 162.398 | 0.519 | 0.831 | 0.873 | |
| Q2 | 74.47 | 161.042 | 0.479 | 0.829 | 0.874 | |
| Q3 | 73.62 | 160.670 | 0.522 | 0.745 | 0.873 | |
| Q4 | 73.29 | 160.774 | 0.519 | 0.788 | 0.873 | |
| Q5 | 72.42 | 171.604 | 0.198 | 0.680 | 0.882 | |
| Q6 | 73.69 | 166.649 | 0.252 | 0.621 | 0.883 | |
| Q7 | 73.20 | 167.624 | 0.340 | 0.500 | 0.878 | |
| Q8 | 73.60 | 161.391 | 0.462 | 0.631 | 0.875 | |
| Q9 | 73.64 | 161.828 | 0.368 | 0.791 | 0.879 | |
| Q10 | 74.11 | 162.323 | 0.442 | 0.839 | 0.875 | |
| Q11 | 73.44 | 157.547 | 0.646 | 0.797 | 0.869 | |
| Q12 | 72.84 | 162.043 | 0.550 | 0.624 | 0.872 | |
| Q13 | 73.76 | 162.276 | 0.445 | 0.681 | 0.875 | |
| Q14 | 73.07 | 155.481 | 0.697 | 0.864 | 0.867 | |
| Q15 | 73.16 | 161.774 | 0.542 | 0.732 | 0.872 | |
| Q16 | 72.87 | 161.176 | 0.634 | 0.851 | 0.870 | |
| Q17 | 72.93 | 156.958 | 0.753 | 0.842 | 0.866 | |
| Q18 | 73.53 | 167.893 | 0.364 | 0.490 | 0.877 | |
| Q19 | 73.00 | 160.612 | 0.653 | 0.735 | 0.870 | |
| Q20 | 72.82 | 165.640 | 0.476 | 0.634 | 0.875 | |
| Q21 | 72.58 | 170.261 | 0.335 | 0.658 | 0.878 | |
| Q22 | 72.44 | 173.264 | 0.221 | 0.712 | 0.880 | |
Skewness and kurtosis tests
| Statistics | ||||||||||||
|---|---|---|---|---|---|---|---|---|---|---|---|---|
| N Valid | Missing Mean | Median Mode | Std. Deviation | Skewness | Std. Error of Kurtosis Skewness | Std. Error of Kurtosis | Sum | |||||
| Q1 | 135 | 0 | 2.04 | 2.00 | 1 | 1.099 | 0.631 | 0.209 | -0.580 | 0.414 | 276 | |
| Q2 | 135 | 0 | 2.36 | 2.00 | 1 | 1.272 | 0.362 | 0.209 | -1.141 | 0.414 | 318 | |
| Q3 | 135 | 0 | 3.20 | 3.00 | 3a | 1.208 | -0.393 | 0.209 | -0.655 | 0.414 | 432 | |
| Q4 | 135 | 0 | 3.53 | 4.00 | 4 | 1.208 | -0.736 | 0.209 | -0.156 | 0.414 | 477 | |
| Q5 | 135 | 0 | 4.40 | 5.00 | 5 | 1.045 | -1.820 | 0.209 | 2.783 | 0.414 | 594 | |
| Q6 | 135 | 0 | 3.13 | 3.00 | 4 | 1.444 | -0.191 | 0.209 | -1.317 | 0.414 | 423 | |
| Q7 | 135 | 0 | 3.62 | 4.00 | 3 | 1.064 | -0.439 | 0.209 | -0.190 | 0.414 | 489 | |
| Q8 | 135 | 0 | 3.22 | 3.00 | 3a | 1.285 | -0.168 | 0.209 | -1.043 | 0.414 | 435 | |
| Q9 | 135 | 0 | 3.18 | 4.00 | 4 | 1.501 | -0.349 | 0.209 | -1.352 | 0.414 | 429 | |
| Q10 | 135 | 0 | 2.71 | 3.00 | 4 | 1.263 | 0.088 | 0.209 | -1.190 | 0.414 | 366 | |
| Q11 | 135 | 0 | 3.38 | 3.00 | 4 | 1.184 | -0.279 | 0.209 | -0.811 | 0.414 | 456 | |
| Q12 | 135 | 0 | 3.98 | 4.00 | 5 | 1.068 | -1.074 | 0.209 | 0.773 | 0.414 | 537 | |
| Q13 | 135 | 0 | 3.07 | 3.00 | 3 | 1.259 | -0.127 | 0.209 | -0.831 | 0.414 | 414 | |
| Q14 | 135 | 0 | 3.76 | 4.00 | 5 | 1.218 | -0.876 | 0.209 | 0.001 | 0.414 | 507 | |
| Q15 | 135 | 0 | 3.67 | 4.00 | 3a | 1.000 | -0.331 | 0.209 | -0.815 | 0.414 | 495 | |
| Q16 | 135 | 0 | 3.96 | 4.00 | 4 | 0.992 | -1.029 | 0.209 | 1.283 | 0.414 | 534 | |
| Q17 | 135 | 0 | 3.89 | 4.00 | 5 | 1.063 | -0.798 | 0.209 | 0.319 | 0.414 | 525 | |
| Q18 | 135 | 0 | 3.29 | 3.00 | 3 | 0.984 | -0.180 | 0.209 | -0.127 | 0.414 | 444 | |
| Q19 | 135 | 0 | 3.82 | 4.00 | 3 | 0.999 | -0.455 | 0.209 | -0.264 | 0.414 | 516 | |
| Q20 | 135 | 0 | 4.00 | 4.00 | 4a | 0.946 | -0.804 | 0.209 | 0.552 | 0.414 | 540 | |
| Q21 | 135 | 0 | 4.24 | 4.00 | 5 | 0.824 | -0.483 | 0.209 | -1.360 | 0.414 | 573 | |
| Q22 | 135 | 0 | 4.38 | 5.00 | 5 | 0.742 | -0.739 | 0.209 | -0.818 | 0.414 | 591 | |
Normality tests
| Tests of Normality | ||||||
|---|---|---|---|---|---|---|
| Kolmogorov-Smirnov | Shapiro-Wilk | |||||
| Statistic | df | Sig. | Statistic | Df | Sig. | |
| Q1 | 0.274 | 135 | <0.001 | 0.817 | 135 | <0.001 |
| Q2 | 0.234 | 135 | <0.001 | 0.851 | 135 | <0.001 |
| Q3 | 0.191 | 135 | <0.001 | 0.896 | 135 | <0.001 |
| Q4 | 0.228 | 135 | <0.001 | 0.861 | 135 | <0.001 |
| Q5 | 0.406 | 135 | <0.001 | 0.622 | 135 | <0.001 |
| Q6 | 0.192 | 135 | <0.001 | 0.877 | 135 | <0.001 |
| Q7 | 0.187 | 135 | <0.001 | 0.880 | 135 | <0.001 |
| Q8 | 0.172 | 135 | <0.001 | 0.904 | 135 | <0.001 |
| Q9 | 0.241 | 135 | <0.001 | 0.843 | 135 | <0.001 |
| Q10 | 0.180 | 135 | <0.001 | 0.892 | 135 | <0.001 |
| Q11 | 0.189 | 135 | <0.001 | 0.905 | 135 | <0.001 |
| Q12 | 0.242 | 135 | <0.001 | 0.819 | 135 | <0.001 |
| Q13 | 0.190 | 135 | <0.001 | 0.903 | 135 | <0.001 |
| Q14 | 0.224 | 135 | <0.001 | 0.839 | 135 | <0.001 |
| Q15 | 0.176 | 135 | <0.001 | 0.882 | 135 | <0.001 |
| Q16 | 0.229 | 135 | <0.001 | 0.817 | 135 | <0.001 |
| Q17 | 0.208 | 135 | <0.001 | 0.836 | 135 | <0.001 |
| Q18 | 0.215 | 135 | <0.001 | 0.900 | 135 | <0.001 |
| Q19 | 0.195 | 135 | <0.001 | 0.859 | 135 | <0.001 |
| Q20 | 0.211 | 135 | <0.001 | 0.835 | 135 | <0.001 |
| Q21 | 0.309 | 135 | <0.001 | 0.754 | 135 | <0.001 |
| Q22 | 0.333 | 135 | <0.001 | 0.741 | 135 | <0.001 |
Self-evaluation opinion questions
| Likert scale | How would you evaluate your digital skills (%) | Have university studies developed your digital skills (%) | How satisfied are you with your digital skills (%) | How do you value digital literacy (%) | Have you developed your digital identity (%) |
|---|---|---|---|---|---|
| 1. Not at all satisfied | 11 | 4 | 20 | 4 | 24 |
| 2. Little satisfaction | 4 | 18 | 9 | 22 | |
| 3. Neutral | 27 | 16 | 18 | 36 | 18 |
| 4. Satisfied | 36 | 11 | 22 | 29 | 29 |
| 5. Very satisfied | 22 | 69 | 22 | 22 | 7 |
Cronbach’s α – internal consistent efficiency Reliability Statistics
| Cronbach’s Alpha | Cronbach’s Alpha Based on Standardized Items | N of Items |
|---|---|---|
| ,880 | ,883 | 22 |
Good educational practices
| Likert scale | Introductory courses & digital environment presentation (%) | Studentinstructor relations & digital literacy (%) | Email conduct with instructors (%) | Assistance from fellow students (%) | Team educational activities (%) |
|---|---|---|---|---|---|
| 1. Not at all satisfied | 16 | 9 | 2 | 4 | 4 |
| 2. Little satisfaction | 13 | 4 | 13 | 2 | |
| 3. Neutral | 36 | 22 | 29 | 24 | 29 |
| 4. Satisfied | 20 | 31 | 27 | 38 | 29 |
| 5. Very satisfied | 16 | 33 | 29 | 33 | 36 |