
The tourism sector has become an important economic resource in recent years as living standards have improved and its economic impact has been recognised (Kayar & Kozak, 2010; Nazmfar et al., 2019). Rising individual demand has led to an increase in the number of tourist facilities and led countries to update their policies to increase the number of visitors and tourism revenues. The World Tourism Organisation reported that 1.5 billion individuals participated in tourism activities in 2019 (UN Tourism, 2020). According to the World Travel and Tourism Council, the travel sector contributed $10 trillion in GDP, created 1 in 5 new jobs and accounted for 10.4 per cent of global employment (334 million people). Foreign visitor expenditures reached 1.9 trillion dollars in 2019 (World Travel & Tourism Council, 2023). Although these figures have decreased during the pandemic, they are expected to reach pre-pandemic levels by 2023, emphasising the critical role of tourism.
Intense competition among destinations for a share of the huge tourism market creates challenges for sustainable growth (Hassan & Usakli, 2013; Balan et al., 2009). Countries active in global tourism should adopt innovative strategies to ensure customer satisfaction and maintain competitive advantage (Turanli & Güneren, 2003). Destinations that are successful in this field gain a significant competitive advantage.
Understanding the factors that provide competitive advantage in the tourism sector of developed and developing countries can help policy makers to improve tourism performance and develop effective strategies. A country’s ability to remain competitive in providing goods and services to tourists is an important factor determining its growth potential (Dwyer et al., 2000). The World Economic Forum’s Travel and Tourism Competitiveness Index allows countries to recognise their strengths and weaknesses by evaluating destinations according to various factors.
Although there are many studies on the Travel and Tourism Competitiveness Index (Băbăț et al, 2023; Dias, 2017; Hanafiah et al, 2017; Khan et al, 2017; Martín et al, 2017; Uyar et al, 2023; Rodríguez-Díaz & Pulido-Fernández, 2021; Pulido-Fernández & Rodríguez-Díaz, 2016), studies on the use of this index in comparing destinations are limited (Hassan & Uşakli, 2013; Kayar & Kozak, 2010; Kunst & Ivandić, 2021; Krstic et al, 2016; Nazmfar et al, 2019; Pérez León et al, 2021).
This study aims to fill this gap by analysing the competitiveness of eight countries in the Mediterranean region (Spain, Turkey, Italy, Greece, Portugal, Egypt, Morocco and Tunisia) using the Travel and Tourism Development Index. In addition to identifying the strengths and weaknesses of these countries, the study aims to map the competitive position of the destinations and identify the most effective criteria for assessing competitive advantage.
Understanding destination competitiveness requires first defining the terms ‘destination’ and ‘tourism destinations’. Although there is no generally accepted definition, destinations are generally defined as places where consumers travel temporarily (Pike & Page, 2014). A tourism destination is a structure that brings together various tourism products and services. According to Buhalis (2000), key features such as attractions, accessibility, facilities and activities attract visitors by influencing competitiveness.
Competitiveness is generally defined as the ability to create and offer superior goods and services compared to competitors (International Institute for Management Development, 1994). Companies that offer better quality products and services gain an advantage in the market (Kayar & Kozak, 2010). Competitiveness has a multidimensional and complex structure and is categorised at firm, sector, and national/international levels (Sacli, 2019). Firm-level competitiveness includes cost-effective production, the ability to offer attractive products, and the ability to innovate (Ada et al., 2008). Sectoral competitiveness reflects the total output of enterprises and global market competition (Sirikrai & Tang, 2006). At the national level, competitiveness refers to increasing the income and welfare of citizens (Waheeduzzaman & Ryans, 1996).
Destination competitiveness refers to the ability of a destination to maintain or improve its market position (d’Hauteserre, 2000). Crouch and Ritchie (1999) define this concept from a sociological perspective as the ability to offer citizens a high quality of life, while Hassan (2000) associates it with the capacity to develop value-creating products in the context of sustainability. Crouch and Ritchie’s conceptual framework identifies factors such as macro and microeconomic environments, resources and management as key elements. Porter’s Diamond Model emphasises elements such as demand conditions and supporting industries (Porter, 1990), while Dwyer and Kim’s (2003) Integrative Model includes inherited resources, demand conditions and socioeconomic factors.
There are many empirical studies on the measurement of destination competitiveness. Mihalič (2000) emphasised the role of environmental management in competitiveness and suggested that targeted environmental marketing campaigns and quality control can enhance environmental competitiveness. Enright and Newton (2004) suggest that in addition to traditional destination characteristics, business-related elements should also be considered. For example, Hudson et al. (2004) used indices for Canadian ski resorts and showed that they are useful in planning tourism destinations. Kozak and Rimmington (1999) analysed British tourists’ perceptions of Turkey and stated that Turkey stands out with its friendly approach, affordability and hospitality. Similarly, Sanli and Baloglu (2006) evaluated Mediterranean destinations using WTTC data and identified competitive clusters.
Kayar and Kozak (2010) evaluated 28 European countries using Travel and Tourism Competitiveness Index data and found that transport infrastructure and natural/cultural resources are the most important factors. Gursoy et al. (2009) categorised 10 Middle Eastern destinations into four areas of competitiveness. Nazmfar et al. (2019) found that although Middle Eastern countries such as Turkey and the UAE perform well, they are not overly competitive. Khan et al. (2017) examined the impact of air transport on tourism and found that air cargo transport has the greatest impact, while trade openness and railways are less effective.
The Travel and Tourism Competitiveness Index (TTCI) has been published every two years for 15 years, paving the way for the Travel and Tourism Development Index (TTDI). The TTDI aims to support sustainable and resilient growth of the travel and tourism sector and promote national development. It also assesses and compares various variables and regulations. The main objective of the transition from the TTCI to the TTDI is to broaden its focus to include themes such as sustainability, resilience and the role of the sector in social and economic development.
The TTDI consists of five sub-indices, 17 pillars and 112 indicators grouped in these pillars. However, the subindices are not included in the index calculation; they are only used for presentation and classification. Unlike previous TTCI versions, the TTDI includes columns for Non-Recreation Resources, Socioeconomic Resilience and Conditions, and Travel and Tourism Demand Pressure and Impact (World Economic Forum, 2022). Table 1 shows the 17 pillars and five sub-indices of the TTDI.
Travel & Tourism Development Index Framework-2021
| Enabling Environment | Travel and Tourism Policy and Enabling Conditions | Infrastructure | Travel and Tourism Demand Drivers | Travel and Tourism Sustainability |
|---|---|---|---|---|
| Business Environment | Prioritization Travel and Tourism | Air Transport Infrastructure | Natural Resources | Environmental Sustainability |
| Safety and Security | International Openness | Ground and Port Infrastructure | Cultural Resources | Socioeconomic Resilience and Conditions |
| Health and Hygiene | Price Competitiveness | Tourist Service Infrastructure | Non-Leisure Resources | Travel and Tourism Demand Pressure and Impact |
| Human Resources and Labour Market | ||||
| Information Communication Technologies | ||||
| (ICT) Readiness |
Tourism is an important sector for the economic development of many countries. In this intensely competitive field, inter-destination analyses are of great importance for destination authorities who want to increase their touristic attractiveness. Destinations that want to attract more visitors and generate more revenue must understand the indicators that determine their strengths and weaknesses. This study aims to analyse the advantages and disadvantages of Mediterranean countries in the global tourism sector. The study uses the World Economic Forum’s Travel and Tourism Development Index data for 2019 and 2021. While the 2019 data include 13 sub-indices, the missing parameters in the 2021 report were retrospectively evaluated for 2019. However, France was not included in the study due to outdated information. The dataset covers a total of eight Mediterranean countries, namely Spain, Turkey, Italy, Greece, Portugal, Egypt, Morocco and Tunisia.
In the study, the Multidimensional Scaling Method and PROMETHEE approach were used for data analysis. The data are taken from the World Economic Forum’s Travel and Tourism Development Index. The PROMETHEE approach, developed by Vincke and Brans (1985), is a common multi-criteria decision-making technique that enables pairwise comparison of alternatives (Nazmfar et al., 2019; Boujelben, 2017). This method has an important place among ranking techniques and was implemented in six stages using Microsoft Excel.
Multidimensional scaling analysis was performed on 17 variables belonging to the 2019 and 2021 indices to classify destinations that are similar and different in terms of competitiveness and to determine the strengths and weaknesses of these destinations. This statistical technique determines the relationships between units in a multidimensional space by using their distances based on a coordinate system (Hair et al., 2005; Hassan & Uşakli, 2013).
Based on information from the World Economic Forum’s 2021 study, Table 3 displays the travel and tourism business values, average receipts per arrival, and international tourist arrivals (ITA) and receipts (ITIR) for the nations under consideration. Italy, Spain and Turkey have the highest tourism arrivals, revenues and average income per arrival, respectively. Spain has approximately the same number of tourist arrivals and revenues. However, Turkey and Italy have not exactly equalised the ratio between tourism revenue and tourist arrivals. This demonstrates that Turkey is a cheap destination. Italy, Egypt and Spain are also the countries that create the most job opportunities.
PROMETHEE Method Stages
| Step 1. Normalise the evaluation matrix (decision matrix) | |
| Step 2. Comparing alternatives with other alternatives. | |
| Step 3. Calculate the preference function Pj(a,b). | D(Ma-Mb) ≤ 0 |
| Step 5. Determine leaving and entering transition flows. | |
| Step 6. Determine the net transition flow for each alternative. |
The Situation of Tourism in Mediterranean Countries
| Destination | ITA (thousands) | ITIR (millions) | T&TI GDP (million $) | T&TIE (jobs) |
|---|---|---|---|---|
| Spain | 18.957.9 | 18.477.4 | 28.183.8 | 829.7 |
| Turkey | 15.894.4 | 10.220.0 | 12.287.6 | 665.8 |
| Italy | 25.189.6 | 19.796.6 | 56.553.9 | 1518.6 |
| Greece | 7.217.0 | 4.932.9 | 5.892.2 | 244.4 |
| Portugal | 6.480.1 | 8.855.5 | 7.438.9 | 379.5 |
| Egypt | 3.500.0 | 4.397.6 | 9.477.7 | 965.4 |
| Morocco | 2.777.8 | 3.829.1 | 3.186.8 | 373.0 |
| Tunisia | 2.012.4 | 839.5 | 1.253.1 | 99.6 |
ITA: International Tourist Arrivals, ITIR: International Tourism Inbound Receipts, T&TI GDP: Travel & Tourism Gross Domestic Products, T&TIE: Travel & Tourism Industry Employment
According to the analysis of 38 indicators using the PROMETHEE method, among the 8 Mediterranean countries, Turkey, Egypt, Morocco and Tunisia received negative scores in 2019 and 2021. Turkey and Egypt showed a significant improvement compared to 2019, while Morocco and Tunisia showed a downward trend. Among the countries surveyed, Portugal ranked first in the favourable environment index. Spain, Italy, Greece and Portugal showed an upward trend with positive scores (Table 4).
Enabling Environment
| 2019 | 2021 | |||||||
|---|---|---|---|---|---|---|---|---|
| Phi+ | Phi- | Phi | Rank | Phi+ | Phi- | Phi | Rank | |
| Spain | 0,380 | 0,045 | 0,335 | 2 | 0,368 | 0,028 | 0,339 | 2 |
| Turkey | 0,090 | 0,294 | -0,203 | 6 | 0,094 | 0,286 | -0,191 | 6 |
| Italy | 0,269 | 0,114 | 0,154 | 3 | 0,261 | 0,083 | 0,177 | 3 |
| Greece | 0,259 | 0,194 | 0,065 | 4 | 0,224 | 0,148 | 0,076 | 4 |
| Portugal | 0,427 | 0,068 | 0,359 | 1 | 0,394 | 0,018 | 0,376 | 1 |
| Egypt | 0,066 | 0,363 | -0,297 | 8 | 0,205 | 0,226 | -0,021 | 5 |
| Morocco | 0,171 | 0,408 | -0,237 | 7 | 0,081 | 0,404 | -0,323 | 7 |
| Tunisia | 0,062 | 0,238 | -0,176 | 5 | 0,027 | 0,461 | -0,434 | 8 |
Italy, Morocco and Tunisia received negative scores in 2019. In 2021, a general negative trend was observed in the countries analysed (Table 5). Except for Egypt and Tunisia, all Mediterranean countries experienced a decrease in their scores in 2021, while Turkey and Portugal received negative scores. Egypt received the highest score in both years, while Italy and Morocco shared the last place in both years.
Favourable Conditions for Travel and Tourism Policy
| 2019 | 2021 | |||||||
|---|---|---|---|---|---|---|---|---|
| Phi+ | Phi- | Phi | Rank | Phi+ | Phi- | Phi | Rank | |
| Spain | 0,226 | 0,156 | 0,069 | 3 | 0,232 | 0,186 | 0,045 | 3 |
| Turkey | 0,198 | 0,178 | 0,019 | 4 | 0,204 | 0,220 | -0,015 | 6 |
| Italy | 0,144 | 0,369 | -0,224 | 8 | 0,150 | 0,307 | -0,157 | 7 |
| Greece | 0,289 | 0,192 | 0,096 | 2 | 0,268 | 0,209 | 0,059 | 2 |
| Portugal | 0,179 | 0,178 | 0,001 | 5 | 0,142 | 0,289 | -0,147 | 5 |
| Egypt | 0,306 | 0,187 | 0,119 | 1 | 0,426 | 0,173 | 0,253 | 1 |
| Morocco | 0,152 | 0,209 | -0,057 | 7 | 0,175 | 0,214 | -0,039 | 8 |
| Tunisia | 0,217 | 0,242 | -0,024 | 6 | 0,240 | 0,239 | 0,0008 | 4 |
Egypt, Morocco and Tunisia received negative scores in 2019 and 2021, showing that their infrastructure is not competitive with other Mediterranean countries (Table 6). Spain is the world leader in infrastructure, while Turkey showed the largest score increase between 2019 and 2021.
Infrastructure
| 2019 | 2021 | |||||||
|---|---|---|---|---|---|---|---|---|
| Phi+ | Phi- | Phi | Rank | Phi+ | Phi- | Phi | Rank | |
| Spain | 0,497 | 0,001 | 0,496 | 1 | 0,475 | 0,002 | 0,472 | 1 |
| Turkey | 0,148 | 0,183 | -0,035 | 5 | 0,190 | 0,151 | 0,039 | 5 |
| Italy | 0,347 | 0,030 | 0,316 | 3 | 0,349 | 0,029 | 0,320 | 2 |
| Greece | 0,241 | 0,090 | 0,150 | 4 | 0,221 | 0,096 | 0,124 | 4 |
| Portugal | 0,374 | 0,023 | 0,351 | 2 | 0,323 | 0,053 | 0,270 | 3 |
| Egypt | 0,049 | 0,383 | -0,333 | 6 | 0,075 | 0,305 | -0,230 | 6 |
| Morocco | 0,026 | 0,427 | -0,401 | 7 | 0,090 | 0,423 | -0,332 | 7 |
| Tunisia | 0,006 | 0,551 | -0,544 | 8 | 0,004 | 0,607 | -0,603 | 8 |
Greece, Egypt, Morocco and Tunisia received negative scores in factors affecting tourism demand in both years (Table 7). Turkey, which received a negative score in 2019, increased its score in 2021 and achieved a positive score. Along with Turkey, Spain, the only country that increased its score in 2019, ranked first in this index (Table 7).
Travel and Tourism Demand Drivers
| 2019 | 2021 | |||||||
|---|---|---|---|---|---|---|---|---|
| Phi+ | Phi- | Phi | Rank | Phi+ | Phi- | Phi | Rank | |
| Spain | 0,569 | 0,006 | 0,563 | 1 | 0,633 | 0 | 0,633 | 1 |
| Turkey | 0,144 | 0,179 | -0,034 | 4 | 0,191 | 0,149 | 0,042 | 4 |
| Italy | 0,550 | 0,009 | 0,541 | 2 | 0,515 | 0,016 | 0,498 | 2 |
| Greece | 0,074 | 0,228 | -0,154 | 5 | 0,065 | 0,257 | -0,191 | 5 |
| Portugal | 0,197 | 0,125 | 0,072 | 3 | 0,190 | 0,137 | 0,053 | 3 |
| Egypt | 0,056 | 0,313 | -0,257 | 6 | 0,06 | 0,286 | -0,223 | 6 |
| Morocco | 0,035 | 0,311 | -0,275 | 7 | 0,016 | 0,364 | -0,348 | 7 |
| Tunisia | 0,007 | 0,462 | -0,454 | 8 | 0,004 | 0,469 | -0,465 | 8 |
It was determined that Turkey, Morocco and Tunisia had negative scores in terms of sustainability in 2019 (Table 8). However, Greece was added to these countries in 2021 in terms of sustainability by entering a negative trend. Apart from these countries, it is noticed that Spain is in a downward trend and left its place in the ranking to Portugal.
Travel and Tourism Sustainability
| 2019 | 2021 | |||||||
|---|---|---|---|---|---|---|---|---|
| Phi+ | Phi- | Phi | Rank | Phi+ | Phi- | Phi | Rank | |
| Spain | 0,330 | 0,041 | 0,289 | 1 | 0,313 | 0,046 | 0,266 | 3 |
| Turkey | 0,011 | 0,481 | -0,470 | 8 | 0,032 | 0,463 | -0,430 | 7 |
| Italy | 0,330 | 0,051 | 0,278 | 3 | 0,343 | 0,048 | 0,295 | 2 |
| Greece | 0,259 | 0,153 | 0,106 | 5 | 0,179 | 0,209 | -0,030 | 5 |
| Portugal | 0,335 | 0,051 | 0,284 | 2 | 0,395 | 0,044 | 0,351 | 1 |
| Egypt | 0,336 | 0,167 | 0,168 | 4 | 0,322 | 0,136 | 0,186 | 4 |
| Morocco | 0,062 | 0,344 | -0,281 | 6 | 0,107 | 0,274 | -0,167 | 6 |
| Tunisia | 0,030 | 0,405 | -0,375 | 7 | 0,025 | 0,496 | -0,471 | 8 |
Multidimensional scaling (MDS) is a statistical technique that analyses the relationships between objects in a multidimensional space by examining the distances between coordinates (Hair et al., 2005). The ALSCAL algorithm proposed by Takane et al. (1977) is widely used in MDS analysis. The two main metrics prominent in MDS are the Stress value and the RSQ (squared correlation) coefficient. Stress measures how well the model reflects the observed distance matrix and decreases as the distances between objects approach the original values (Ozdamar, 2004). The RSQ coefficient indicates the fit of the model. Ideally, RSQ should be close to 1 and Stress should be close to zero. In this study, the Stress value was calculated as 0.00621 and the RSQ coefficient as 0.99981 and the analysis was found appropriate. A scatter diagram (Figure 1) showing a linear distribution of distances and differences also supports the model fit.
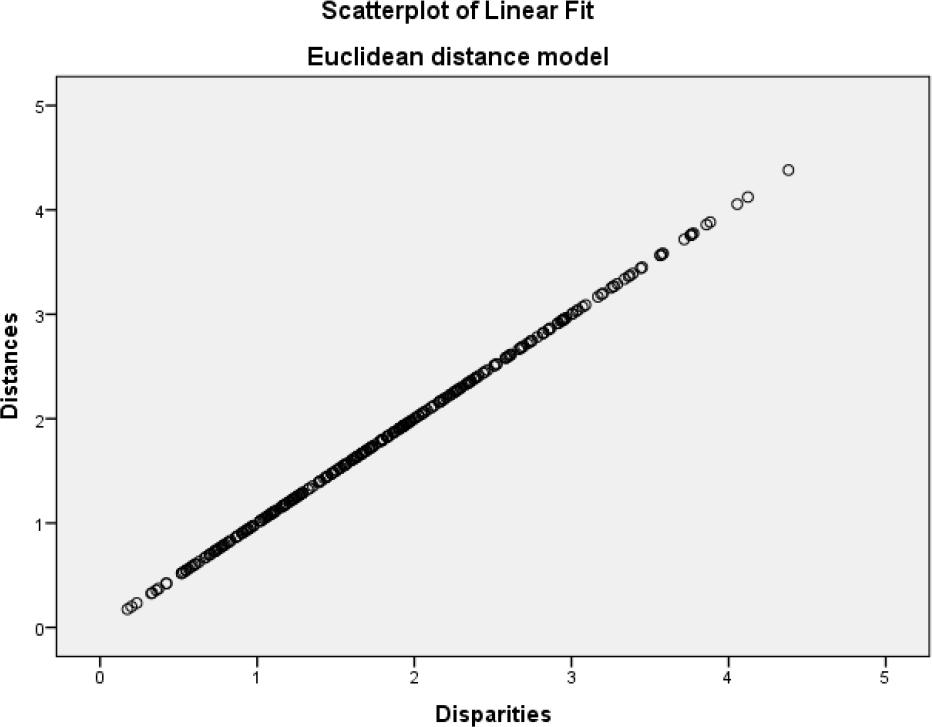
Spread Diagram
In the perception map, the closer objects are to each other, the more similar they are, and the further apart, the more different they are. For example, the competition profiles of Spain and Italy are quite similar, while Turkey and Egypt, Portugal and Greece are located relatively close. In contrast, Spain and Tunisia have the farthest distances in dimension 1 and Greece and Egypt in dimension 2.
As seen in Figure 2, Non-Leisure Resources, Natural Resources and Sustainable Environment variables show similar effects. Safety and Security, ICT Readiness and Health and Hygiene variables have equal effects. In addition, International Openness, Cultural Resources and Tourism Service Infrastructure variables also exhibit similar effects.
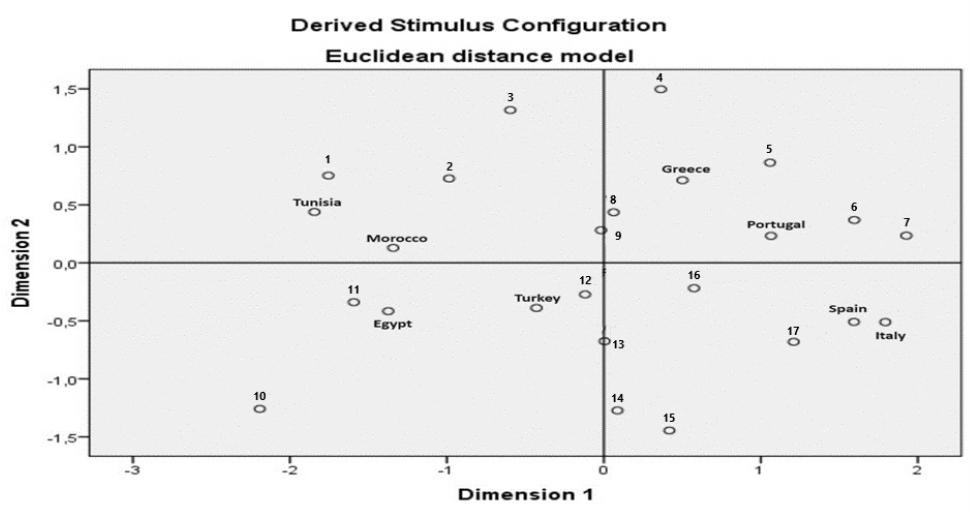
Perceptual Map of Countries Based on Competitiveness Factor
1. Safety and Security, 2. Information Communication Technologies, 3. Health and Hygiene, 4. Tourist Service Infrastructure, 5. International Openness, 6. Cultural Resources, 7. Natural Resources, 8. Air Transport Infrastructure, 9. Socioeconomic Resilience and Conditions, 10. Price Competitiveness, 11. Prioritization Travel and Tourism, 12. Human Resources and Labour Market, 13. Environmental Sustainability, 14. Business Environment, 15. Travel and Tourism Demand Pressure and Impact, 16. Ground and Port Infrastructure, 17. Non-leisure Resources.
The first factor affecting the competitiveness of tourism is the enabling environment, which consists of subindices numbered 14, 1, 3, 12 and 2 as shown in Figure 2. These sub-indices have 9, 6, 6, 9 and 8 components respectively. Sub-index 14 measures how friendly the political environment is for businesses within a country, while sub-index 1 determines the degree to which citizens, visitors and businesses are exposed to security threats. The security of infrastructure, accessibility and health care are measu red by sub-index 3. Sub-index 12 measures the dynamism, efficiency and productivity of the labour market, while sub-index 2 assesses the growth of digital services and ICT infrastructure (World Economic Forum, 2022). In this study, Portugal, Spain, Italy and Greece stand out in this indicator. The findings are like other studies in the literature (Hassan & Uşakli, 2013; Hanafiah et al., 2017; Lasisi et al., 2023). In addition, Nazmfar et al. (2019), in parallel with the findings of this study, found that Turkey and Egypt received negative scores in the positive environmental index in 2015 and 2017.
Sub-indices 10, 11 and 5 in Figure 2 form the sub-indices of the index of favourable conditions for travel and tourism policy. Sub-index 5 measures a country’s readiness to receive visitors and provide travel services, while sub-index 11 assesses the support provided by investors and government for the expansion of the T&T sector. Subindex 10 measures the cost of travelling or investing in each country. These sub-indices have 5, 4 and 5 components respectively (World Economic Forum, 2022). This study found that the overall performance of Mediterranean countries in this index is inadequate, and the results are in line with the studies conducted by Öncüer and Küçükgüney Muca (2022). Furthermore, Sercek and Yıldız (2022), who analysed the destination competitiveness of Southern European countries, found that Spain and Portugal ranked well in the travel and tourism policy activation sub-index compared to other countries.
Infrastructure is crucial to the competitiveness of a destination (Chan et al., 2022), and there is a very influential relationship between international tourism and the transportation system (Khan et al., 2017). As shown in Figure 2, sub-indices 16, 4 and 8 constitute the infrastructure framework in the Travel and Tourism Development Index. The infrastructure component is analysed in a total of 16 indices and there are 4, 7 and 5 elements related to the sub-indices respectively. Efficiency of road transportation (bus, metro, etc.), quality of transportation, quality of highways, quality of railways, quality of ports, quality of aviation infrastructure are more important indices that are effective in increasing tourism competitiveness (World Economic Forum, 2022). Spain ranked first in the infrastructure index results. This finding supports the results of the study conducted by Hassan and Uşakli (2013). Additionally, Aydemir et al. (2014) determined the competitiveness factors between Turkey and European countries in terms of the tourism sector. In parallel with the findings of this study, it was found that Turkey’s improvement efforts in sub-index 8 positively affected tourism activities, but Turkey was found to be in poor condition in index 16.
Destination attractiveness is recognised as a factor of tourism destination competitiveness (Ritchie & Crouch, 1993). In Figure 2, sub-indices 7, 6 and 17 constitute the Aspects Affecting Travel and Tourism Demand component and these sub-indices include 5, 6 and 4 aspects respectively. Sub-index 7 considers both the growth of outdoor tourism activities and the existing natural assets of countries. Sub-index 6 looks at the amount of UNESCO designated Cultural World Heritage sites, creative cities and archaeological sites as well as recreational opportunities. A significant proportion of travel and tourism revenues come from business and other non-recreational travel, and the attractiveness and scope of these trips is measured by sub-index 17 (World Economic Forum, 2022). In fact, Lo et al. (2017) concluded that sub-indices 7 and 6 have a significant and positive relationship with the competitiveness of tourism destinations. This study revealed that countries such as Spain and Italy are rich in indices 7, 6 and 17. Considering the number of tourists in these countries, the results of this study seem to support the literature. In addition, Nazmfar et al. (2019) found that among the Middle Eastern countries, Turkey has the greatest competitiveness in terms of indices 7 and 6. In this study, it is stated that Turkey has made progress in this field in recent years.
Sustainability is an attractive factor for the development of a destination and a tool to improve the quality of service (Aguiló et al., 2005). As indicated in Figure 2, sub-indices 13, 9 and 15 are included in the sustainability of travel and tourism components. These sub-indices contain 15, 7 and 7 elements respectively. Sub-index 13 basically assesses how resilient an economy is to climate change, how well it protects its natural resources and how sustainable its environment is in general. Promoting gender equality, diversifying the labour force, giving workers more rights and training, reducing the proportion of unemployed or uneducated young adults, increasing worker productivity and creating a larger and better-quality labour pool are linked to sub-index 9. The presence of risk associated with crowding and demand volatility and all variables that may indicate the quality and impact of travel and tourism are covered by sub-index 15. The length of stay of visitors, seasonality of tourism, representations of the distribution of tourism and the distribution of financial gains from travel and tourism to nearby cities are also measured (World Economic Forum, 2022). Although it has been concluded that Spain is the leader in the sustainability index, it has been observed that Portugal has entered an upward trend. Turkey, Morocco and Tunisia, which border the Middle East, were found to fail in this area. In parallel to this, Yildirgan et al. (2021) reported that Turkey received a negative score in sub-index 13 compared to other Mediterranean basin destinations. These findings are consistent with the findings of this study.
The Travel and Tourism Development Index is made up of 17 variables (data from 2019 and 2021) that were subjected to multidimensional scaling analysis to classify the competitive similarities and differences between destinations and identify their advantages and disadvantages. The fact that each destination offers unique products and all of them have a competitive factor that contributes to comparative advantage makes them closer to different competitive factors and models (Cronjé & du Plessis, 2020). For instance, a country’s level of competitiveness in each field increases with its proximity to a competitiveness variable on the map (Gursoy et al., 2009; Hassan & Uşakli, 2013). In this study, it was determined that there were similarities in the competitive profiles of the countries, like the index results. It has been determined that Turkey and Egypt have similar competitive profiles. However, Hassan and Uşakli (2013), in their study examining the Mediterranean countries, determined that France, Spain, Italy and Greece were a separate group, while Tunisia, Morocco and Egypt were a separate group. They determined that Turkey has a different profile from these destinations. Analysing the competitiveness profiles of tourism destinations in the Caribbean region, Pérez León et al. (2021) used a similar analysis and found that Mexico is distinguished from other countries in the region by its competitive profile. In addition, in this study, the positions of competitive factors were determined. The effect of subindex 10 was found to be low compared to other factors. This finding is consistent with the findings of the study conducted by Kayar and Kozak (2010). Furthermore, in a study assessing the competitiveness of tourism destinations through Kazakhstan, Tleuberdinova et al. (2024) found that sub-index 10 has a low impact. Furthermore, Kayar and Kozak (2010) found that sub-indices 3, 16, 7, 6 and 8 have comparable effects with this study. In addition, Goral (2016) determined the weighting results as Natural and Cultural Resources (35.0%), Infrastructure (29.0%), Environmental Factors (21.0%) and Possible Tourism Policies and Conditions (15.0%). Fernández et al. (2020) found that the subindices 8, 6 and 2 enumerated in this study are the most influential factors of tourism competitiveness.
Many nations view the tourist sector as a vital source of economic, cultural, and social resources, and it has been expanding and developing in recent years. Most countries are trying to provide appropriate infrastructures in order to benefit from these resources and to gain competitive advantage by taking advantage of opportunities. The Mediterranean region is among the important centres of attraction for tourists with its historical and natural beauties. These nations’ tourism sectors have generally developed, which offers their locations an advantage in drawing travelers. This study aims to determine the general competitiveness levels and strengths and weaknesses of the places in the Mediterranean region using data from the Travel and Tourism Development Index of the World Economic Forum. It has been determined that Spain and Italy, as well as Portugal, have the strongest performance in terms of destination competitiveness among the countries analysed. While the overall destination competitiveness positions of Spain, Italy, Turkey and Egypt show an improvement compared to other values in 2019, Portugal, Morocco and Tunisia show a negative trend compared to their values in 2019. On the other hand, Greece has not been able to improve its competitiveness. Destinations among Mediterranean countries in Europe have similar rankings in terms of their share of tourism revenues. It is only found that there is an inverse relationship between Turkey’s tourist arrivals and travel and tourism revenues and the Travel and Tourism Development Index.
As a result of the Multidimensional Scaling Analysis conducted on the 17 variables that make up the Travel and Tourism Development Index, it was concluded that countries are basically divided into 4 groups (according to the level of competition of countries). In conclusion, Spain and Italy, Turkey and Egypt, Portugal and Greece, Morocco and Tunisia have close competitive profiles through the perception map. It is determined that North African destinations and Turkey, which are outside European destinations, are superior to other countries in terms of price competitiveness. This reveals that North African destinations and Turkey are planning to host tourists by following a low-price policy. As a result, a low-cost destination image is created for these countries.
The competitiveness of tourism destinations has been widely discussed in the literature. In particular, studies such as Dwyer and Kim (2003) and Crouch and Ritchie (1999) indicate that destinations can increase their competitiveness through factors such as infrastructure, price, natural and cultural resources. In this study, the fact that Spain, Italy and Portugal have highly competitive power among Mediterranean destinations reveals that these countries provide competitive advantage with their infrastructure investments and effective tourism management as well as their cultural and natural heritage. This research has shown that Turkey and North African countries are more advantageous than other destinations in terms of price competitiveness. In line with studies such as Papatheodorou (2002), this indicates that price-orientated competition may create a low-cost image in some destinations. However, it has been reported in the literature that low price strategies can negatively affect the perception of quality and reduce the perceived value of destinations in the long run (Dwyer et al., 2000). Therefore, it is emphasised that price competition should be considered not only as a short-term advantage but also as a sustainable strategy supported by quality service. It has been observed that countries in the Mediterranean region have similar competitive profiles. Studies such as Boley and McGehee (2014) and Buhalis (2000) suggest that competitiveness is directly related to the effectiveness of marketing strategies and that destinations can achieve more sustainable results by differentiating themselves and focusing on specific market segments. In this context, Mediterranean countries can strengthen their competitive advantage by focusing on specific types of tourism.
The fact that Turkey and North African countries position themselves with a low-price strategy attracts a certain number of price-sensitive tourists to these destinations. However, to reduce the negative effects of the low-price image, it is recommended that these destinations diversify the services they offer without compromising on quality. This can contribute to higher revenues by increasing the perceived value of the tourist product (Enright & Newton, 2004). Countries such as Spain, Italy and Portugal have made investments in infrastructure and service quality that have contributed positively to their tourism revenues. Similarly, Turkey and North African countries can ensure long-term tourism success by prioritising infrastructure improvements and sustainable tourism development policies (Ritchie & Crouch, 2003). In particular, improving transport infrastructure and providing tourists with a more comfortable travel experience are seen as factors that will increase destination competitiveness. It is important to ensure long-term sustainability in the competitive strategies of destinations. Increasing the positive effects of tourism, especially through environmental and social sustainability practices, can contribute to the perceived value of destinations (Blancas et al., 2010). In this context, especially for countries such as Spain and Italy, environmentally friendly policies and tourism activities that preserve local culture stand out as factors that increase the attractiveness of the destination.
The important contribution of this research is its methodology. Unlike other studies literately, this study combining two methods has determined the general situation of the destinations, ranked them, determined in which areas they stand out, and identified their strengths and weaknesses. However, this study also has certain limitations compared to other studies in literature. For instance, the validity and reliability of the World Economic Forum index are dependent upon the validity and reliability of the data utilised in this study. Therefore, it can conduct surveys with tourists and interviews with managers to determine the competitiveness of destinations. An additional constraint of the research is that France, a significant Mediterranean destination, was left out of the analysis because the index utilised for the study lacked certain necessary data. A comparison of Mediterranean countries can be made with a data set that includes France. Moreover, several things influence a destination’s competitiveness. However, only those listed in the Travel and Tourism Development Index are considered in this analysis and visitors’ comments are not included. The competitiveness of destinations can be determined through programming such as big data from websites where visitor comments are available.