

Figure 1:
Model of the research
Table 1:
Participants' demographics
| Individual Characteristics | f | % |
|---|---|---|
| Gender | ||
| Male | 227 | 58.8 |
| Female | 159 | 41.2 |
| Total | 386 | 100 |
| Age Group | ||
| 18–25 | 77 | 19.95 |
| 26–31 | 114 | 29.53 |
| 32–37 | 64 | 16.59 |
| 38–43 | 58 | 15.02 |
| 44–49 | 46 | 11.92 |
| 50 years and over | 27 | 7 |
| Total | 386 | 100 |
| Education Level | ||
| High School | 74 | 19.17 |
| Associate degree | 86 | 22.28 |
| Bachelor's degree | 158 | 40.93 |
| Master's/Doctoral Degree | 68 | 17.62 |
| Total | 386 | 100 |
| Marital Status | ||
| Single | 189 | 48.96 |
| Married | 197 | 51.04 |
| Total | 386 | 100 |
| Monthly Income | ||
| 12.000 TL and below | 58 | 15.02 |
| 12.001–20.000 | 103 | 26.68 |
| 20.001–28.000 | 77 | 19.95 |
| 28.001–36.000 | 68 | 17.67 |
| 36.001–44.000 | 44 | 11.4 |
| 44.001 TL and over | 36 | 9.33 |
| Total | 386 | 100 |
Table 2:
The results of the measurement items
| Items | Factor Loadings |
|---|---|
| SWB-1 | 0.885 |
| SWB-2 | 0.859 |
| SWB-3 | 0.758 |
| SWB-4 | 0.717 |
| Subjective well-being: α=0.867, CR=0.905, AVE=0.656 | |
| SDTM-1 | 0.841 |
| SDTM-2 | 0.836 |
| SDTM-3 | 0.765 |
| SDTM-4 | 0.723 |
| SDTM-5 | 0.751 |
| SDTM-6 | 0.612 |
| SDTM-7 | 0.680 |
| SDTM-8 | 0.719 |
| SDTM-9 | 0.622 |
| SDTM-10 | 0.574 |
| SDTM-11 | 0.563 |
| SDTM-12 | 0.615 |
| SDTM-13 | 0.571 |
| SDTM-14 | 0.603 |
| SDTM-15 | 0.556 |
| SDTM-16 | 0.543 |
| SDTM-17 | 0.566 |
| SDTM-18 | 0.527 |
| SDTM-19 | 0.548 |
| Self-determined travel motivation: α=0.891, CR=0.904, AVE=0.635 | |
| REV-1 | 0.918 |
| REV-2 | 0.907 |
| REV-3 | 0.882 |
| Intention to revisit: α=0.897, CR=0.903, AVE=0.642 |
Table 4:
The results of hypotheses testing
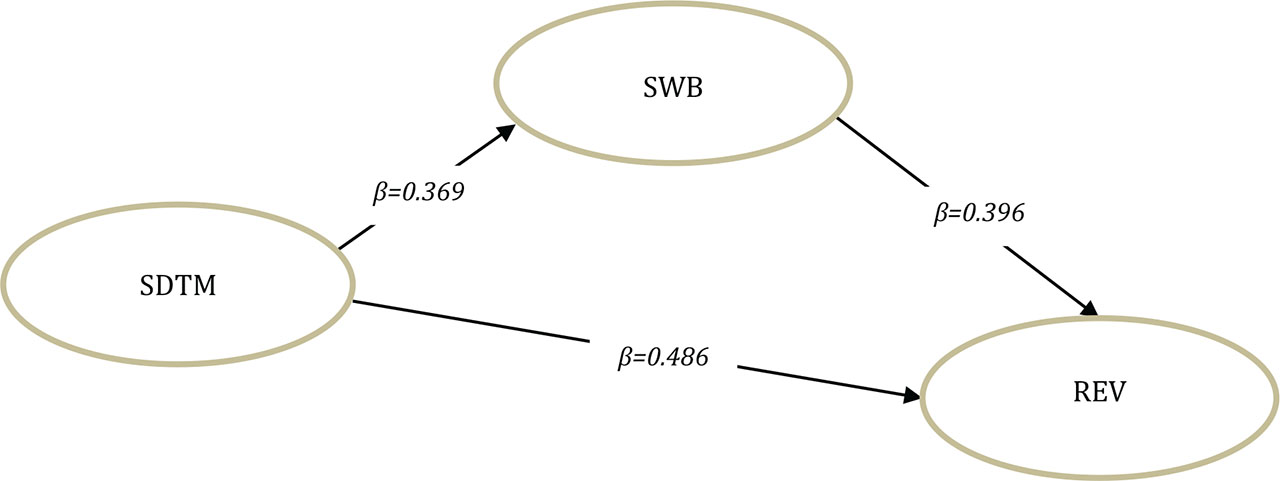
Figure 2:
Structural model