
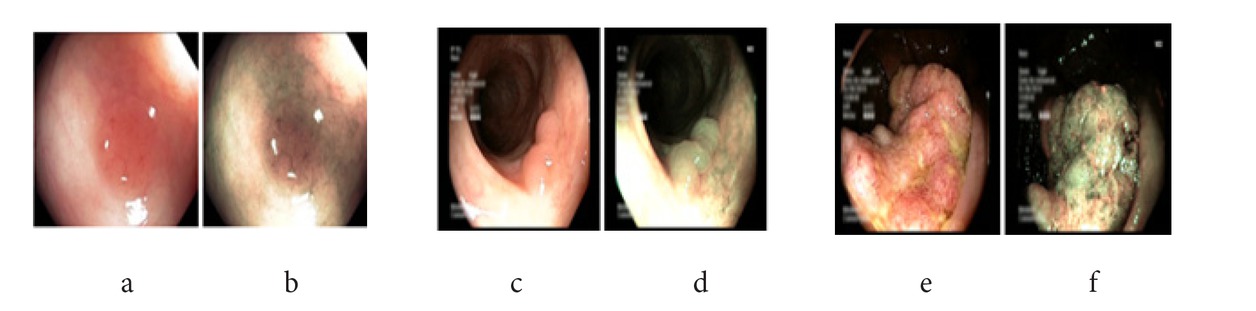
Figure 1
Sample images obtained using WLI and NBI imaging modality during colonoscopy for different types of polyps: a) hyperplastic (WLI), b) hyperplastic (NBI), c) serrated (WLI), d) serrated (NBI), e) adenomatous (WLI), and f) adenomatous (NBI).
Table 1
The number of test and training samples according to polyp-based stratification (80% polyps used in the training and 20% in the test set).
| Adenoma | Serrated | Hyperplastic | |
|---|---|---|---|
| Resection | No-resection | ||
| Training | 32 | 12 | 17 |
| Test | 8 | 3 | 4 |
Table 2
Number of extracted frames for each class.
| Class Types | |||
|---|---|---|---|
| Adenoma | Serrated | Hyperplastic | |
| Imaging Modality | Resection | No-resection | |
| NBI | 3544 | 1228 | 1162 |
| WLI | 1990 | 779 | 574 |
Table 3
According to the polyps-based stratification, number of frames for each class (N: No-resection, R: Resection, A: Adenoma, H: Hyperplastic, S: Serrated).
| 2-Class NBI | 2-Class WLI | 3-Class NBI | 3-Class WLI | |||||||
|---|---|---|---|---|---|---|---|---|---|---|
| N | R | N | R | A | H | S | A | H | S | |
| Test | 1162 | 4772 | 574 | 2769 | 3544 | 1162 | 1220 | 1990 | 574 | 779 |
| Train | 6991 | 22175 | 6795 | 26147 | 20504 | 6991 | 5964 | 21311 | 6795 | 4816 |
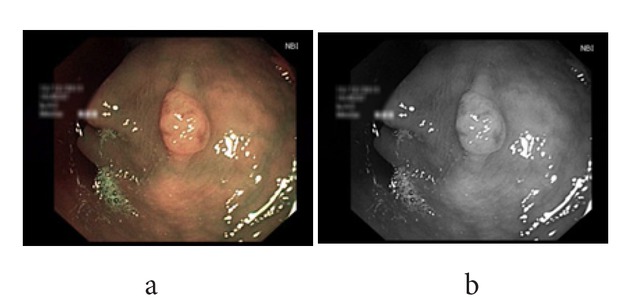
Figure 2
(a) Original colonoscopy image and (b) gray scale image.
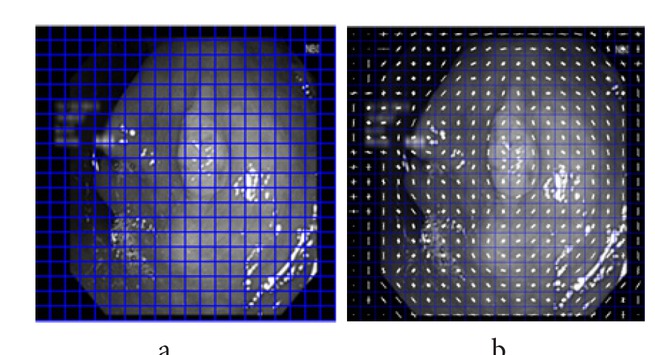
Figure 3
Blue squares define a cell with 10x10 pixels yielding a total of 400 cells (a). On each cell HOG features were overlayed (b).
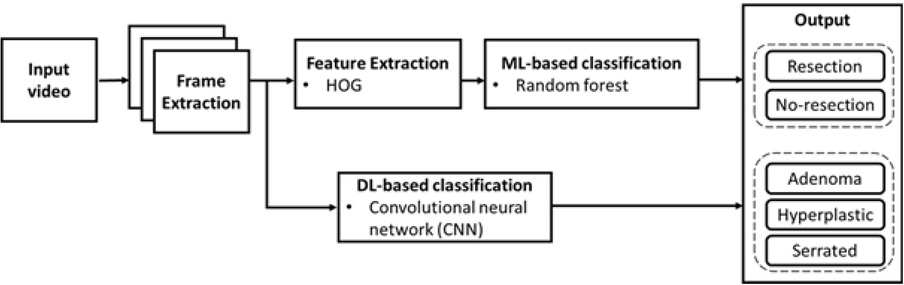
Figure 4
The pipeline of the comparison methods
Table 4
Accuracy of classification results.
| Imaging Modality | Tissue Types | Machine Learning | Deep Learning |
|---|---|---|---|
| NBI | A-H | 0.874 | 0.752 |
| A-H-S | 0.632 | 0.694 | |
| WLI | A-H | 0.944 | 0.745 |
| A-H-S | 0.587 | 0.759 |
Table 5
Accuracy of the doctors’ predictions.
| A-H | A-H-S | |
|---|---|---|
| Expert 1 | 0.82 | 0.64 |
| Expert 2 | 0.83 | 0.69 |
| Expert 3 | 0.78 | 0.65 |
| Expert 4 | 0.77 | 0.58 |
| Novice 1 | 0.78 | 0.60 |
| Novice 2 | 0.86 | 0.68 |
| Novice 3 | 0.75 | 0.51 |